Abstract
Low doses of ethanol cause flies to become hyperactive, while high doses are sedating. The sensitivity to ethanol-induced sedation of a given fly strain is correlated with that strain s ethanol preference, and therefore sedation is a highly relevant measure to study the genetics of alcohol responses and drinking. We demonstrate a simple way to expose flies to ethanol and measure its intoxicating effects. The assay we describe can determine acute sensitivity, as well as ethanol tolerance induced by repeat exposure. It does not require a technically involved setup, and can therefore be applied in any laboratory with basic fly culture tools.
Keywords: Neuroscience, Issue 48, Drosophila, behavior, alcohol, addiction
Protocol
1. Creating the exposure chamber
Cut a vial plug in half using a razor blade. Alternatively, use cotton balls.
Push the vial plug half, or the cotton ball, to the bottom of a food vial to make a smooth surface that flies will not get stuck in.
If making multiple exposure chambers, make sure that the vial plug and food take up the same volume in each chamber. A mark on the side of the vial can facilitate this.
2. Exposing the flies
Collect 8 flies of one sex, age 1-5 days, the day before exposure into regular food vials without yeast.
Label them in code, such that the experimenter is blinded to the actual genotype/strain used.
Transfer the eight flies into the exposure chambers by tapping. Do not anesthetize.
Add a small amount of food dye, e.g. acid blue 9, to 200 proof ethanol to make it easily visible.
Coat the bottom of a vial plug, or cotton ball, with 0.5 ml ethanol.
Insert the ethanol plug into the exposure vial. Ensure that the alcohol is facing into the vial, and not towards the wall of the vial.
Start a timer counting up.
3. Record ethanol-induced intoxication
Each minute after the timer is started, tap the exposure chamber on the bench to startle the flies and observe them for ten seconds.
Record the number of stationary flies for each minute. Flies are stationary if they cannot get off their backs, remain in one location, or rapidly vibrate their wings throughout the entire ten-second observation-period. The latter flies are considered stationary because the vast majority of these flies are stationary between periods of rapid wing movement. Flies are NOT stationary if they can get off their backs and walk away and/or up the vial wall.
An exposure trial is finished when 4 or more flies are recorded as stationary.
Discard flies and let the exposure chamber air out for later reuse.
4. Determine the time to 50% sedation
The time to 50% sedation (ST50) is the time after the start of the ethanol exposure when four of the eight flies remain stationary. This is determined as follows: Either: the first measurement minute when exactly four flies are stationary. Or: if less than four flies (Y1) are stationary at one time point (minute X), and more than four (Y2) at the next measuring time point (minute X+1), then linearly interpolate the ST50 using the formula: ST50 = (4 - Y1)/(Y2 - Y1) + X
5. Repeat exposure to determine tolerance
Exposing the flies
Determine the ST50(wt) for the wild-type control strain used in your experiment.
Expose the experimental groups of flies to ethanol as described above.
Measure their ST50(1), but continue to expose until you reach the time 2x ST50(wt).
Transfer the flies back into an empty food vial, and hold for 4 hours.
Re-expose the flies, and determine the ST50(2) of exposure 2.
Determine tolerance
Calculate tolerance in % as (ST50(2)/ ST50(1) - 1)x100.
6. Representative Results:
Shown here, are some representative results we obtained with 6-8 vials of flies per genotype and dose. If your standard error is substantially larger, then a systematic problem likely occurred. Make sure that the ethanol faces into the exposure chambers, and that the chambers are the same volume.
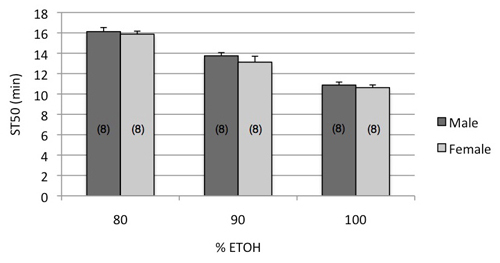
 Figure 1. Dose response curve of wild type flies exposed to increasing percentages of ethanol. Eight vials of flies were exposed per dose and sex. Male and female flies show the same ST50 at each dose (p>0.22, 2-way ANOVA), while the ST50 across doses decreases significantly with increasing ethanol dose (p<0.001). Note that flies from over-crowded bottles can be substantially smaller than those from healthy bottles, and this size difference can affect the ST50. Seed each bottle with 15-20 females laying for 1-2 days to get optimal larval density per bottle.
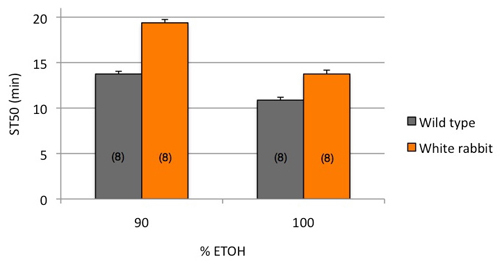
 Figure 2. Exposing flies to either 90%, or 100% ethanol reproduces the previously described ethanol-resistance caused by the white rabbit1 mutation2 (p<0.001, 2-way ANOVA).
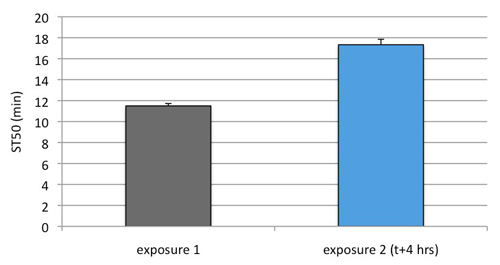
 Figure 3. Repeat exposure to 100% ethanol, spaced by a 4 hour recovery interval, causes a significant increase in ST50 after the second exposure (p<0.001, paired t-test). Note that the flies were exposed for 24 minutes during the first exposure (corresponding to twice their na ve ST50). Exposure for a shorter amount of time (12 minutes) did not cause a significant increase in ST50 upon re-exposure (data not shown).
Discussion
In this presentation, we have outlined a simple way to determine ethanol-induced intoxication based on previous assays described by Bainton et al. 20001, and Rothenfluh et al. 20062. Since alcohol-induced sedation is correlated with alcohol drinking preference3, this assay is relevant for the study of alcohol use disorders. The assay described is based on startle-induced negative geotaxis, and how an alcohol exposure interferes with this innate response. Before starting the exposures, make sure all your flies show a normal response to such a startle, i.e. after tapping down the flies in the food vial, they should all move up from the bottom within a 10 second observation time. Examples of flies having reduced negative geotaxis include bang-sensitive seizure mutants5, and locomotion-deficient flies caused by degeneration of dopamine neurons6.
Even though the described assay is relatively simple, two variables merit the most attention to ensure reproducible results. First, all exposure vials should be the same volume. This includes making sure that the bottom of the vial contains the same volume of food + vial plug/cotton ball, as well as inserting the ethanol-containing plug the same distance for every vial. A completely empty vial can be used for this assay, but it leads to longer ST50 values, decreasing the throughput of the assay.
This assay is also suitable to determine the amount of tolerance flies develop upon repeat ethanol exposure. A number of variables should be considered when doing repeat exposures. First, the inter-exposure interval is here described as 4 hours. This variable can be changed, but we recommend it not be lower than 2 hours, to ensure clearance of ethanol from the first exposure. See Scholz et al. 20004 for the kinetics of ethanol tolerance development and decay. The second variable to consider is the duration of the first exposure. This obviously has to be the same for the control and the experimental flies. However, this may not result in the same amount of ethanol delivered to both these fly strains. Sedated flies absorb more ethanol than active flies2, therefore a strain that sedates earlier may receive a higher dose than a later-sedating strain, and thus develop more tolerance due to a higher initial dose. We strongly caution the reader when comparing tolerance development of strains that show differences in the initial ST50(1).
The assay we describe here is a useful tool in easily and reproducibly determining flies behavioral responses to alcohol.
Disclosures
No conflicts of interest declared.
Acknowledgments
We thank Aylin Rodan for critical reading of the manuscript, and members of the lab for helpful discussion. This research is supported by the NIH, R01AA019526.
References
- Bainton RJ, Tsai LT-Y, Singh CS, Moore MS. Curr. Biol. 2000;10:187–194. doi: 10.1016/s0960-9822(00)00336-5. [DOI] [PubMed] [Google Scholar]
- Rothenfluh A, Threlkeld RJ, Bainton RJ, Tsai LT-Y. Cell. 2006;127:199–211. doi: 10.1016/j.cell.2006.09.010. [DOI] [PubMed] [Google Scholar]
- Devineni AV, Heberlein U. Curr. Biol. 2009;19:2126–2132. doi: 10.1016/j.cub.2009.10.070. [DOI] [PMC free article] [PubMed] [Google Scholar]
- Scholz H, Ramond J, Singh CS, Heberlein U. Neuron. 2000;28:261–271. doi: 10.1016/s0896-6273(00)00101-x. [DOI] [PubMed] [Google Scholar]
- Allen MJ, Godenschwege TA, Tanouye MA, Phelan P. Semin. Cell Dev. Biol. 2006;17:31–41. doi: 10.1016/j.semcdb.2005.11.011. [DOI] [PubMed] [Google Scholar]
- Feany MB, Bender WW. Nature. 2000;404:394–398. doi: 10.1038/35006074. [DOI] [PubMed] [Google Scholar]


