

Abstract
Background:
Obesity is associated with hyperparathyroidism and increased bone mass and turnover, but their pathogeneses are unclear.
Aims:
Our aim was to determine in obesity interrelationships among serum levels of leptin, the mineral-regulating hormones, bone turnover markers, and sclerostin.
Methods:
This case-control study was performed in 20 women having bariatric surgery and 20 control women matched for race and age. Anthropometrics and fasting serum biochemistries were measured in controls and in bariatric patients the morning of surgery.
Results:
Body mass index (48.9 vs. 25.4 kg/m2), weight (128.6 vs. 71.9 kg), serum leptin (74.6 vs. 25.2 ng/ml), PTH (44.5 vs. 28.8 pg/ml), fibroblast growth factor 23 (FGF23) (42.4 vs. 25.9 pg/ml), and bone alkaline phosphatase (BAP) (25.8 vs. 17.5 U/liter) were higher, but height (162.3 vs. 167.7 cm) and 1,25-dihydroxyvitamin D (1,25D) (39.2 vs. 48.7 pg/ml) were lower in bariatric surgery patients than controls. There was no difference in serum sclerostin, amino-terminal collagen cross-links, 25-hydroxyvitamin D (25D), calcium, phosphate, and creatinine between groups. In the combined sample, leptin was positively related to PTH, FGF23, and BAP but not to 1,25D or sclerostin. Multiple regression analysis demonstrated that PTH was predicted by leptin and Ca (R2 = 0.39); 1,25D by 25D, FGF23, and phosphate (R2 = 0.43); FGF23 by leptin and 1,25D (R2 = 0.27); BAP by leptin, PTH, and Ca (R2 = 0.39); and sclerostin by leptin and PTH (R2 = 0.20).
Conclusions:
Women having bariatric surgery had higher leptin, PTH, FGF23, and BAP and lower 1,25D than controls. Leptin predicted the serum levels of PTH, 1,25D, and FGF23, the mineral-regulating hormones, and BAP, a bone formation marker, in women with body mass index ranging from 13.9–65.8 kg/m2. The results suggest that leptin has an endocrine or paracrine effect on PTH and FGF23 production and that PTH may be one of the signals in obesity that leads to increased bone mass.
It is well established from cross-sectional studies in the general adult population that body fat is positively associated with bone mineral density (1–5). Furthermore, patients having bariatric surgery for obesity have higher bone mineral density than nonobese control subjects (6, 7). Increased mechanical load on the skeleton from the weight of fat tissue acting through a biomechanical sensing system, the mechanostat (8), is generally considered the most plausible mechanism. An essential component of the mechanostat is considered to be the network of canaliculi and osteocytes that pervades bone (9). Mechanical loading studies in animals indicate that stimulated new bone formation is accompanied by down-regulation of sclerostin in osteocytes resulting in disinhibition of the WNT signaling pathway, a major regulator of bone mass and bone mass accrual (10, 11).
Fat tissue functions as an endocrine organ that links nutrition to other body systems (12). Thus, the relationship between fat mass and bone mass may also reside in one of the adipokines secreted by fat tissue. Leptin is a likely candidate because its serum concentration closely mirrors fat mass (13). Serum leptin has been shown to relate positively to bone mineral density in a number of studies (14–18). However, in some studies when serum leptin concentrations are corrected for body weight, leptin relates negatively to bone mineral density (19, 20). Evidence of abundant functional leptin receptors in osteoblasts supports a role for leptin in bone formation (21, 22). Furthermore, several animal studies have demonstrated effects of leptin administration on bone. Leptin-deficient ob/ob mice administered leptin ip had increased bone mineral density, bone mineral content, and femoral length (23) and decreased bone fragility (24). In ovariectomized rats, continuous sc leptin administration attenuated cancellous bone loss (25). These effects on bone suggest that leptin may act in concert with the hormones responsible for mineral homeostasis and metabolism, namely PTH, 1,25-dihydroxyvitamin D (1,25D), and fibroblast growth factor 23 (FGF23). These hormones form an integrated system for regulating calcium and phosphate transport at the gut, bone, and kidney and are essential for mineral retention by the skeleton (26).
Of the three mineral-regulating hormones, PTH is most consistently reported to be increased in obesity (27–30). Furthermore, serum PTH and body mass index (BMI) are positively related in samples of healthy subjects (31–34). We and others have shown serum PTH in obesity is independent of vitamin D status and does not represent, as is commonly assumed, secondary hyperparathyroidism from vitamin D insufficiency (30, 35). Given as daily sc injections, PTH is strongly anabolic, causing increased bone turnover and increased bone mass in patients with osteoporosis (36). In a mouse model, PTH increases bone mass by down-regulating sclerostin production in osteocytes (37, 38). PTH also increases the activity of 1α-hydroxylase, promoting production of renal 1,25D, the main regulator of active calcium absorption in the gut. In obesity, reported serum levels of 1,25D are inconsistent, with some studies finding increased levels (27, 28) and others decreased levels (39). On the other hand calcium absorption is positively related to 1,25D in obesity and decreases after weight loss induced by bariatric surgery (40). In obesity, serum concentrations of FGF23 have not been studied, although a recent publication reports that serum FGF23 relates positively with fat mass in elderly subjects (41). FGF23 is secreted by bone cells (42) and down-regulates renal 1,25D production and phosphate reabsorption (43, 44). It is a major bone hormone regulating phosphate homeostasis and vitamin D metabolism, although its influence in modulating bone mass remains to be established.
In a previous case control study in obesity, we speculated that the hyperparathyroidism and high bone turnover we observed in obesity may be directly related to serum leptin levels and that the serum PTH levels might link bone mass to fat mass by influencing secretion of sclerostin (30). Thus, the aims of this study were to examine the effect of simple obesity on the relationships among the serum levels of leptin, PTH, 1,25D, and FGF23 and to investigate whether their effect on serum sclerostin might explain the influence of obesity on bone metabolism.
Subjects and Methods
Subjects
Subjects were 20 white women presenting to St. Vincent's Bariatric Surgery Center in Carmel, IN, for Roux-en-Y gastric bypass surgery for obesity between November 2005 and April 2007. Seven of the bariatric surgery subjects were postmenopausal, and of these, four were on sex steroid replacement therapy. These subjects were drawn randomly from an ongoing study to evaluate the effect of bariatric surgery on anthropomorphic, biochemical, and hormonal markers. All subjects provided informed consent for the study. The protocol was approved by the Institutional Review Board of Indiana University-Purdue University (Indianapolis, IN) and St. Vincent's Hospital (Indianapolis, IN). Only samples drawn between the months of November through April during the years 2005, 2006, and 2007 were collected to minimize influence of seasonal changes in sunlight exposure on vitamin D status. Only white women were included to eliminate any potential variability due to race and sex on the variables.
Controls were 20 premenopausal women randomly selected from a database of healthy women who had previously consented and donated fasting blood samples to the Indiana Clinical Research Center for observational research between November 2005 and April 2007. They were matched to subjects for age, race, and date of blood draw.
Methods
Height was measured using a Harpenden stadiometer and weight measured using a ScaleTronix scale. Age was recorded at the time of blood collection. BMI was calculated as kilograms per square meter. Biochemistries were measured in serum that had been stored at −80 C. Leptin was measured by ELISA [within-assay coefficient of variation (CV) of 3.7%, between-assays CV of 4.0%; Millipore, St. Charles, MO). PTH was measured by a two-site immunoassay (CV of 9.7% at 17.5 pg/ml; Nichols Institute Diagnostics, San Juan Capistrano, CA). 25-Hydroxyvitamin D (25D) and 1,25D were measured by RIA (CV of 8.1 and 9.1%, respectively, DiaSorin, Stillwater, MN). FGF23 was measured by ELISA (CV of 4.4%; Kainos Laboratories, Inc., Tokyo, Japan). Sclerostin was measured by ELISA (within-assay CV of 5.5%, between-assays CV of 5.8%; TECOmedical, Sissach, Switzerland). Amino-terminal collagen cross-links (NTX) was measured by ELISA (within-assay CV of 4.6%, between-assays CV of 6.9%; Wampole Laboratories, Princeton, NJ). Bone alkaline phosphatase (BAP) was measured by ELISA (within-assay CV of 5.0%, between-assays CV of 5.9%; Quidel, San Diego, CA), and Ca, inorganic phosphorous (Pi), albumin, and creatinine (Cr) were measured using Roche COBAS MIRA Clinical Analyzer (Roche Diagnostic, Indianapolis, IN).
Data analysis
SAS version 9.2 (SAS, Cary, NC) was used to perform all statistical analyses. The distributions of variables were examined, and skewed data were transformed to produce normal distributions. Means for all variables were compared between the bariatric surgery and control groups using two-sample t tests. Inspection of the distributions of the variables indicated that the two groups overlapped. Therefore, Pearson correlations were performed on the total 40 subjects to assess relationships among variables. The correlation plots were inspected for potential bias from postmenopausal status. Multiple regression analysis was performed to explore the contributions of serum leptin and other selected variables including postmenopausal status to serum concentrations of PTH, 25D, BAP, NTX, sclerostin, and FGF23. Variables selected for inclusion in the multiple regression analyses were based on physiologically expected outcomes. The following variables were included for: 1) leptin, Ca, 1,25D, 25D, FGF23, and Pi for PTH; 2) leptin, Ca, PTH, 25D, FGF23, sclerostin, and Pi for 1,25D; 3) leptin, Ca, 25D, 1,25D, FGF23, Pi, and PTH for BAP; 4) leptin, Ca, PTH, 25D, 1,25D, FGF23, Pi for sclerostin; and 5) leptin, Ca, PTH, 25D, 1,25D, sclerostin, and Pi for FGF23. Stepwise and r2 methods were used for model selection (45). Model R2 and partial R2 of the individual model parameters are reported, where R2 (the square of r) is the coefficient of determination and represents the portion of total variation attributable to the variables in the model.
Results
Anthropometric and biochemical variables (Table 1)
Table 1.
Anthropomorphic and serum biochemical variables in bariatric surgery and control groups
| Bariatric (n = 20) | Control (n = 20) | P value | |
|---|---|---|---|
| Age (yr) | 44.4 ± 8.9 (30–63) | 41.3 ± 6.9 (30–55) | 0.22 |
| Height (cm) | 162.3 ± 6.0 (152.4–172.7) | 167.7 ± 6.7 (150.8–176.5) | 0.012 |
| Weight (kg) | 128.6 ± 23.0 (100.9–173.1) | 71.9 ± 20.1 (36.2–114.7) | <0.0001 |
| BMI (kg/m2) | 48.9 ± 8.7 (37.2–65.8) | 25.4 ± 6.2 (13.9–36.8) | <0.0001 |
| Leptin (ng/ml) | 74.7 ± 19.3 (42.4–109.3) | 25.2 ± 18.2 (3.3–57.6) | <0.0001 |
| PTH (pg/ml) | 44.5 ± 19.3 (16.4–89.3) | 28.8 ± 8.3 (15.4–43.1) | <0.0001a |
| 1,25D (pg/ml) | 39.2 ± 11.6 (17.8–61.3) | 48.7 ± 17.5 (19.7–89.6) | 0.049 |
| FGF23 (pg/ml) | 42.4 ± 15.5 (15.8–82.3) | 25.9 ± 8.1 (13.9–42.0) | 0.0002 |
| Sclerostin (ng/ml) | 0.802 ± 0.34 (0.143–1.524) | 0.668 ± 0.15 (0.470–1.024) | 0.12 |
| BAP (U/liter) | 25.8 ± 7.5 (16.3–45.6) | 17.5 ± 4.5 (9.1–26.3) | 0.0001 |
| NTX (nm BCE) | 15.9 ± 6.25 (8.2–37.8) | 12.8 ± 4.2 (5.6–27.2) | 0.06a |
| 25D (ng/ml) | 19.5 ± 7.6 (7.6–30.3) | 23.6 ± 5.2 (11.6–31.1) | 0.06 |
| Calcium (mg/dl) | 9.13 ± 0.23 (8.3–9.7) | 9.22 ± 0.24 (8.9–9.8) | 0.37 |
| Albumin (g/dl) | 4.83 ± 0.41 (4.0–5.5) | 4.98 ± 0.32 (3.9–5.4) | 0.22 |
| Phosphate (mg/dl) | 3.59 ± 0.41 (2.8–4.3) | 3.62 ± 0.54 (2.7–4.7) | 0.87 |
| Creatinine (mg/dl) | 0.73 ± 0.13 (0.5–1.0) | 0.75 ± 0.11 (0.6–1.0) | 0.51 |
Results are shown as mean ± sd (range). BCE, Bone collagen equivalents.
P value based on log-transformed values.
The bariatric surgery subjects were shorter (P = 0.012) and heavier (P < 0.0001) than the controls but did not differ in age. All the bariatric patients were severely obese (BMI >35 kg/m2), and of the controls, six were obese (BMI >30 kg/m2) and four were overweight (BMI = 25.0–29.9 kg/m2). Leptin (P < 0.0001), PTH (P < 0.0001), FGF23 (P = 0.0002), and BAP (P < 0.0001) were higher, and 1,25D (P = 0.049) was lower in the bariatric surgery group. There was no significant difference in sclerostin, 25D, NTX, Ca, Pi, or Cr between groups. Postmenopausal status did not affect any of the biochemical variables except NTX, which was higher in the postmenopausal patients.
Pearson correlations (Table 2)
Table 2.
Pearson correlations in bariatric surgery and control groups combined (n = 40)
| Leptin | PTH (log) | 1,25D | FGF23 | Sclerostin | BAP | NTX (log) | 25D | Ca | Pi | Cr | Age | |
|---|---|---|---|---|---|---|---|---|---|---|---|---|
| BMI | 0.91c | 0.33a | −0.37a | 0.53c | 0.23 | 0.38a | 0.19 | −0.33a | −0.07 | −0.05 | −0.13 | 0.11 |
| Leptin | 0.46b | −0.29 | 0.47b | 0.29 | 0.48b | 0.28 | −0.34a | −0.07 | −0.12 | −0.14 | 0.10 | |
| PTH (log) | −0.07 | 0.10 | −0.16 | 0.44b | 0.20 | −0.14 | 0.46b | −0.21 | 0.07 | 0.02 | ||
| 1,25D | −0.35a | −0.10 | −0.22 | −0.07 | 0.54c | −0.17 | −0.19 | 0.16 | −0.03 | |||
| FGF23 | 0.14 | 0.23 | 0.21 | −0.15 | 0.02 | 0.01 | 0.06 | 0.04 | ||||
| Sclerostin | 0.20 | 0.29 | 0.09 | 0.20 | 0.04 | −0.03 | 0.31 | |||||
| BAP | 0.49c | −0.33a | 0.13 | −0.04 | −0.13 | 0.15 | ||||||
| NTX (log) | 0.07 | 0.13 | 0.33a | 0.21 | 0.41b | |||||||
| 25D | −0.16 | 0.11 | 0.43b | 0.16 | ||||||||
| Ca | −0.05 | 0.02 | 0.20 | |||||||||
| Pi | −0.04 | 0.34a | ||||||||||
| Cr | 0.02 |
P < 0.05.
P < 0.01.
P < 0.001.
In the bariatric surgery and control groups combined (n = 40), BMI correlated positively with leptin (P < 0.0001), PTH (P = 0.036), FGF23 (P = 0.0004), and BAP (P = 0.02) and negatively with 1,25D (P = 0.018) and 25D (P = 0.04). Leptin correlated positively with PTH (P = 0.003), FGF23 (P = 0.002), and BAP (P = 0.002) (Figure 1, A–C) and negatively with 25D (P = 0.03). PTH correlated negatively with Ca (P = 0.001) and positively with BAP (P = 0.004). 1,25D was negatively correlated with FGF23 (P = 0.03) (Fig. 2) and positively correlated with 25D (P = 0.0003). Sclerostin did not relate to any of the variables measured. BAP correlated positively with NTX (P = 0.001) and negatively with 25D (P = 0.04). Age was positively related to NTX (P = 0.009) and Pi (P = 0.03). Postmenopausal status did not affect the correlations judged by inspection of the correlation plots and significance of the r values.
Fig. 1.

The relationship between serum leptin and serum PTH (R2 = 0.21; P < 0.01) (A), serum 1,25D (R2 = 0.08; P = 0.07) (B), and serum FGF23 (R2 = 0.22; P < 0.01) (C) in bariatric patients (●) and control women (○) (n = 40).
Fig. 2.
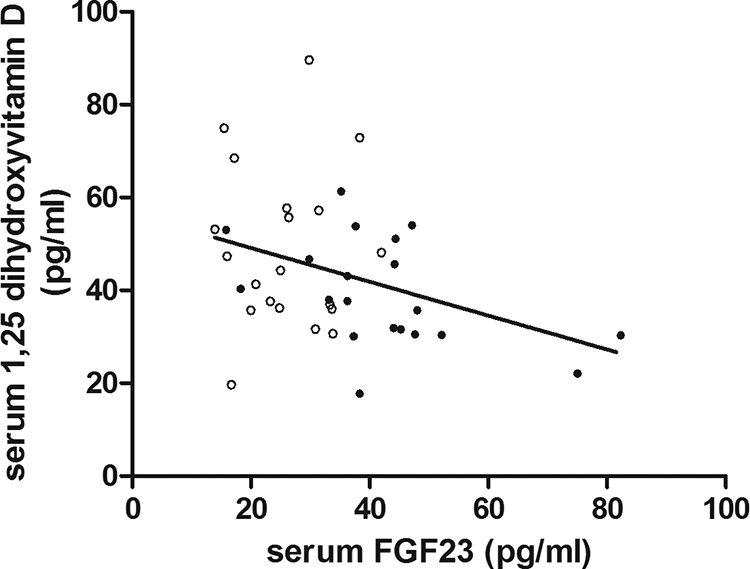
The relationship between serum FGF23 and serum 1,25D (R2 = 0.12; P = 0.03) in bariatric patients (●) and control women (○) (n = 40).
Multiple regression models (Table 3)
Table 3.
Multiple regression models
| Coefficient | Partial R2 | P value | Model | |
|---|---|---|---|---|
| PTH (log pg/ml) | ||||
| Intercept | 8.43 | R2 = 0.39 | ||
| Leptin (ng/ml) | 0.006 | 0.21 | 0.0018 | P = 0.0001 |
| Ca (mg/dl) | −0.57 | 0.18 | 0.002 | |
| 1,25D (pg/ml) | ||||
| Intercept | 56.77 | |||
| 25D (ng/ml) | 1.20 | 0.29 | 0.0002 | R2 = 0.43 |
| FGF23 (pg/ml) | −0.28 | 0.07 | 0.0438 | P = 0.0001 |
| Pi (mg/dl) | −8.12 | 0.06 | 0.0598 | |
| FGF23 (pg/ml) | ||||
| Intercept | 34.29 | |||
| Leptin (pg/ml) | 0.19 | 0.22 | 0.009 | R2 = 0.27 |
| 1,25D (pg/ml) | −0.22 | 0.05 | 0.1209 | P = 0.0028 |
| BAP (U/liter) | ||||
| Intercept | −91.22 | |||
| Leptin (ng/ml) | 0.08 | 0.23 | 0.0019 | R2 = 0.39 |
| PTH (log pg/ml) | 8.56 | 0.06 | 0.08 | P = 0.0004 |
| Ca | 8.66 | 0.10 | 0.0195 | |
| Sclerostin (ng/ml) | ||||
| Intercept | 1.40 | |||
| Leptin (ng/ml) | 0.004 | 0.09 | 0.0066 | R2 = 0.20 |
| PTH (log pg/ml) | −0.25 | 0.11 | 0.0268 | P = 0.0145 |
The strongest predictor for PTH was leptin (partial R2 = 0.21; P < 0.002), followed by Ca (partial R2 = 0.18; P = 0.002). Correlation slope was positive for leptin and negative for Ca.
The strongest predictor for 1,25D was 25D (partial R2 = 0.29; P = 0.0002), followed by FGF23 (partial R2 = 0.07; P = 0.04) and Pi (partial R2 = 0.06; P = 0.06). The correlation slope for 25D was positive, whereas those for FGF23 and Pi were negative.
The strongest predictor for FGF23 was leptin (partial R2 = 0.22; P = 0.009) followed by 1,25D (partial R2 = 0.05; P = 0.12). The correlation slope was positive for leptin and negative for 1,25D.
The strongest predictor for BAP was leptin (partial R2 = 0.23; P = 0.002) followed by PTH (partial R2 = 0.06; P = 0.08) and Ca (partial R2 = 0.10; P = 0.02). The three correlation slopes were positive.
The strongest predictor for sclerostin was PTH (partial R2 = 0.11; P = 0.03) followed by leptin (partial R2 = 0.09; P = 0.007). The correlation was negative for PTH and positive for leptin.
Menopausal status was not a significant predictor in the multiple regression models, and excluding postmenopausal did not affect the results of the original analysis.
Discussion
This case control study of patients scheduled for bariatric surgery demonstrated that obesity is associated with abnormal serum levels of PTH, 1,25D, and FGF23, the primary hormones regulating calcium and phosphate homeostasis. Although abnormalities in serum PTH (27–30) and 1,25D (27, 46) are well described, this study is one of the first to describe abnormal serum levels of FGF23, the main hormone regulating phosphate homeostasis. Furthermore, the data suggest that the changes in serum levels of these mineral-regulating hormones are, in part, due to effects of the levels of serum leptin, the adipocyte hormone that best reflects total body fat in subjects with simple obesity (13). In the current study, serum leptin correlated with BMI with an r value of over 0.9.
Increased serum PTH concentrations are well described in obesity (28–30). Many researchers have attributed these increases to secondary hyperparathyroidism in response to low serum levels of 25D, which is a common finding in obesity (27, 32). However, we (30) and others (35) have shown that vitamin D insufficiency does not explain the hyperparathyroidism of obesity, and the current study corroborates this. Although the 25D levels in this study ranged from 7.6–31.1 ng/ml in the bariatric patients and the control subjects combined, there was no significant relationship between PTH and 25D. Nor was the increase in PTH due to decreased renal function, a common accompaniment of obesity (47), because Cr was in the normal range in both groups, and there was no relationship between PTH and Cr. On the other hand, there was a positive significant relationship between PTH and leptin over a leptin range of 3.3–109.3 ng/ml. Multiple regression analysis demonstrated that serum leptin was the highest predictive serum variable for PTH with Ca providing only a small negative prediction. If the association between leptin and PTH is causative, it implies that leptin directly affects PTH secretion either through endocrine or paracrine mechanisms. There are no direct studies to support or refute either of these mechanisms. However, it is perhaps relevant that obese patients with primary hyperparathyroidism have higher serum PTH and higher parathyroid tumor weight than nonobese patients (48, 49), suggesting that leptin acts to increase parathyroid cell mass. Thus, leptin may be acting as a mitogene (50) regulating parathyroid cell mass through paracrine mechanisms. There was no observable effect of PTH on Ca, Pi, or 1,25D, suggesting that either the PTH changes may not be large enough to measure a response in these target variables or that other regulatory factors dominate. Despite this, as discussed below, PTH predicted bone formation marker, BAP, indicating its role in bone turnover.
In this study, FGF23 was higher in the bariatric patients than the controls and positively correlated with leptin. Leptin directly stimulates FGF23 synthesis in bone cells in the ob/ob mouse (51), suggesting that leptin may be an endocrine or paracrine regulator of FGF23 production in humans. A major action of FGF23 is to decrease renal tubular reabsorption of Pi (52), and thus a decrease in Pi might have been expected. However, this was not seen; Pi did not differ between bariatric and control subjects, and there was no relationship between Pi and FGF23. Renal tubular reabsorption of Pi was not directly measured in this study, and an effect of an increase in FGF23 on renal Pi transport cannot be excluded.
Serum 1,25D has been reported to be both high (27) and low (39) in obesity. The explanation for this lack of consistency is not clear. It may lie in variation in the size and heterogeneity of the samples of patients reported and in the technique of measuring 1,25D by immunoassay, which is not completely specific and measures other vitamin D metabolites in serum. In this study 1,25D was lower in the bariatric patients than in controls. It is interesting that 1,25D was negatively related to FGF23 in light of increasing evidence that FGF23 is a major down-regulator of renal 1,25D secretion (43, 52). In this study, there was no relationship between 1,25D and PTH, suggesting that in obesity, FGF23 suppression of 1,25D secretion overrides any stimulatory effect of PTH. The opposing effect of FGF23 and PTH on 1,25D secretion may also be part of the explanation for the variation in reported values of 1,25D in obesity.
As we and others have shown previously (30, 53), bone turnover markers are increased in obesity. In this study, there was the expected relationship between a formation marker, BAP, and a bone resorption marker, NTX. However, the most significant difference between bariatric surgery patients and controls was found in the bone formation marker BAP. In multiple regression analysis, both PTH and leptin positively predicted BAP, suggesting a direct effect of leptin on the osteoblast.
Sclerostin, produced by osteocytes, is a major regulator of bone mass, and its production is down-regulated by PTH (37). Patients with primary hyperparathyroidism have lower serum sclerostin levels than euparathyroid control subjects, and there is an inverse relationship between serum PTH and sclerostin levels (54) In this study, although there was no difference in serum sclerostin between bariatric surgery subjects and controls, multiple regression analysis indicated that PTH negatively predicted serum sclerostin concentrations, suggesting that the PTH-sclerostin relationship may be one of the factors linking high bone mass with high fat mass.
Weaknesses of the study are that it involved relatively small sample sizes and studied only white women. Future studies in men and subjects of different races will be needed to show whether these results can be replicated and applied more generally. The study was cross-sectional, and detailed longitudinal studies before and after bariatric surgery will be required to establish the factors that trigger the abnormalities in the mineral-regulating hormones, and how these change with reductions in fat mass. The study was not matched for postmenopausal status. Although bariatric patients and control subjects were matched for age, seven of the bariatric patients were postmenopausal and four of these were on sex steroid replacement therapy. However, serum NTX was the only biochemical variable that was influenced by postmenopausal status. The strength to the study is that it is a case control study in subjects that overlap and span a wide range of BMI. The study corroborates our recent study showing that hyperparathyroidism in obesity is not vitamin D or renal function dependent (30). Furthermore, it corroborates our hypothesis that serum leptin is one of the factors directly involved in the mechanisms leading to changes in the mineral-regulating hormones.
In summary, this case control study of patients selected for bariatric surgery demonstrates that they have increased PTH and FGF23 and that these changes directly relate to changes in leptin. The results suggest that leptin has an endocrine or paracrine effect on PTH and FGF23 production. Serum 1,25D was reduced and appeared to be the result of increased FGF23.
Acknowledgments
This work was supported by UL1RR025761 and National Institutes of Health grant R01 DK 089070.
Disclosure Summary: E.G., K.H., R.J., B.M.C., A.A., R.V.C., and M.P. have nothing to declare.
Footnotes
- BMI
- Body mass index
- Cr
- creatinine
- CV
- coefficient of variation
- 1,25D
- 1,25-dihydroxyvitamin D
- 25D
- 25-hydroxyvitamin D
- FGF23
- fibroblast growth factor 23
- NTX
- amino-terminal collagen cross-links
- Pi
- inorganic phosphorous.
References
- 1. Dawson-Hughes B, Shipp C, Sadowski L, Dallal G. 1987. Bone density of the radius, spine, and hip in relation to percent of ideal body weight in postmenopausal women. Calcif Tissue Int 40:310–314 [DOI] [PubMed] [Google Scholar]
- 2. Reid IR, Ames R, Evans MC, Sharpe S, Gamble G, France JT, Lim TM, Cundy TF. 1992. Determinants of total body and regional bone mineral density in normal postmenopausal women: a key role for fat mass. J Clin Endocrinol Metab 75:45–51 [DOI] [PubMed] [Google Scholar]
- 3. Felson DT, Zhang Y, Hannan MT, Anderson JJ. 1993. Effects of weight and body mass index on bone mineral density in men and women: the Framingham study. J Bone Miner Res 8:567–573 [DOI] [PubMed] [Google Scholar]
- 4. Glauber HS, Vollmer WM, Nevitt MC, Ensrud KE, Orwoll ES. 1995. Body weight versus body fat distribution, adiposity, and frame size as predictors of bone density. J Clin Endocrinol Metab 80:1118–1123 [DOI] [PubMed] [Google Scholar]
- 5. Hla MM, Davis JW, Ross PD, Wasnich RD, Yates AJ, Ravn P, Hosking DJ, McClung MR. 1996. A multicenter study of the influence of fat and lean mass on bone mineral content: evidence for differences in their relative influence at major fracture sites. Early Postmenopausal Intervention Cohort (EPIC) Study Group. Am J Clin Nutr 64:354–360 [DOI] [PubMed] [Google Scholar]
- 6. Cundy T, Evans MC, Kay RG, Dowman M, Wattie D, Reid IR. 1996. Effects of vertical-banded gastroplasty on bone and mineral metabolism in obese patients. Br J Surg 83:1468–1472 [DOI] [PubMed] [Google Scholar]
- 7. Carrasco F, Ruz M, Rojas P, Csendes A, Rebolledo A, Codoceo J, Inostroza J, Basfi-Fer K, Papapietro K, Rojas J, Pizarro F, Olivares M. 2009. Changes in bone mineral density, body composition and adiponectin levels in morbidly obese patients after bariatric surgery. Obes Surg 19:41–46 [DOI] [PubMed] [Google Scholar]
- 8. Frost HM, Ferretti JL, Jee WS. 1998. Perspectives: some roles of mechanical usage, muscle strength, and the mechanostat in skeletal physiology, disease, and research. Calcif Tissue Int 62:1–7 [DOI] [PubMed] [Google Scholar]
- 9. Bonewald LF, Johnson ML. 2008. Osteocytes, mechanosensing and Wnt signaling. Bone 42:606–615 [DOI] [PMC free article] [PubMed] [Google Scholar]
- 10. Robling AG, Turner CH. 2009. Mechanical signaling for bone modeling and remodeling. Crit Rev Eukaryot Gene Expr 19:319–338 [DOI] [PMC free article] [PubMed] [Google Scholar]
- 11. Turner CH, Warden SJ, Bellido T, Plotkin LI, Kumar N, Jasiuk I, Danzig J, Robling AG. 2009. Mechanobiology of the skeleton. Sci Signal 2:pt3. [DOI] [PMC free article] [PubMed] [Google Scholar]
- 12. Deng Y, Scherer PE. 2010. Adipokines as novel biomarkers and regulators of the metabolic syndrome. Ann NY Acad Sci 1212:E1–E19 [DOI] [PMC free article] [PubMed] [Google Scholar]
- 13. Considine RV, Sinha MK, Heiman ML, Kriauciunas A, Stephens TW, Nyce MR, Ohannesian JP, Marco CC, McKee LJ, Bauer TL. 1996. Serum immunoreactive-leptin concentrations in normal-weight and obese humans. N Engl J Med 334:292–295 [DOI] [PubMed] [Google Scholar]
- 14. Thomas T, Burguera B, Melton LJ, 3rd, Atkinson EJ, O'Fallon WM, Riggs BL, Khosla S. 2001. Role of serum leptin, insulin, and estrogen levels as potential mediators of the relationship between fat mass and bone mineral density in men versus women. Bone 29:114–120 [DOI] [PubMed] [Google Scholar]
- 15. Yamauchi M, Sugimoto T, Yamaguchi T, Nakaoka D, Kanzawa M, Yano S, Ozuru R, Sugishita T, Chihara K. 2001. Plasma leptin concentrations are associated with bone mineral density and the presence of vertebral fractures in postmenopausal women. Clin Endocrinol (Oxf) 55:341–347 [DOI] [PubMed] [Google Scholar]
- 16. Pasco JA, Henry MJ, Kotowicz MA, Collier GR, Ball MJ, Ugoni AM, Nicholson GC. 2001. Serum leptin levels are associated with bone mass in nonobese women. J Clin Endocrinol Metab 86:1884–1887 [DOI] [PubMed] [Google Scholar]
- 17. Blain H, Vuillemin A, Guillemin F, Durant R, Hanesse B, de Talance N, Doucet B, Jeandel C. 2002. Serum leptin level is a predictor of bone mineral density in postmenopausal women. J Clin Endocrinol Metab 87:1030–1035 [DOI] [PubMed] [Google Scholar]
- 18. Dennison EM, Syddall HE, Fall CH, Javaid MK, Arden NK, Phillips DI, Cooper C. 2004. Plasma leptin concentration and change in bone density among elderly men and women: the Hertfordshire Cohort Study. Calcif Tissue Int 74:401–406 [DOI] [PubMed] [Google Scholar]
- 19. Blum M, Harris SS, Must A, Naumova EN, Phillips SM, Rand WM, Dawson-Hughes B. 2003. Leptin, body composition and bone mineral density in premenopausal women. Calcif Tissue Int 73:27–32 [DOI] [PubMed] [Google Scholar]
- 20. Morberg CM, Tetens I, Black E, Toubro S, Soerensen TI, Pedersen O, Astrup A. 2003. Leptin and bone mineral density: a cross-sectional study in obese and nonobese men. J Clin Endocrinol Metab 88:5795–5800 [DOI] [PubMed] [Google Scholar]
- 21. Reseland JE, Syversen U, Bakke I, Qvigstad G, Eide LG, Hjertner O, Gordeladze JO, Drevon CA. 2001. Leptin is expressed in and secreted from primary cultures of human osteoblasts and promotes bone mineralization. J Bone Miner Res 16:1426–1433 [DOI] [PubMed] [Google Scholar]
- 22. Lee YJ, Park JH, Ju SK, You KH, Ko JS, Kim HM. 2002. Leptin receptor isoform expression in rat osteoblasts and their functional analysis. FEBS Lett 528:43–47 [DOI] [PubMed] [Google Scholar]
- 23. Steppan CM, Crawford DT, Chidsey-Frink KL, Ke H, Swick AG. 2000. Leptin is a potent stimulator of bone growth in ob/ob mice. Regul Pept 92:73–78 [DOI] [PubMed] [Google Scholar]
- 24. Cornish J, Callon KE, Bava U, Lin C, Naot D, Hill BL, Grey AB, Broom N, Myers DE, Nicholson GC, Reid IR. 2002. Leptin directly regulates bone cell function in vitro and reduces bone fragility in vivo. J Endocrinol 175:405–415 [DOI] [PubMed] [Google Scholar]
- 25. Burguera B, Hofbauer LC, Thomas T, Gori F, Evans GL, Khosla S, Riggs BL, Turner RT. 2001. Leptin reduces ovariectomy-induced bone loss in rats. Endocrinology 142:3546–3553 [DOI] [PubMed] [Google Scholar]
- 26. Peacock M. 2010. Calcium metabolism in health and disease. Clin J Am Soc Nephrol 5(Suppl 1):S23–S30 [DOI] [PubMed] [Google Scholar]
- 27. Bell NH, Epstein S, Greene A, Shary J, Oexmann MJ, Shaw S. 1985. Evidence for alteration of the vitamin D-endocrine system in obese subjects. J Clin Invest 76:370–373 [DOI] [PMC free article] [PubMed] [Google Scholar]
- 28. Andersen T, McNair P, Hyldstrup L, Fogh-Andersen N, Nielsen TT, Astrup A, Transbøl I. 1988. Secondary hyperparathyroidism of morbid obesity regresses during weight reduction. Metabolism 37:425–428 [DOI] [PubMed] [Google Scholar]
- 29. Hamoui N, Anthone G, Crookes PF. 2004. Calcium metabolism in the morbidly obese. Obes Surg 14:9–12 [DOI] [PubMed] [Google Scholar]
- 30. Grethen E, McClintock R, Gupta CE, Jones R, Cacucci BM, Diaz D, Fulford AD, Perkins SM, Considine RV, Peacock M. 2011. Vitamin D and hyperparathyroidism in obesity. J Clin Endocrinol Metab 96:1320–1326 [DOI] [PMC free article] [PubMed] [Google Scholar]
- 31. Kamycheva E, Sundsfjord J, Jorde R. 2004. Serum parathyroid hormone level is associated with body mass index. The 5th Tromso study. Eur J Endocrinol 151:167–172 [DOI] [PubMed] [Google Scholar]
- 32. Snijder MB, van Dam RM, Visser M, Deeg DJ, Dekker JM, Bouter LM, Seidell JC, Lips P. 2005. Adiposity in relation to vitamin D status and parathyroid hormone levels: a population-based study in older men and women. J Clin Endocrinol Metab 90:4119–4123 [DOI] [PubMed] [Google Scholar]
- 33. Bolland MJ, Grey AB, Ames RW, Horne AM, Gamble GD, Reid IR. 2006. Fat mass is an important predictor of parathyroid hormone levels in postmenopausal women. Bone 38:317–321 [DOI] [PubMed] [Google Scholar]
- 34. Pitroda AP, Harris SS, Dawson-Hughes B. 2009. The association of adiposity with parathyroid hormone in healthy older adults. Endocrine 36:218–223 [DOI] [PMC free article] [PubMed] [Google Scholar]
- 35. Stein EM, Strain G, Sinha N, Ortiz D, Pomp A, Dakin G, McMahon DJ, Bockman R, Silverberg SJ. 2009. Vitamin D insufficiency prior to bariatric surgery: risk factors and a pilot treatment study. Clin Endocrinol (Oxf) 71:176–183 [DOI] [PMC free article] [PubMed] [Google Scholar]
- 36. Neer RM, Arnaud CD, Zanchetta JR, Prince R, Gaich GA, Reginster JY, Hodsman AB, Eriksen EF, Ish-Shalom S, Genant HK, Wang O, Mitlak BH. 2001. Effect of parathyroid hormone (1–34) on fractures and bone mineral density in postmenopausal women with osteoporosis. New Engl J Med 344:1434–1441 [DOI] [PubMed] [Google Scholar]
- 37. Bellido T, Ali AA, Gubrij I, Plotkin LI, Fu Q, O'Brien CA, Manolagas SC, Jilka RL. 2005. Chronic elevation of parathyroid hormone in mice reduces expression of sclerostin by osteocytes: a novel mechanism for hormonal control of osteoblastogenesis. Endocrinology 146:4577–4583 [DOI] [PubMed] [Google Scholar]
- 38. O'Brien CA, Plotkin LI, Galli C, Goellner JJ, Gortazar AR, Allen MR, Robling AG, Bouxsein M, Schipani E, Turner CH, Jilka RL, Weinstein RS, Manolagas SC, Bellido T. 2008. Control of bone mass and remodeling by PTH receptor signaling in osteocytes. PLoS One 3:e2942. [DOI] [PMC free article] [PubMed] [Google Scholar]
- 39. Konradsen S, Ag H, Lindberg F, Hexeberg S, Jorde R. 2008. Serum 1,25-dihydroxy vitamin D is inversely associated with body mass index. Eur J Nutr 47:87–91 [DOI] [PubMed] [Google Scholar]
- 40. Riedt CS, Brolin RE, Sherrell RM, Field MP, Shapses SA. 2006. True fractional calcium absorption is decreased after Roux-en-Y gastric bypass surgery. Obesity (Silver Spring) 14:1940–1948 [DOI] [PMC free article] [PubMed] [Google Scholar]
- 41. Mirza MA, Alsiö J, Hammarstedt A, Erben RG, Michaëlsson K, Tivesten A, Marsell R, Orwoll E, Karlsson MK, Ljunggren O, Mellström D, Lind L, Ohlsson C, Larsson TE. 2011. Circulating fibroblast growth factor-23 is associated with fat mass and dyslipidemia in two independent cohorts of elderly individuals. Arterioscler Thromb Vasc Biol 31:219–227 [DOI] [PubMed] [Google Scholar]
- 42. Yoshiko Y, Wang H, Minamizaki T, Ijuin C, Yamamoto R, Suemune S, Kozai K, Tanne K, Aubin JE, Maeda N. 2007. Mineralized tissue cells are a principal source of FGF23. Bone 40:1565–1573 [DOI] [PubMed] [Google Scholar]
- 43. Shimada T, Hasegawa H, Yamazaki Y, Muto T, Hino R, Takeuchi Y, Fujita T, Nakahara K, Fukumoto S, Yamashita T. 2004. FGF-23 is a potent regulator of vitamin D metabolism and phosphate homeostasis. J Bone Miner Res 19:429–435 [DOI] [PubMed] [Google Scholar]
- 44. Baum M, Schiavi S, Dwarakanath V, Quigley R. 2005. Effect of fibroblast growth factor-23 on phosphate transport in proximal tubules. Kidney Int 68:1148–1153 [DOI] [PubMed] [Google Scholar]
- 45. Kutner MHN, Christopher J, Neter J, Li W. 2005. Criteria for Model Selection. Applied Linear Statistical Models. New York: McGraw-Hill/Irwin; 353. –369 [Google Scholar]
- 46. Parikh SJ, Edelman M, Uwaifo GI, Freedman RJ, Semega-Janneh M, Reynolds J, Yanovski JA. 2004. The relationship between obesity and serum 1,25-dihydroxy vitamin D concentrations in healthy adults. J Clin Endocrinol Metab 89:1196–1199 [DOI] [PubMed] [Google Scholar]
- 47. Chalmers L, Kaskel FJ, Bamgbola O. 2006. The role of obesity and its bioclinical correlates in the progression of chronic kidney disease. Adv Chronic Kidney Dis 13:352–364 [DOI] [PubMed] [Google Scholar]
- 48. Adam MA, Untch BR, Danko ME, Stinnett S, Dixit D, Koh J, Marks JR, Olson JA., Jr 2010. Severe obesity is associated with symptomatic presentation, higher parathyroid hormone levels, and increased gland weight in primary hyperparathyroidism. J Clin Endocrinol Metab 95:4917–4924 [DOI] [PMC free article] [PubMed] [Google Scholar]
- 49. Cheng SP, Doherty GM, Chang YC, Liu CL. 2011. Leptin: the link between overweight and primary hyperparathyroidism? Med Hypotheses 76:94–96 [DOI] [PubMed] [Google Scholar]
- 50. Garofalo C, Surmacz E. 2006. Leptin and cancer. J Cell Physiol 207:12–22 [DOI] [PubMed] [Google Scholar]
- 51. Tsuji K, Maeda T, Kawane T, Matsunuma A, Horiuchi N. 2010. Leptin stimulates fibroblast growth factor 23 expression in bone and suppresses renal 1α,25-dihydroxyvitamin D3 synthesis in leptin-deficient mice. J Bone Miner Res 25:1711–1723 [DOI] [PubMed] [Google Scholar]
- 52. Shimada T, Kakitani M, Yamazaki Y, Hasegawa H, Takeuchi Y, Fujita T, Fukumoto S, Tomizuka K, Yamashita T. 2004. Targeted ablation of Fgf23 demonstrates an essential physiological role of FGF23 in phosphate and vitamin D metabolism. J Clin Invest 113:561–568 [DOI] [PMC free article] [PubMed] [Google Scholar]
- 53. Coates PS, Fernstrom JD, Fernstrom MH, Schauer PR, Greenspan SL. 2004. Gastric bypass surgery for morbid obesity leads to an increase in bone turnover and a decrease in bone mass. J Clin Endocrinol Metab 89:1061–1065 [DOI] [PubMed] [Google Scholar]
- 54. van Lierop AH, Witteveen JE, Hamdy NA, Papapoulos SE. 2010. Patients with primary hyperparathyroidism have lower circulating sclerostin levels than euparathyroid controls. Eur J Endocrinol 163:833–837 [DOI] [PubMed] [Google Scholar]