Abstract
A microbial high-throughput screening (HTS) system was developed that enabled high-speed combinatorial studies directly on bacterial colonies. The system consists of a forward scatterometer for elastic light scatter (ELS) detection, a plate transporter for sample handling, and a robotic incubator for automatic incubation. To minimize the ELS pattern-capturing time, a new calibration plate and correction algorithms were both designed, which dramatically reduced correction steps during acquisition of the circularly symmetric ELS patterns. Integration of three different control software programs was implemented, and the performance of the system was demonstrated with single-species detection for library generation and with time-resolved measurement for understanding ELS colony growth correlation, using Escherichia coli and Listeria. An in-house colony-tracking module enabled researchers to easily understand the time-dependent variation of the ELS from identical colony, which enabled further analysis in other biochemical experiments. The microbial HTS system provided an average scan time of 4.9 s per colony and the capability of automatically collecting more than 4000 ELS patterns within a 7-h time span.
INTRODUCTION
High-throughput screening (HTS) is an experimental screening technique used in pharmaceutical, biological, and analytical chemistry, both in industry and in academia. The three major components of an HTS system represent sample preparation, reaction chamber, and detection analysis. Typically equipped with robotic automatic sample handling, HTS systems have drawn much scientific and practical interest owing to their time- and money-saving ability that allows large number of combinatorial experiments in a relatively fast and inexpensive manner.
HTS systems are especially useful in biochemistry since they provide a platform for automatically correlating origin and expression relationships such as geno- and phenol-typing. For example, a liquid chromatography-mass spectrometry system has been used to deliver fast drug-screening results, and integration with a light-scatter detector provided an additional means of calculating concentration.1 Surface plasmon resonance and acoustic wave sensors were introduced to provide fast screening in gold nanoparticles2 and in volatile substances.3 In addition, a HTS system based on a confocal fluorescence-imaging reader in which four parallel assays were possible has been reported.4
In microbiology, conventional petri dish plating, first reported in the late 1880s, is still regarded as the standard method of screening owing to the experimental simplicity and the capability to provide specific assays and identification using special types of media. According to the recent prediction of Moore's law in microbiology,5 traditional petri dish-based assays are moving towards a microplate-based method and even further towards microfluidics6 and higher-density petri chip-based methods.7, 8 Owing to the recent development of automation hardware and software along with the integration of various technologies such as liquid handling and climate-controlled incubators, microplates (such as 48- and 96-well plates) are widely used in mainstream HTS for microbial research. HTS of microbial adaptation was reported by investigators who used a regular microwell plate reader using MTS (3-(4,5-dimethylthiazol-2-yl)-5-(3-carboxymethoxyphenyl)-2-(4-sulfophenyl)-2H-tetrazolium, inner salt; Ref. 9) or combined with colorimetric assays.10 Recently, using matrix-assisted laser desorption ionization-time-of-flight mass spectrometry, a study reported the screening of 327 clinical isolates from bacteria and yeast.11
Traditional screening methods using special media are effective in a limited number of species (e.g., sorbitol-MacConkey agar identifies Escherichia coli O157) or require special types of reagents to provide specificity with a mixture of different species.9, 12 Meanwhile, biochemical, serological or DNA characterization involves additional steps of sample enrichment in a liquid medium, plating on selective agar media to obtain single colonies, and use of special reagents for DNA isolation and polymerase chain reaction (PCR). All these methods take about 3-5 days to get confirmatory results and are labor intensive.13, 14, 15, 16 To overcome these drawbacks and provide identification for a broad range of species, a novel optical interrogation technique was introduced using a forward-scatter technique. Biophysical modeling17 and time-resolved experiments18 revealed that bacterial colonies were functioning as a biological spatial light modulator, and the analysis module was developed to provide objective classification and identification using Zernike polynomials.19 The first step towards the microbial HTS using the forward scatterometer was reported using commercial hardware and in-house software to provide results in the same fashion as a human operator does.20 However, there were several drawbacks and issues related to this prototype instrument before it could be classified as an HTS system. First, incubation of the petri dish was manually controlled and required constant attention from the human operator at certain times. To perform time-resolved forward-scatter measurements,18 the operator had to pick up the plate every 6 h and run the forward scatterometer measurements. In addition, the incubation time was approximately measured rather than tracked via a computer-controlled system. This type of work flow meant inaccuracy in time stamping, especially when dealing with fast-growing bacterial colonies such as Salmonella, Vibrio, and Escherichia coli in their late lag to early exponential growth phase. In addition, automated system is critical to minimize the effect of environmental factors on the scattering patterns as shown in previous research.21, 22 Second, acquisition of colony location was performed in a less accurate manner that required multiple correction steps for recording circularly symmetric forward-scatter patterns. Although this might be acceptable for a small number of colonies on a single plate, for HTS of massive numbers of microwell plates, it is critical to understand the origin of the inaccuracies in colony location. In addition, the degree of opaqueness in some species allowed only low transmission of light, which resulted in inaccurate centering by the previous algorithm. Third, in automating the whole sequence of incubation-interrogation-analysis, environmental factors such as temperature and moisture meant that a certain lag time was required to clear condensation from the plate before it could be interrogated. Therefore, we report the recent development of a microbial HTS system using elastic light scatter (ELS) that addressed these issues. Both hardware/software design and integration are explained in detail along with new algorithms for system calibration, which is critical to ensure data exchangeability among microbial forward scatterometer to be deployed in the future for security and surveillance purposes.
MATERIAL AND METHODS
Sample preparation
Trypicase soy agar (BD, catalog #211043) was used for sample preparation. 40 mg agar powder was suspended in 1 liter millipore water and boiled for 1 min. After the agar cooled, 35 ml agar was dispensed onto sterile petri dishes. Then Listeria innocua F4244 and E. coli Mach1-T1 were serially diluted and 50 μl bacterial solution was dispensed into the center of each petri dish. An L-shape spreader (RPI Corp. #247660) was used to spread the bacterial dilution on the agar.
Hardware design for HTS
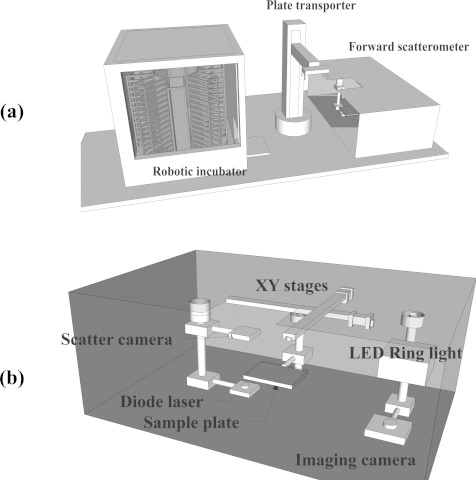
The hardware design for the HTS system required that both the sample preparation component and the analysis instrument be connected as a single unit. Therefore, the proposed HTS system consisted of three major parts: the forward scatterometer, a plate transporter, and an automatic incubator, as shown in Figure 1a.
Figure 1.
Schematic diagram of the presented microbial HTS system. (a) Overall components of the system (robotic incubator, plate transporter, and forward scatterometer). (b) Inside the forward scatterometer, showing two major components (ELS capture and colony locating).
Forward scatterometer
The forward scatterometer was designed and fabricated as the core of the microbial HTS system and consists of colony locating and ELS modules (Figure 1b). The first component is required to obtain information on the total number of colonies and the colony center locations, via capture of scattered light by a universal serial bus (USB) complementary metal oxide semiconductor (CMOS) camera (PL-B741U-BL, 1280 × 1024 pixels, PixeLINK, Ottawa, ON, Canada) from the back-illuminated image of the petri dish. Compared to the previous light source with oblique illumination,20 back illumination by light-emitting diodes (LED) provides stable and constant illumination without flickering. The USB camera is equipped with an imaging lens (M118FM08, Tamron, Saitama, Japan) with a viewing angle of 34° × 25.6° to cover the whole area of the plate within a given imaging distance. To compensate for the discrete LEDs located in ring position, a plate diffuser is included between the bottom of the plate and the light source. The second component is responsible for recording the ELS patterns, which are generated by passage of light from a diode laser (λ = 635 nm, Coherent 0221–698-01 REV B, CA, USA), which generated 1 mW circular beam with 1/e2 diameter of 1 mm and captured by a second USB CMOS camera. Two linear stages (XN10-0060-M02-71 with stroke 6 in. and resolution 2 mm, Velmex, Bloomfield, NY, USA) were used for 2D translation of the plate, via communication with the computer through a USB connection. We designed separate sample holders to accommodate two major plate types: 96-well plates and circular (88-mm diameter) petri dishes.
Plate transporter
A plate transporter is used to automatically translate the plate between the robotic incubator and the forward scatterometer. This transporter (Plate crane XT, Hudson Robotics, Inc., Springfield, NJ, USA) provides four degrees of motion freedom (vertical z, rotation θ, rotation φ, and radial r), with additional gripper function to hold the petri dish. It is connected to the computer via serial port communication and operated by in-house software that uses predefined commands to provide the required motions.
Incubator
A robotic incubator provides onsite incubation and accurate incubation time. The model (Cytomat 2C, Thermo Scientific, USA) has capacity of forty-two 96-well plates and can maintain desired temperature. This unit has its own robotic transporter that moves the designated plate back and forth from the incubation rail to the export windows at a designated time.
Algorithms and control software
Colony locating
Locating the colonies is the first step in forward scatterometer measurement, which includes both counting colonies and acquiring the 2D centroid locations of individual colonies. Colony counting is still considered an important step towards the microbial investigation while most of recent research focused on image processing algorithms of colony counting.23, 24, 25, 26, 27, 28 In the proposed system, in addition to colony counting, acquiring the accurate center location of respective colonies are also important since colony center and laser center have to be aligned for scatter pattern generation. If the information on colony location includes significant errors, there are two possible outcomes. (i) When the distance between the center of colony and that of the laser beam is greater than the radius of the colony, the incident laser does not generate a scattering pattern from that colony. (ii) If the distance between the center of the colony and that of the laser beam is smaller than the radius, the incident laser generates a skewed scattering that requires additional correction steps in order to capture a circularly symmetric pattern.
The captured 8-bit gray-scale image is first processed to locate the center coordinates of the colonies by segmentation and a region growing algorithm.20 A predefined threshold value is set and all pixels in the captured image are converted to a binary image based on the threshold. Then, a blobbing algorithm is applied with region growing to separate a colony from the background and count the number of colonies at the same time. This step also provides the degree of circularity of a colony via calculating the contour location and associated deviation from perfect circle;29 doublets or triplets must be filtered out since these “cluster of colonies” do not generate circularly symmetric patterns.
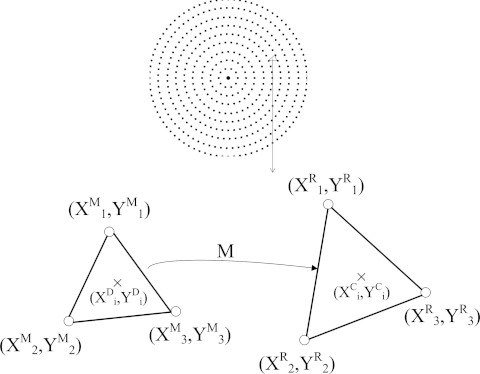
The next step is to correct the various camera distortions in the measured colony center locations; the major problems are complex radial distortion and axial distortion. Radial distortion occurs when magnification increases (barrel distortion) or decreases (pincushion distortion) with distance from the optical axis. If the imaging lens has been manufactured with high precision, it is possible to use a mathematical model to compensate for this type of distortion.30, 31, 32, 33 However, the actual distortion map did not fit well with either distortion model. Therefore, we designed a calibration plate with 386 circular dots positioned in both azimuthal and radial directions with the same number of dots per unit area. As shown in Figure 2, for a point (XDi,YDi) calculated from the distorted image we found three neighboring points from reference and distortion matrices and performed a linear transformation from the three vertices of the triangle as
| (1) |
| (2) |
where XMi, YMi are the measured coordinates, XRi, YRi are the reference coordinates, and A0-B2 are the coefficients for transformation. By inverting this 3 × 3 matrix
| (3) |
| (4) |
we can obtain the coefficients for the linear transformation and finally calculate the distortion-corrected centering location (XCi,YCi) using Eqs. 1, 2.
Figure 2.
Mapping of the measured location with the reference location using transformation matrix M to compensate for complex radial distortion. Three 2D points with superscript M are the measured location calculated from the camera image and those with superscript R are reference points from the calibration plate.
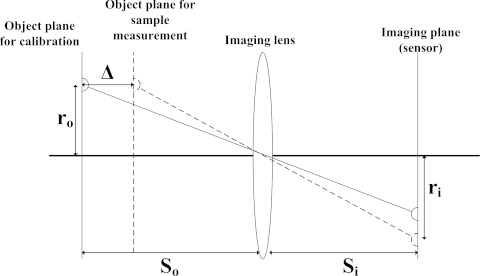
The second type of distortion originates from the difference between the calibration plate and the biological plates. Since the calibration plate was manufactured with dots printed on transparencies, their imaging distance is from the bottom of the plate to the camera, whereas for the real sample, bacterial colonies were grown on the surface of a semi-solid agar with a finite thickness (typically 3–5 mm). As shown in Figure 3, this difference (Δ) effectively modifies the magnification because the object plane of the real biological sample is closer to the camera than is the object plane of the calibration plate. Using geometrical optics, this can be expressed as
| (5) |
where ro and ri are the radial locations of the point object and image and So and Si are the object and image distance from the lens.
Figure 3.
Schematic diagram of the source of the axial distortion originating from the calibration plate and the real sample plate. r0 and ri are the radial locations of the object and imaging planes and Δ stands for the correction factor for the axial distortion.
The final step of the colony locating process is to solve a traveling salesman problem to find the shortest path length to travel between all the selected colonies. Detailed comparison between different algorithms and their effectiveness has been previously published.20
Colony centering process
Since the bacterial colony and the incident laser both have a circular cross section, once they are accurately aligned the resulting scattering patterns are circularly symmetric rings along with some non-symmetric texture patterns. The idea of using Zernike polynomials as a fundamental bioinformatics tool is also derived from this fact. Therefore, the system required an additional step to calculate and correct the “centeredness” of the scattering pattern. This centering process was accomplished by calculating the centroid for both X and Y directions,
| (6) |
where dx and dy are the pixel size and xi and yi are the location of the 8-bit intensity of the scatter pattern. This centroid location was computed and the difference between the frame centers was calculated to provide the degree of off-centeredness. The whole process was iteratively repeated until either the number of iteration reached a user-defined maximum or the difference was less than the desired tolerance.
In the design of the centering process, two different situations encountered during the measurement had to be considered. Most of the actual bacterial colonies are translucent and scatter a significant amount of laser light, enabling a centering with scattered light, but some colonies are opaque and allow only a small amount of light to be transmitted. To cope with both situations, geometric + and − centering algorithms were employed; the + algorithm found the centroid based on the bright signal, while the − algorithm found the centroid based on the dark signal.
Master control software
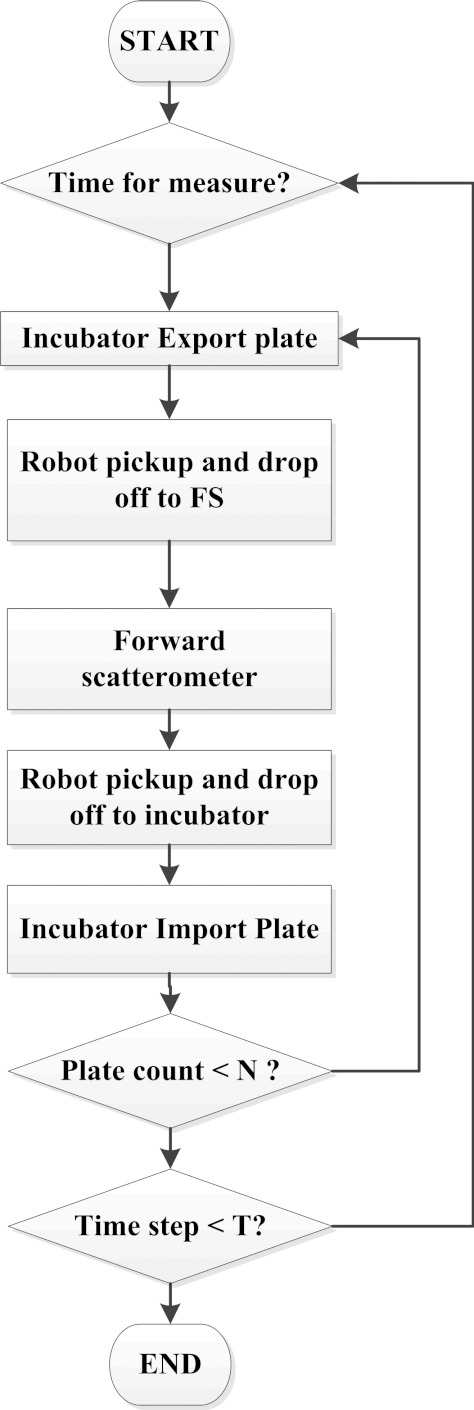
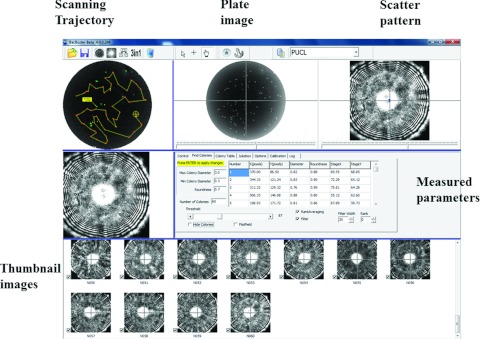
All the hardwares are controlled by master software for control and communications. As shown in Figure 4, the entire measurement process begins with the Cytomat scheduler software. After the correct number of 96-well plates is entered and tray numbers are recorded, the Cytomat scheduler tracks the time until a designated incubation time is reached for forward-scattering measurement. Then the scheduler exports the target plate from the incubator and orders the plate transporter to move the plate to the forward scatterometer. Next, the scatterometer is initiated for colony locating and scattering measurement. Figure 5 displays the user interface for the ELS measurement. This includes a preview window of the plate with sequential numbering and trajectory display, a plate image window, and a live forward-scatter window. Once the last colony scatter patterns are taken, the control software commands the plate transporter to pick up the plate and place it back in the robotic incubator. This whole process is repeated for the next plate.
Figure 4.
Flow chart showing the measurement process of the microbial HTS system.
Figure 5.
Screenshot of the graphical user interface of the microbial HTS system which includes panels showing scanning trajectory, plate image, scatter pattern, and thumbnail images.
Bioinformatics
The data analysis protocol used in this research has been described in our previous reports.19, 34, 35, 36, 37 Briefly, the scatter patterns are saved as bitmaps and subsequently analyzed utilizing image-processing approaches, including the use of pseudo-Zernike moments and Haralick texture features.36, 37
Since their introduction by Hu, moments have been employed in numerous applications ranging from optical character recognition and face recognition to image registration.38, 39 One important aspect of feature extraction is finding suitable features for a specific application. Owing to the circular nature of scatter patterns, we used features with radial properties (such as Zernike and pseudo-Zernike moment invariants). Additionally, as bacterial scatter patterns exhibit specific textures, we used Haralick texture features as another input to the classifier.
In (r, θ) polar coordinates, the pseudo-Zernike radial polynomials Rnm(r) are defined as
| (7) |
where n is a non-negative integer, and m is a non-zero integer subject to the following constraints: n−|m| is even and n ≥ |m|.
The (n, m) order of the Zernike basis function Vnm(r, θ) defined over the unit disk is
| (8) |
The pseudo-Zernike moments Zpq, of order n with repetition m are defined using polar coordinates (r, θ) inside the unit circle as
| (9) |
where V*nm is a complex conjugate of Vnm.
The pseudo-Zernike polynomials satisfy the following orthogonality property:
| (10) |
where δxy denotes the Kronecker symbol.
To compute the Zernike or pseudo-Zernike moments of a given image, the center of the image is taken as the origin and pixel coordinates are mapped to the range of the unit circle. Under rotation, the orientation angles of the moments change but their magnitudes remain unchanged. Therefore, the magnitudes |Znm| of pseudo-Zernike moments can be used as rotation-invariant features.
A simple yet powerful tool for quantifying intensity variation in patterns (i.e., texture) is a gray-level co-occurrence matrix (GLCM). The so-called Haralick texture features derived from GLCMs are employed to extract 14 low- and high-frequency (depending on the distance from each other of pixels used in the co-occurrence matrix) texture-like properties.36, 37 We used the mean and the range of 12 of these 14 features, which constitutes 24 features per image.
Formally, let scatter pattern be represented as an image f that has Nx pixels in the horizontal direction and Ny pixels in the vertical direction. Suppose also that there are Ng distinct intensity levels in the quantized image. Let Lx = 1, 2, …, Nx be the horizontal spatial domain, Ly = 1, 2, …, Ny the vertical spatial domain, and G = 1, 2, …, Ng the set of Ng distinct intensity levels. The texture-context information in image f is contained in the overall or “average” spatial relationship that the intensity levels have with one another. More specifically, this texture-context information is adequately specified by the matrix of relative frequencies Pij with which two neighboring pixels, one with gray level i and the other with gray level j, separated by a distance d occur on the image. Such matrices of gray-tone spatial-dependence frequencies are a function of the distance between them. Excluding the borders, a pixel has eight nearest-neighbor pixels (north, south, east, west, northwest, northeast, southwest, and southeast).
After the number of pixel pairs R used in computing a particular spatial-dependence matrix is obtained, the matrix can be normalized by dividing each entry in the matrix by R. If the intensity levels are in the range [0, 255] and all are utilized in the image, then the P matrix will be a 256-by-256 matrix. Using the co-occurrence matrix, we can compute a number of features, such as angular second moment, contrast, sum average, sum variance, inverse difference moment, sum of squares (variance), entropy (a measure of randomness), sum entropy, difference entropy, difference variance, information measure of correlation, and maximal correlation coefficient.
The classification of the scatter patterns based on the extracted features is performed using a support vector machine (SVM) algorithm.40 Specifically, our processing and classification software employs the LIBSVM library.41 However, before the data are used for training the classifier, a feature-selection procedure is performed. It has to be noted that although we extract a large feature vector composed of pseudo-Zernike and Haralick-based features, some of these features add little value for the classification process. Therefore, it is necessary to select the most appropriate feature set.42 Following the suggestions in the literature, we paired the SVM classification with Fisher's criterion and random forest feature selection approaches.43
EXPERIMENTAL RESULTS
Instrument calibration
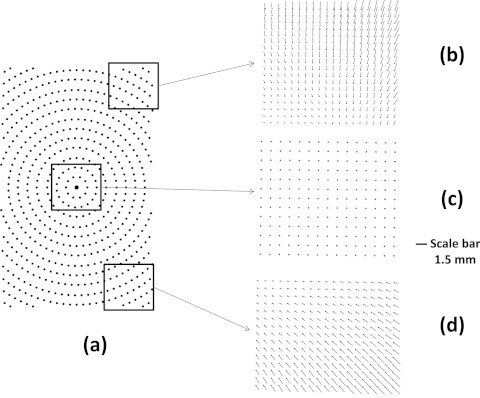
The calibration process moves the calibration plate though the series of dots and computes the respective center coordinates. This process results in a matrix of the center locations for the 386 dots used as reference points. Then we take the camera image with the complex distortion and find the distorted center locations. These two matrices are used as a mapping function to convert arbitrary center locations calculated from the real plate measurement. As shown in Figure 6, the distortion map shows a combination of both distortions, making it difficult to find an explicit equation to model. In the center of the imaging plane (Figure 6c) the amount of distortion is minimal; the difference is 0–2 pixels, equivalent to 0–98 μm in physical distance. However, at the corners (Figures 6b, 6d) the physical discrepancy between distorted and true location can be as much as 49 pixels, equivalent to 2.33 mm.
Figure 6.
Calibration results using a 96-well reference plate. (a) The location of the reference circles (b)–(d) shows the difference between measured and reference center location, represented as the length of the arrow. (c) The difference in the center region. (b) and (d) Results for upper and lower corners.
Scattering from single species
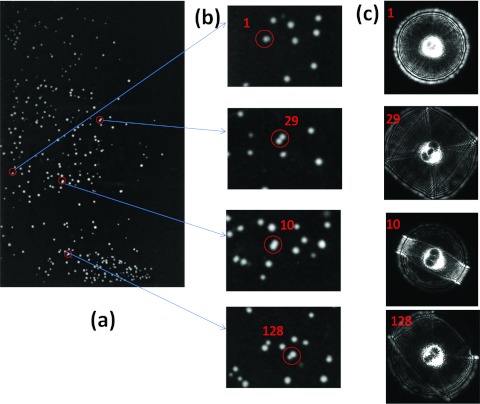
To construct a library of individual species, forward-scatter images from plates of pure cultures were captured. Since the bioinformatics tool were designed for parameter extraction from circularly symmetric features, it is critical to differentiate and exclude the non-single colonies, i.e., those that touch or overlap, because these generate patterns that are not circularly symmetric. The plate image (Figure 7a) shows the intensity map for the distribution of the colonies. Figure 7b shows the column of zoomed images of single colonies (labeled 1) and various doublets (labeled 29, 10, 128). Depending on the inter-colony distance and the diameters of the individual colonies, skewed forward-scatter patterns (Figure 7c) are captured when colonies touch (29), unite into one (10), or have different diameters (128). These colonies are excluded using the “degree of circularity” parameter, which measures the aspect ratio of the colony image.
Figure 7.
Example of ELS images along with the plate image. (a) L. innocua F4244 image from a 96-well plate. (b) The series of zoomed colony images. (c) Corresponding scattering patterns.
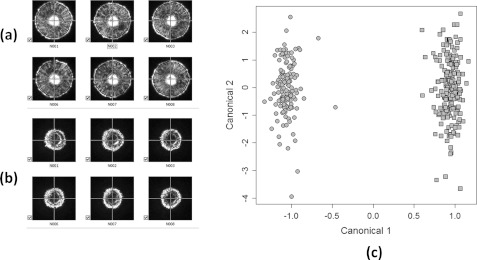
Following the sample preparation outlined in Sec. 2, L. innocua F4244 and E. coli Mach1-T1 plates were used for single-species scatter measurement. This process is crucial for construction of a library of individual scatter patterns; once an unknown bacterial colony is scanned, it will be compared with a database of previously recorded images. Both species were grown for 18 h while 18 and 95 colony images were captured, respectively. However, to provide quantitative analysis and identification, we used bioinformatics software to construct their own class, as shown in Figure 8c. Then a new set of E. coli plates was used to capture new scattering patterns that were automatically run through the classification software. The principal component analysis shows that these two organisms can easily be differentiated using 10 orders of Zernike moments with support vector machine
Figure 8.
Respective scatter patterns from different genera: (a) L. innocua F4244. (b) E. coli Mach1-T1. (c) Classification results using the proposed bioinformatics tool where circle denotes E. coli Mach1-T1 and square represents L. innocua F4244.
Time-resolved experiments
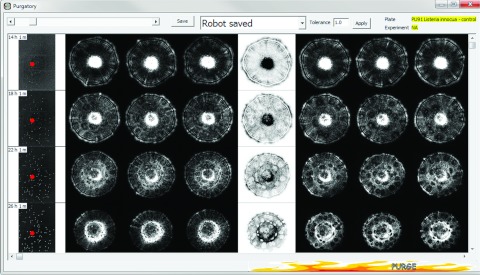
Another crucial test of the HTS instrument was to conduct a dynamic scatter-pattern measurement versus time. Since the growth speed of an organism differs among species, both quantitative and punctual measurements are key elements for successful time-resolved pattern analysis. In-house image-screening software was built for easy visualization of time-dependent scatter-pattern variations. This software imports selected scatter patterns from the database and presents them in a tabular format. The horizontal axis shows the sequence of respective scatter patterns, while the vertical axis shows the time-dependent ELS variations of the same colony. The first column of the screening software displays the corresponding petri dish image (in this case a 96-well format). As shown in Figure 9, this enables the user to easily track time-dependent variations of the scatter patterns for specified colonies. The red dot in a plate image locates the specific colony of interest that matches the scatter patterns of a highlighted column. This feature enables the researchers to perform any further biochemical investigation on the exact colony that showed interesting features.
Figure 9.
Screenshots of colony-tracking program. The column on the left displays thumbnails of plate images with different incubation times along with a red dot indicating the selected colony. The column on the right displays a series of ELS images with corresponding incubation times.
Figure 9 shows results from L. innocua F4244. The incubation time was 14 h, 18 h, 22 h, and 26 h for each row of images and 18, 48, 52, and 54 colony images were captured, respectively. In the early growth stage, a central bright spot was observed, which originated from the undisturbed incoming laser beam, and the dominant scattering features were concentric rings. As the bacterial colonies grew, the intensity of the central bright spot diminished and the scatter patterns began to show some dark spots on top of the diffraction rings. Twenty-two L. innocua F4244 and 24 E. coli Mach1-T1 plates were scanned, resulting in 4421 ELS patterns. The average scan time per colony (Tmean) was calculated as
| (11) |
where N is the total number of colonies, k is the total number of plates, Tinc, TELS, Trobot, are the time required for the incubator to move the plate to the robot, the time required for ELS measurement (both colony locating and centering), and the time required for the robot to move the plates back and forth between two systems, respectively. The calculated Tmean for this set of experiments is ∼4.9 s per colony.
DISCUSSION
In HTS of microbial colonies, accurate locating is a critical step towards providing faster measurement, since each correction step in the centering algorithm and non-optimized trajectories multiplied by the number of colonies and the number of plates results in a longer measurement time.
Previous versions of centering algorithm with 4-quadrant centering showed both linear and non-linear relationships between the signal output and the distance.20 A linear relationship was found when the difference between calculated and real colony center were less than the radius of the actual value while, in opposite case, the system required large number of correction steps to move to the linear region. However, the proposed system provides an accurate calibration step that brings the center coordinates close to the true value, thereby dramatically decreasing the correction steps required. In addition, the variability in mechanical and optical components arising in the manufacture of multiple units is compensated. Since the ultimate goal is to deploy the forward scatterometer as a remote sensing device, ensuring the minimal variability that could cause scatter-pattern variation is a necessary first step.
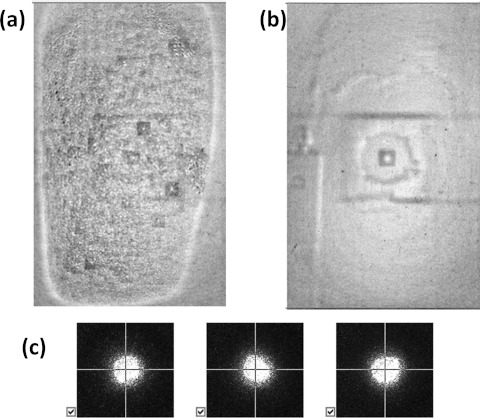
Another critical issue for HTS with microbial samples is condensation. When applying this technology to pathogenic strains, the dish or plate cover must be kept closed for safety and for prevention of cross-contamination. Since the incubator temperature (37 °C) is rather higher than the ambient, water droplets begin to condense on the cover after approximately 5–7 min at room temperature. Figures 10a, 10b show the condensation and the clear plate image from the camera output. As shown in Figure 10c, condensation causes severe problems in the integrity of ELS patterns. There are two possible solutions to this problem. The first is to use a plastic block as a thermal source to radiate heat and maintain temperature during the ELS measurement. However, this method is impractical owing to the effect it has on the scatter patterns. The second is to ensure that the measurement time for a single plate is less than 5–7 min, so that all ELS measurements are completed before the appearance of condensation. Except for those plates with very high numbers of colonies, most plates can be successfully processed within this time limit. Compared to the previously reported system, the proposed microbial HTS instrument provides both accurate time stamping for sample handling and faster acquisition of ELS patterns through calibration and a better image-processing algorithm. Since the incubator and forward scatterometer are coherently connected and operate via control software, the new HTS instrument is able to provide an amount of data that had been impossible to acquire with the previous generation system. In addition, the non-linear nature of the centering process employed by the previous system was tackled, and a fundamental understanding of the error sources has resulted in a more accurate and faster centering process, which in turn dramatically reduces the acquisition time.
Figure 10.
Effect of moisture on the plate. (a) Representative plate image with moisture effect. (b) Representative plate image without moisture effect. (c) ELS image from a colony with moisture effect.
CONCLUSIONS
An HTS system has been developed that enables rapid measurement of combinatorial studies using bacterial colonies. Hardware integration was implemented by connecting an incubator, a plate transporter, and a forward scatterometer for ELS detection. A new calibration plate and new compensation algorithm were designed to minimize further correction steps in establishing colony location. The former ensures that each forward scatterometer can be calibrated on its own mechanical and optical setup; the latter was realized by considering the complex radial and axial distortion originating from the design of the colony-locating camera. The performance of the system was shown with single-species detection using E. coli and L. innocua (for library generation) and with time-resolved measurements. This microbial HTS system provides an average scan time of 4.9 s per colony, with the capability of collecting more than 4000 ELS patterns in 7 h.
ACKNOWLEDGMENTS
This research was supported through National Institute of Health Grant No. 1R56AI089511-10.
References
- Polym Lab I., Lc Gc North America, 29-29, 2002.
- Englebienne P., Van Hoonacker A., and Verhas M., Analyst 126(10), 1645–1651 (2001). 10.1039/b105252g [DOI] [Google Scholar]
- Potyrailo R. A. and May R. J., Rev. Sci. Instrum. 73(3), 1277–1283 (2002). 10.1063/1.1448905 [DOI] [Google Scholar]
- Jager S., Garbow N., Kirsch A., Preckel H., Gandenberger F. U., Herrenknecht K., Rudiger M., Hutchinson J. P., Bingham R. P., Ramon F., Bardera A., and Martin J., J. Biomol. Screening 8(6), 648–659 (2003). 10.1177/1087057103258475 [DOI] [PubMed] [Google Scholar]
- Gefen O. and Balaban N. Q., Trends Biotechnol. 26(7), 345–347 (2008). 10.1016/j.tibtech.2008.03.007 [DOI] [PubMed] [Google Scholar]
- Balaban N. Q., Merrin J., Chait R., Kowalik L., and Leibler S., Science 305(5690), 1622–1625 (2004). 10.1126/science.1099390 [DOI] [PubMed] [Google Scholar]
- Weibel D. B., DiLuzio W. R., and Whitesides G. M., Nat. Rev. Microbiol. 5(3), 209–218 (2007). 10.1038/nrmicro1616 [DOI] [PubMed] [Google Scholar]
- Ingham C. J., Sprenkels A., Bomer J., Molenaar D., van den Berg A., Vlieg J., and de Vos W. M., Proc. Natl. Acad. Sci. U.S.A. 104, 18217–18222 (2007). 10.1073/pnas.0701693104 [DOI] [PMC free article] [PubMed] [Google Scholar]
- Belanger P.-A. B., Roy J., and Sebastien, J. Microbiol. Methods 85, 92–97 (2011). 10.1016/j.mimet.2011.01.028 [DOI] [PubMed] [Google Scholar]
- Qi X., Zhang Y., Tu R., Lin Y., Li X., and Wang Q., J. Appl. Microbiol. 110(6), 1584–91 (2011). 10.1111/j.1365-2672.2011.05014.x [DOI] [PubMed] [Google Scholar]
- van Veen S. Q., Claas E. C. J., and Kuijper E. J., J. Clin. Microbiol. 48(3), 900–907 (2010). 10.1128/JCM.02071-09 [DOI] [PMC free article] [PubMed] [Google Scholar]
- Gut J., Ang K. K. H., Legac J., Arkin M. R., Rosenthal P. J., and McKerrow J. H., J. Microbiol. Methods 84(3), 398–405 (2011). 10.1016/j.mimet.2010.12.026 [DOI] [PubMed] [Google Scholar]
- Brehm-Stecher B., Young C., Jaykus L.-A., and Tortorello M. L., J. Food Prot. 72(8), 1774–1789 (2009). [DOI] [PubMed] [Google Scholar]
- Fukushima H., Kawase J., Etoh Y., Sugama K., Yashiro S., Iida N., and Yamaguchi K., Int. J. Microbiol. 2010 (2010). [DOI] [PMC free article] [PubMed] [Google Scholar]
- Swaminathan B. and Feng P., Annu. Rev. Microbiol. 48, 401–426 (1994). 10.1146/annurev.mi.48.100194.002153 [DOI] [PubMed] [Google Scholar]
- Jaradat Z. W., Schutze G. E., and Bhunia A. K., Int. J. Food Microbiol. 76(1-2), 1–10 (2002). 10.1016/S0168-1605(02)00050-8 [DOI] [PubMed] [Google Scholar]
- Bae E., Banada P. P., Huff K., Bhunia A. K., Robinson J. P., and Hirleman E. D., Appl. Opt. 46(17), 3639–3648 (2007). 10.1364/AO.46.003639 [DOI] [PubMed] [Google Scholar]
- Bae E., Banada P. P., Huff K., Bhunia A. K., Robinson J. P., and Hirleman E. D., J. Biomed. Opt. 13(1), 014010 (2008). 10.1117/1.2830655 [DOI] [PubMed] [Google Scholar]
- Bayraktar B., Banada P. P., Hirleman E. D., Bhunia A. K., Robinson J. P., and Rajwa B., J. Biomed. Opt. 11(3), 034006 (2006). 10.1117/1.2203987 [DOI] [PubMed] [Google Scholar]
- Bae E. W., Aroonnual A., Bhunia A. K., Robinson J. P., and Hirleman E. D., Meas. Sci. Technol. 20(1), 015802 (2009). 10.1088/0957-0233/20/1/015802 [DOI] [Google Scholar]
- Buzalewicz I., Wieliczko A., and Podbielska H., Opt. Express 19(22), 21768–21785 (2011). 10.1364/OE.19.021768 [DOI] [PubMed] [Google Scholar]
- Bae E., Aroonnual A., Bhunia A. K., and Hirleman E. D., J. Biophotonics 4(4), 236–243 (2011). 10.1002/jbio.201000051 [DOI] [PubMed] [Google Scholar]
- Marotz J., Lubbert C., and Eisenbeiss W., Comput. Methods Programs Biomed. 66(2-3), 183–198 (2001). 10.1016/S0169-2607(00)00128-0 [DOI] [PubMed] [Google Scholar]
- Dahle J., Kakar M., Steen H. B., and Kaalhus O., Cytometry A 60A(2), 182–188 (2004). 10.1002/cyto.a.20038 [DOI] [PubMed] [Google Scholar]
- Putman M., Burton R., and Nahm M. H., J. Immunol. Methods 302(1-2), 99–102 (2005). 10.1016/j.jim.2005.05.003 [DOI] [PubMed] [Google Scholar]
- Buzalewicz I., Wysocka-Krol K., and Podbielska H., Opt. Express 18(12), 12992–13005 (2010). 10.1364/OE.18.012992 [DOI] [PubMed] [Google Scholar]
- Clarke M. L., Burton R. L., Hill A. N., Litorja M., Nahm M. H., and Hwang J., Cytometry A 77A(8), 790–797 (2010). 10.1002/cyto.a.20864 [DOI] [PMC free article] [PubMed] [Google Scholar]
- Wang W., Opt. Eng. 50(12), 123001 (2011). 10.1117/1.3662398 [DOI] [Google Scholar]
- Chang F., Chen C.-J., and Lu C.-J., Comput. Vis. Image Underst. 93(2), 206–220 (2004). 10.1016/j.cviu.2003.09.002 [DOI] [Google Scholar]
- Wang J., Shi F., Zhang J., and Liu Y., Pattern Recogn. 41, 607–615 (2008). 10.1016/j.patcog.2007.06.012 [DOI] [Google Scholar]
- Hartley R. and Kang S. B., IEEE Trans. Pattern Anal. Mach. Intell. 29(8), 1309–1321 (2007). 10.1109/TPAMI.2007.1147 [DOI] [PubMed] [Google Scholar]
- Helferty J. P., Zhang C., McLennan G., and Higgins W. E., IEEE Trans. Med. Imaging 20(7), 605–617 (2001). 10.1109/42.932745 [DOI] [PubMed] [Google Scholar]
- Asari K. V., Kumar S., and Radhakrishnan D., IEEE Trans Med. Imaging 18(4), 345–354 (1999). 10.1109/42.768843 [DOI] [PubMed] [Google Scholar]
- Banada P. P., Huff K., Bae E., Rajwa B., Aroonnual A., Bayraktar B., Adil A., Robinson J. P., Hirleman E. D., and Bhunia A. K., Biosens. Bioelectron. 24(6), 1685–1692 (2009). 10.1016/j.bios.2008.08.053 [DOI] [PubMed] [Google Scholar]
- Rajwa B., Dundar M. M., Akova F., Bettasso A., Patsekin V., Hirleman E. D., Bhunia A. K., and Robinson J. P., Cytometry A 77A(12), 1103–1112 (2010). 10.1002/cyto.a.20978 [DOI] [PMC free article] [PubMed] [Google Scholar]
- Haralick R. M., Proc. IEEE 67(5), 786–804 (1979). 10.1109/PROC.1979.11328 [DOI] [Google Scholar]
- Haralick R. M., Shanmuga K., and Dinstein I., IEEE Trans. Syst. Man Cybern. SMC3(6), 610–621 (1973). 10.1109/TSMC.1973.4309314 [DOI] [Google Scholar]
- Flusser J. and Suk T., Pattern Recogn. 26(1), 167–174 (1993). 10.1016/0031-3203(93)90098-H [DOI] [Google Scholar]
- Hu M., IRE Trans. Inform. Theory 8(2), 179–187 (1962). 10.1109/TIT.1962.1057692 [DOI] [Google Scholar]
- Cortes C. and Vapnik V., Mach. Learn. 20(3), 273–297 (1995). 10.1023/A:1022627411411 [DOI] [Google Scholar]
- Chang C. C. and Lin C. J., ACM Trans. Intel. Syst. Tech. 2(27), 1–27 (2011). 10.1145/2043621.2043626 [DOI] [Google Scholar]
- Guyon I. and Elisseeff A., J. Mach. Learn. Res. 2, 1157–1182 (2003). [Google Scholar]
- Chen Y. W. and Lin C. J., in Feature Extraction, edited by Guyon I., Nikravesh M., Gunn S., and Zadeh L. A. (Springer, Berlin, 2006), pp. 315–324. [Google Scholar]


