The relationship between primary open-angle glaucoma (POAG) and cerebrospinal fluid pressure (CSFP) is explored. Increasing body mass index (BMI), which is protective against POAG, is associated with an increase in CSFP. This association may explain how an elevated BMI decreases the risk for POAG.
Abstract
Purpose.
To examine the relationship between body mass index (BMI) and cerebrospinal fluid pressure (CSFP), as low BMI and low CSFP have recently been described as risk factors for primary open-angle glaucoma (POAG).
Methods.
This was a retrospective review of the electronic medical records of patients who had CSFP measured by lumbar puncture and data to calculate BMI at the Mayo Clinic (Rochester, MN). Exclusion criteria included diagnoses, surgical procedures and medications known to affect CSFP. Mean CSFP for each unit BMI was calculated. The probabilities were two-tailed, and the α level was set at P < 0.05. Patients with documented BMI, CSFP, and intraocular pressure (IOP) were analyzed for the relationship between IOP and BMI.
Results.
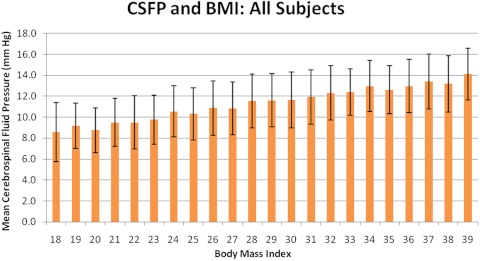
A total of 4235 patients, primarily of Caucasian descent, met the entry criteria. Median BMI was 26 and the mean CSFP was 10.9 ± 2.6 mm Hg. The increase in CSFP with increasing BMI was linear with an r2 = 0.20 (P < 0.001). CSFP increased by 37.7% from BMI 18 (8.6 ± 2.1 mm Hg) to BMI 39 (14.1 ± 2.5 mm Hg). The r2 (0.21) of the model of BMI and sex was similar to the r2 of a BMI-only model (0.20). There was no relation between IOP and BMI within a subgroup of the study population (r 2 = 0.005; P = 0.14).
Conclusions.
CSFP has a positive, linear relationship with BMI. IOP is not influenced by BMI. If CSFP influences the risk for POAG, then individuals with a lower BMI may have an increased risk for developing POAG. Similarly, a higher BMI may be protective.
Well-recognized risk factors for primary open-angle glaucoma (POAG) include age, race, positive family history, and elevated intraocular pressure. More recently, cerebrospinal fluid pressure (CSFP) has been suggested as a risk factor for POAG. Studies have shown that individuals with POAG or normal-tension glaucoma (NTG) have lower CSFP when compared with the normal population.1–4 It is postulated that increasing translaminar pressure, the difference between intraocular pressure (IOP) and the CSFP, damages the optic nerve and contributes to glaucomatous optic neuropathy. It has also been postulated that higher CSFP, which reduces the translaminar pressure, may reduce the risk for glaucoma.
Body mass index (BMI) has been reported to be a risk factor for POAG.5–11 However, the nature of this relationship is unclear. Newman-Casey et al.5 found that obesity in females of a mostly Caucasian population (86.7% Caucasian, 4.3% Black, 5.6% Latinos, and 2.5% Asian Americans) was associated with a greater risk of developing POAG5 while the Tajimi Eye Study (Japan) found no association between glaucoma and BMI.6,7 On the other hand, Asrani et al.8 reported that lower BMI was associated with increased risk for NTG. This study was preceded by the Barbados Eye Study, in which Leske et al.9 found that decreased BMI was associated with greater risk for glaucoma in the Barbados population of African ancestry. Recently, in two separate studies, Pasquale10 and Ramdas11 found that increased BMI in females reduces risk of developing glaucoma. In addition, Ren et al.12 found a statistically significant correlation between elevated CSFP levels and higher BMI in a small cohort (n = 39). They conclude that low BMI may be a potential risk factor for NTG. Overall, these latter studies suggest that increased BMI is protective for glaucoma, whereas decreased BMI may be associated with greater risk.
The purpose of this study was to investigate the relationship between BMI and CSFP, while also determining if a relationship exists between IOP and BMI.
Methods
Institutional Review Board approval was obtained from the Mayo Clinic (Rochester, MN). The study adhered to the tenets of Declaration of Helsinki and was in compliance with the Health Insurance Portability and Accountability Act (HIPAA). A search of the electronic medical records database at Mayo Clinic identified all patients who underwent a diagnostic lumbar puncture (LP; CPT code: 62,270) between December 1, 1996, and December 31, 2009. A present diagnosis and medical history of each patient who underwent LP was retrieved.
A standard LP technique was used in all patients. Each patient was placed in the lateral decubitus position and either the L3 to L4 or L4 to L5 interspace was identified and anesthetized. A 3.5-in., 20-gauge spinal needle with a three-way stopcock was inserted into the subarachnoid space. A 550-mm manometer was attached to the stopcock, and the column of CSF fluid was allowed to equilibrate. The patient was asked to remain still and not to speak. The meniscus of the CSF fluid was read and reported in millimeters of water. This value was converted to millimeters of mercury to allow comparison with IOP and data analysis (1 mm Hg ≈ 13.6 mm H2O).
All electronic information was de-identified according to routine procedure at the Mayo Clinic. Information from specific patients was given a unique, randomly generated identifier and entered into a database. Patients with medical conditions or those taking medications known to alter CSFP were excluded, as were those who had sustained head trauma. The files were manually reviewed and underwent screening against conditions that are known to or theoretically could cause alterations in CSFP. Subjects were excluded from analysis if a diagnosis of a disorder or condition that could affect CSFP was documented in the electronic medical record. Patients had undergone a neurosurgical procedure or had more than one LP were excluded. Analysis was confined to patients with CSFP measurements within a range of 4.4 to 18.4 mm Hg (60–250 mm H2O) since data outside that range was likely to be unreliable or the result of a pathophysiologic process affecting the CSFP.13 Data from all patients meeting the inclusion criteria with recorded height and weight at the time of LP were used for the analysis. BMI for each patient was calculated manually [BMI = (weight in kilograms)/(height in meters)2] and rounded to the nearest whole number. BMIs less than 10 and greater than 50 were excluded, as these values were felt to be the result of data entry errors.
The definition of “overweight” by the BMI criterion varies until adulthood. For this reason, we limited the analysis to include only adults. In this manner, we were able to use a BMI value >30 as our definition of obesity. We used the WHO criterion of 20 years as the age of adulthood.14
Subjects who met the inclusion criteria were grouped by BMI. Mean CSFP and SD were calculated for each BMI group. A Student's t-test comparison of each mean CSFP to pressure at BMI 18 was performed. The BMI data were grouped into integer values between 18 and 39, and mean pressures and reference intervals were calculated per unit of BMI. Because of the small number of individuals with BMI at extreme values, those with BMIs less than 18 and greater than 39 were combined into single groups. The percentage difference was also calculated between the mean CSFP of each BMI group and the mean CSFP of those with BMI of 18, as well as the population median BMI of 26. The set of patients who met initial screening was also run against a filter that identified those who had had an ophthalmic examination within 1 year of LP. Those with BMI and IOP data were included. If a repeat ophthalmic examinations was performed, only the IOP measurement closest to the LP data was used. IOPs of the right eye, left eye, and the average of both eyes were regressed against BMI. A separate subgroup analysis included patients with recorded height and CSFP. Patients with height under 121.9 cm (48 in.) were excluded from the analysis.
Using the least-squares method, we regressed CSFP against BMI for all subjects and separately by sex. In addition, BMI and sex were both included in a model with an interaction term to determine whether the slopes of the men were significantly different from those of the women. BMI and sex were also used as predictors in a model without an interaction term. The P values were two-tailed with significance set at P < 0.05.
Results
Between December 1, 1996, and December 31, 2009, 4800 subjects were identified, with height and weight measurements taken on the day an LP was performed and CSFP was recorded. Of the 4800 subjects, 4235 met all entry criteria. The majority of the subjects were Caucasian (79.1%) with slightly more women than men (52.2% vs. 47.8%; Table 1). The mean age of the study population was 55.0 ± 15.2 years. The mean CSFP was 10.9 ± 2.8 mm Hg (median, 10.7 mm Hg), with the women having a slightly lower pressure (mean, 10.5 ± 2.8 mm Hg; median, 10.3 mm Hg) and the men slightly higher (mean, 11.3 ± 2.8 mm Hg; median, 11.2 mm Hg). The study populations mean BMI was 26.7 ± 5.3 (median, 26), with the women slightly lower (mean, 26.0 ± 5.8; median, 25) and the men slightly higher (mean, 27.4 ± 4.6; median, 27).
Table 1.
Population Demographics
| Age, y | |
| Mean ± SD | 55.01 ± 15.2 |
| Median | 55 |
| Sex, n (%) | |
| Males | 2026 (47.84) |
| Females | 2209 (52.16) |
| Total | 4235 |
| Race, n (%) | |
| Caucasian | 3348 (79.06) |
| Unknown | 714 (16.86) |
| Black | 70 (1.65) |
| Other | 43 (1.02) |
| Asian | 23 (0.54) |
| Native American/Eskimo | 18 (0.43) |
| Not Disclosed | 16 (0.38) |
| Native Hawaiian/Pacific Islander | 3 (0.07) |
| Total | 4235 |
| Ethnicity, n (%) | |
| Unknown | 3178 (75.04) |
| Non-Hispanic | 1018 (24.04) |
| Hispanic | 29 (0.68) |
| Not disclosed | 10 (0.24) |
| Total | 4235 |
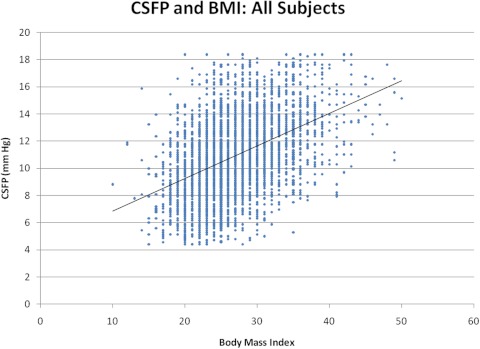
The group with BMI of 10 to 17 had a mean CSFP of 9.4 ± 3.3 mm Hg (n = 88), and the group with BMI of 40 to 50 had an average CSFP of 13.8 ± 2.6 mm Hg (n = 74). Relative to a BMI of 18, there was a sustained increase in CSFP through BMI of 39 (37.7%; P < 0.001; Table 2; Fig. 1). Univariate least-squares regression analysis revealed a 0.24-mm Hg increase in CSFP for every BMI unit (r2 = 0.20; P < 0.001; Fig. 2).
Table 2:
Relationship between BMI and CSFP for the Study Population
| BMI | CSFP (mm Hg) | SD | % Increase | P | n |
|---|---|---|---|---|---|
| 18 | 8.79 | 2.30 | * | * | 94 |
| 19 | 9.42 | 2.47 | 6.7 | 0.046 | 142 |
| 20 | 8.91 | 2.56 | 1.3 | 0.688 | 198 |
| 21 | 9.59 | 2.41 | 8.3 | 0.006 | 216 |
| 22 | 9.68 | 2.59 | 9.2 | 0.002 | 269 |
| 23 | 9.94 | 2.62 | 11.5 | <0.001 | 324 |
| 24 | 10.56 | 2.58 | 16.8 | <0.001 | 358 |
| 25 | 10.34 | 2.50 | 15.0 | <0.001 | 368 |
| 26 | 10.94 | 2.58 | 19.6 | <0.001 | 331 |
| 27 | 10.94 | 2.59 | 19.7 | <0.001 | 313 |
| 28 | 11.58 | 2.68 | 24.1 | <0.001 | 310 |
| 29 | 11.66 | 2.59 | 24.6 | <0.001 | 264 |
| 30 | 11.72 | 2.62 | 25.0 | <0.001 | 240 |
| 31 | 11.93 | 2.23 | 26.3 | <0.001 | 190 |
| 32 | 12.35 | 2.44 | 28.8 | <0.001 | 157 |
| 33 | 12.43 | 2.30 | 29.3 | <0.001 | 113 |
| 34 | 12.95 | 2.50 | 32.1 | <0.001 | 92 |
| 35 | 12.66 | 2.65 | 30.6 | <0.001 | 97 |
| 36 | 12.96 | 2.70 | 32.2 | <0.001 | 77 |
| 37 | 13.42 | 2.44 | 34.5 | <0.001 | 47 |
| 38 | 13.19 | 2.34 | 33.3 | <0.001 | 41 |
| 39 | 14.10 | 2.48 | 37.7 | <0.001 | 27 |
Reference point at BMI 18. Italics indicate statistical significance based on the null hypothesis of the indicated CSFP not differing from the CSFP for BMI 18.
Figure 1.
Graph of mean CSFP and BMI of all subjects in the study population between BMI of 18 and 39. Error bars, SD.
Figure 2.
Regression plot of all CSFP versus BMI data. The formula for the regression line is y = 0.2401x + 4.4503 (r2 = 0.20; P < 0.001).
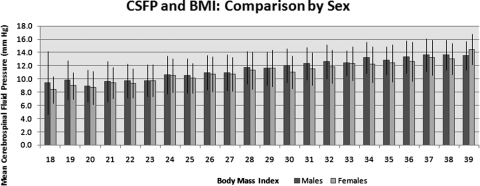
Similar trends were observed between BMI and CSFP when the analysis was performed according to sex. Relative to BMI 18, there was a 28.3% increase in mean CSFP (3.82 mm Hg, P < 0.002) for the men at BMI 39. For each unit value increase in BMI, the mean CSFP measurement increased 0.25 mm Hg. The correlation coefficient between BMI and CSFP was moderate and the slope was significant by least-squares regression analysis (r2 = 0.17; P < 0.001). Similarly, in the female subjects, there was a 41.0% increase in mean CSFP at BMI 39 (5.9 mm Hg; P < 0.001) relative to the pressure at BMI 18. Slope of least-squares regression line revealed a 0.22-mm Hg increase in mean CSFP per BMI unit (r2 = 0.21; P < 0.001; Fig. 3).
Figure 3.
Chart of CSFP and BMI comparing the variables by sex. Error bars, SD.
The mean CSFP was 5.0% higher in the men than in the women for the BMI range of 18 to 25 (P < 0.001). Mean CSFP was 3.3% higher in the men than in the women in the BMI 27 to 39 group (P < 0.001; Table 3). However, the results of the tests of interaction of BMI and sex showed that the difference in the slopes for the men and women was of borderline significance (P = 0.065). Similarly, when the model contained both BMI and sex without the interaction term, both were significant, but the r2 (0.21) was no different from the r2 of BMI alone (0.20). Including sex did not improve the fit of the BMI data. Therefore, in this study, the sex of the individual had little effect in the model of CSFP and BMI.
Table 3.
Mean CSFP of All Patients Greater and Less Than the Median BMI
| Total Sample CSFP (mm Hg) | Men Only CSFP (mm Hg) | Women Only CSFP (mm Hg) | Percentage Difference (Men − Women) | |
|---|---|---|---|---|
| BMI 18–25 | 9.8 ± 2.5 | 10.1 ± 2.7 | 9.6 ± 2.4 | 5.0, P < 0.0001 |
| BMI 27–39 | 11.9 ± 2.6 | 12.1 ± 2.5 | 11.7 ± 2.7 | 3.3, P < 0.0001 |
The percentage difference between the male and female groups is included in the last column. Significance is based on the null hypothesis that the mean male CSFP will not differ from the mean female CSFP.
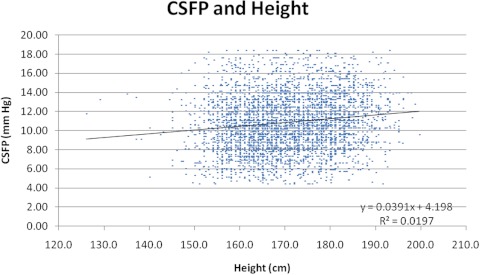
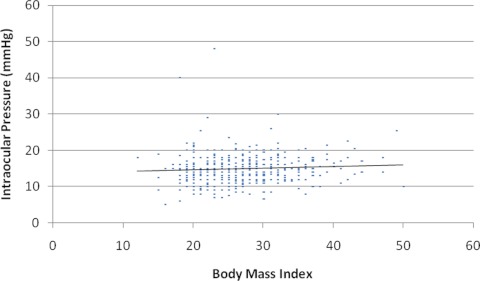
Subgroup analysis revealed that height had a statistically significant, but very small, positive influence on CSFP (r2 = 0.02; P < 0.001; Fig. 4). There were 474 subjects identified for IOP and BMI analysis. The mean IOP was 14.9 ± 4.0 mm Hg (median, 15). Subgroup analysis of IOP and BMI revealed no relationship between the two variables, and r2 = 0.004, 0.005, and 0.005 for the right eye, left eye, and average eye IOP versus BMI, respectively (Fig. 5).
Figure 4.
Relationship between CSFP and height (r2 = 0.02, P < 0.001).
Figure 5.
Individuals' average IOPs plotted against BMI (r2 = 0.005; P < 0.001).
Discussion
The findings in this study indicate a direct, linear relationship between CSFP and BMI, whereas IOP was unaffected by BMI and CSFP. The results confirm those in previous studies in which there was a positive correlation between CSFP and BMI.12,13 Ren et al.12 recently performed a CSFP to BMI analysis on a small cohort and found a significant correlation between body weight and CSFP (r2 = 0.20; P < 0.001) as well as BMI and CSFP (r2 = 0.25; P < 0.001). Several studies have found no meaningful correlation between initial pressure and BMI.15–17 In one study of CSFP and BMI in subjects with normal magnetic resonance venography, no correlation was found between the two variables.18 These studies were hindered by small datasets (100–242 subjects) that may have limited the ability to detect a relationship. In contrast, our much larger dataset provided stronger evidence of a linear relationship between CSFP and BMI.
Recent studies have independently found that increasing BMI is protective for POAG in women; it is noteworthy that the effect has not been seen in men.10,11 In another study comparing patients with NTG with those with high-tension glaucoma, Asrani et al.8 found that lower BMI was significantly more common in the NTG group in both men and women. Even more interesting is that many studies have identified a direct correlation between body weight and intraocular pressure.18–22 On the other hand, since IOP does not appear to be influenced by either BMI or CSFP, these data suggest that, assuming constant IOP, the translaminar pressure decreases with increasing BMI and should decrease the risk for glaucomatous optic nerve damage.
On the basis of findings in retrospective and prospective studies, there is a growing body of evidence that supports the notion that CSFP influences risk for POAG. These studies suggest that lower CSFP increases risk for POAG and NTG. Further, there is evidence in these studies to suggest that higher CSFP reduces the risk for glaucoma in patients with ocular hypertension.1–4 Extrapolation of results obtained from this study offers a partial explanation of how BMI, through its effect on CSFP, could influence the risk for glaucoma. These data suggest that individuals with lower BMIs, particularly at the extremes, may be at greater risk for glaucoma from the associated lower CSFP, and the converse would be true of those with higher BMIs. We found that CSFPs were nearly the same in the men and women. Therefore, the CSFP and BMI model, based on the current data, does not explain the effect of sex. There must be many factors other than CSFP that are associated with BMI and independently contribute to the risk for glaucoma.
Other population-based studies have examined BMI and POAG, and their results have been conflicting. In a study focusing on metabolic syndrome and its association with glaucoma, Newman-Casey et al.5 analyzed different components of the metabolic syndrome separately and found that, in a mostly white population, obesity was associated with a greater risk of developing OAG.5 However, the role of metabolic syndrome in CSFP, as well as its role as an independent risk factor in glaucoma, is not known. Of note, multivariate analysis revealed that the increased hazard ratio applied only to women, not to men.
The race of the subjects used for this analysis was predominately Caucasian, which is a direct reflection of the surrounding referral population. Therefore, it is not known what role race may have played in the results. For example, in a sample from Barbados where the population is largely of West African ancestry, Leske et al.9 found that decreased BMI was associated with increased prevalence of glaucoma. However, Suzuki et al.6,7 found no relationship between BMI in Japanese POAG patients and controls in the Tajimi Study. It is worth noting that the range of BMI in the Japanese population is lower than that in the United States population. In fact, the World Health Organization reported that more than two thirds of adult Japanese have a normal BMI (18.5–24.99) compared with the adults in the United States, where 36% have a normal BMI.23 It is also interesting that 90% of Japanese had normal screening IOP in the Tajimi Study, whereas approximately two thirds had elevated IOP in the Baltimore Eye Survey.6,7,24 How population and environmental characteristics influence the relationship between BMI and other factors affect CSFP remains to be explored.
One of the main limitations of this study is that it was retrospective. Study subjects were selected on the basis of information available within the database and restricted to patients who presumably did not have conditions that influence the values studied. It is likely that patients were included that should have been excluded. However, the number of such patients is unlikely to be sufficient to alter the findings of the analysis. It is also important to note that this study compared the means of each BMI group. CSFP, like IOP or blood pressure, has a wide range of statistically normal values. For this reason, the definition of a normal range is arbitrary and prevents useful interpretation of individual values. By design, this study was a composite of individual LP measurements performed at a specific time point. Therefore, it was cross-sectional, and the data cannot be used to interpret changes in BMI or CSFP that occur as a function of time. Although these are important considerations, we conclude that the impact on this study, derived from such a large dataset, is small.
We initially collected all blood pressure (BP) and IOP data that were measured within 1 month of an LP. Ideally, we would have both the IOP and BP at the time of LP. We know that BP affects CSFP, and IOP does not.25–27 Further, there are far fewer factors that affect IOP compared with blood pressure. Our inability to control for these factors is a limitation, but the variable is likely to be stable enough to permit a useful analysis. On the other hand, BP directly affects CSFP and there are multiple factors that affect BP. The relationship should be studied only if both measures were performed simultaneously. For this reason, we have elected not to analyze the relationship between BP and CSFP in this study.
Another unknown is the relationship between intracranial pressure in the upright position and that in the lateral decubitus position, where it is measured. CSF is a fluid column within the spinal canal and is in direct communication with the ventricles. It is known that CSFP changes as a function of orientation.28,29 For example, in the seated position, the CSFP is 0, typically at a point located between the intracranial area and the upper thoracic region. The pressures above this location are negative. The biomechanical effects of this phenomenon as it pertains to the translaminar pressure are an important area for future research.
In conclusion, we observed a positive, linear relationship between mean CSFP and BMI in a large sample. Patients with higher BMI had, on average, higher CSFP than did those with lower BMI. BMI did not affect the IOP in the subgroup of patients who were analyzed. Therefore, in the scope of this large population, there is a trend of increasing mean CSFP with increasing BMI and stable mean IOP with increasing BMI. The result suggests that the translaminar pressure difference declines with an increase in BMI. As a large translaminar pressure difference has been observed in patients with POAG and a low translaminar pressure difference is associated with ocular hypertension, these findings provide supporting evidence that increased BMI correlates with increased CSFP, which, in turn, may be protective against glaucoma. This is an important finding that helps to support the fact that not all patients with a high IOP have glaucoma and that many patients with glaucoma have a normal IOP—further evidence that attention should be focused on the translaminar pressure difference.
Acknowledgments
The authors thank Francis Aning at Mayo Clinic for assistance in accessing and filtering the electronic medical record data.
Footnotes
Presented at the annual meeting of the Association for Research in Vision and Ophthalmology, Fort Lauderdale, Florida, May 2011.
Supported by National Institutes of Health Research Grants EY 15736 (MPF) and EY 07065 (MPF); Mayo Foundation, Rochester, MN (MPF); and Research to Prevent Blindness (RPB), New York, NY. MPF is a recipient of an RPB Lew R. Wasserman Merit Award and the Department of Ophthalmology, Mayo Clinic and Duke University Eye Center are recipients of unrestricted RPB grants. The funding agencies had no role in the design or conduct of the research.
Disclosure: J.P. Berdahl, None; D. Fleischman, None; J. Zaydlarova, None; S. Stinnett, None; R.R. Allingham, None; M.P. Fautsch, None
References
- 1. Berdahl JP, Allingham RR, Johnson DH. Cerebrospinal fluid pressure is decreased in primary open-angle glaucoma. Ophthalmology. 2008;115:763–768 [DOI] [PubMed] [Google Scholar]
- 2. Berdahl JP, Fautsch MP, Stinnett SS, Allingham RR. Intracranial pressure in primary open angle glaucoma, normal tension glaucoma, and ocular hypertension: a case–control study. Invest Ophthalmol Vis Sci. 2008;49:5412–5418 [DOI] [PMC free article] [PubMed] [Google Scholar]
- 3. Ren R, Jonas JB, Tian G. Cerebrospinal fluid pressure in glaucoma: a prospective study. Ophthalmology. 2010;117:259–266 [DOI] [PubMed] [Google Scholar]
- 4. Ren R, Zhang X, Wang N, Li B, Tian G, Jonas JB. Cerebrospinal fluid pressure in ocular hypertension. Acta Ophthalmol. 2011;89(2):e142–e148 [DOI] [PubMed] [Google Scholar]
- 5. Newman-Casey PA, Talwar N, Nan B, Musch DC, Stein JD. The relationship between components of metabolic syndrome and open-angle glaucoma. Ophthalmology. 2011;118(7):1318–1326 [DOI] [PMC free article] [PubMed] [Google Scholar]
- 6. Suzuki Y, Iwase A, Araie M, et al. Risk factors for open-angle glaucoma in a Japanese population: the Tajimi Study. Ophthalmology. 2006. September;113(9):1613–1617 [DOI] [PubMed] [Google Scholar]
- 7. Iwase A, Suzuki Y, Araie M, et al. The prevalence of primary open-angle glaucoma in Japanese: the Tajimi Study. Ophthalmology. 2004. September;111(9):1641–1648 [DOI] [PubMed] [Google Scholar]
- 8. Asrani S, Samuels B, Thakur M, Santiago C, Kuchibhatla M. Clinical profiles of primary open angle glaucoma versus normal tension glaucoma patients: a pilot study. Curr Eye Res. 2011;36(5):429–435 [DOI] [PubMed] [Google Scholar]
- 9. Leske MC, Connell AM, Wu SY, et al. Risk factors for open-angle glaucoma. The Barbados Eye Study. Arch Ophthalmol. 1995;113:918–924 [DOI] [PubMed] [Google Scholar]
- 10. Pasquale LPR, Willett WC, Rosner BA, Kang JE. Anthropometric measures and their relation to incident primary open-angle glaucoma. Ophthalmology. 2010;117:1521–1529 [DOI] [PMC free article] [PubMed] [Google Scholar]
- 11. Ramdas WD, Wolfs RC, Hofman A, et al. Lifestyle and risk of developing open-angle glaucoma: The Rotterdam Study. Arch Ophthalmology. 2011;129:767–772 [DOI] [PubMed] [Google Scholar]
- 12. Ren R, Wang N, Zhang X, Tian G, Jonas JB. Cerebrospinal fluid pressure correlated with body mass index. Graefes Arch Clin Exp Ophthalmol. Published online August 4, 2011 [DOI] [PubMed] [Google Scholar]
- 13. Fishman RA. Pseudotumor cerebri and related disorders. Cerebrospinal Fluid in Disease of the Nervous System. 2nd ed Philadelphia: WB Saunders; 1992:71–151 [Google Scholar]
- 14. World Health Organization Physical status: the use and interpretation of anthropometry: report of a WHO Expert Committee. WHO Technical Report Series. Geneva: World Health Organization; 1995:854. [PubMed] [Google Scholar]
- 15. Corbett JJ, Mehta MP. Cerebrospinal fluid pressure in normal obese subjects and patients with pseudotumor cerebri. Neurology. 1983;33(10):1386–1388 [DOI] [PubMed] [Google Scholar]
- 16. Whiteley W, Al-Shahi R, Warlow CP. CSF opening pressure: reference interval and the effect of body mass index. Neurology. 2006;67(9):1690–1691 [DOI] [PubMed] [Google Scholar]
- 17. Avery RA, Shah SS, Licht DJ, et al. Reference range for cerebrospinal fluid opening pressure in children. N Engl J Med. 2010;363(9):891–893 [DOI] [PMC free article] [PubMed] [Google Scholar]
- 18. Bono F, Lupo MR, Serra P. Obesity does not induce abnormal CSF pressure in subjects with normal cerebral MR venography. Neurology. 2002;59:1641–1643 [DOI] [PubMed] [Google Scholar]
- 19. Klein BE, Klein R, Linton KL. Intraocular pressure in an American community: the Beaver Dam Eye Study. Invest Ophthalmol Vis Sci. 1992;33:2224–2228 [PubMed] [Google Scholar]
- 20. Mori K, Ando F, Nomura H, et al. Relationship between intraocular pressure and obesity in Japan. Int J Epidemiol. 2000;29:661–666 [DOI] [PubMed] [Google Scholar]
- 21. Bengtsson B, Heijl A. A long-term prospective study of risk factors for glaucomatous visual field loss in patients with ocular hypertension. J Glaucoma. 2005;14:135–138 [DOI] [PubMed] [Google Scholar]
- 22. Wu SY, Leske MC, Barbados Eye Study Group Associations with intraocular pressure in the Barbados Eye Study. Arch Ophthalmol. 1997;115:1572–1576 [DOI] [PubMed] [Google Scholar]
- 23. World Health Organization Global Database on Body Mass Index. Available at http://apps.who.int/bmi/ Accessed June 7, 2011
- 24. Tielsch JM, Sommer A, Katz J, et al. Racial variations in the prevalence of primary open-angle glaucoma: The Baltimore Eye Survey. JAMA. 1991;266(3):369–374 [PubMed] [Google Scholar]
- 25. Davson H, Segal MB. The intracranial or CSF-pressure. Physiology of the CSF and Blood-Brain Barriers. Boca Raton, FL: CRC Press, Inc.; 1996:699–705 [Google Scholar]
- 26. Kirk T, Jones K, Miller S, Corbett J. Measurement of intraocular and intracranial pressure: is there a relationship? Ann Neurol. 2011;70(2):323–326 [DOI] [PubMed] [Google Scholar]
- 27. Han Y, McCulley TJ, Horton JC. No correlation between intraocular pressure and intracranial pressure. Ann Neurol. 2008;64(2):221–224 [DOI] [PubMed] [Google Scholar]
- 28. Magnaes B. Body position and cerebrospinal fluid pressure, part 1: clinical studies on the effect of rapid postural changes. J Neurosurg. 1976;44(6):687–697 [DOI] [PubMed] [Google Scholar]
- 29. Magnaes B. Body position and cerebrospinal fluid pressure, part 2: clinical studies on orthostatic pressure and the hydrostatic indifferent point. J Neurosurg. 1976;44(6):698–705 [DOI] [PubMed] [Google Scholar]


