Abstract
Abrupt climate transitions, known as Dansgaard-Oeschger and Heinrich events, occurred frequently during the last glacial period, specifically from 80–11 thousand years before present, but were nearly absent during interglacial periods and the early stages of glacial periods, when major ice-sheets were still forming. Here we show, with a fully coupled state-of-the-art climate model, that closing the Bering Strait and preventing its throughflow between the Pacific and Arctic Oceans during the glacial period can lead to the emergence of stronger hysteresis behavior of the ocean conveyor belt circulation to create conditions that are conducive to triggering abrupt climate transitions. Hence, it is argued that even for greenhouse warming, abrupt climate transitions similar to those in the last glacial time are unlikely to occur as the Bering Strait remains open.
Keywords: abrupt climate transitions, Atlantic Meridional Overturning Circulation
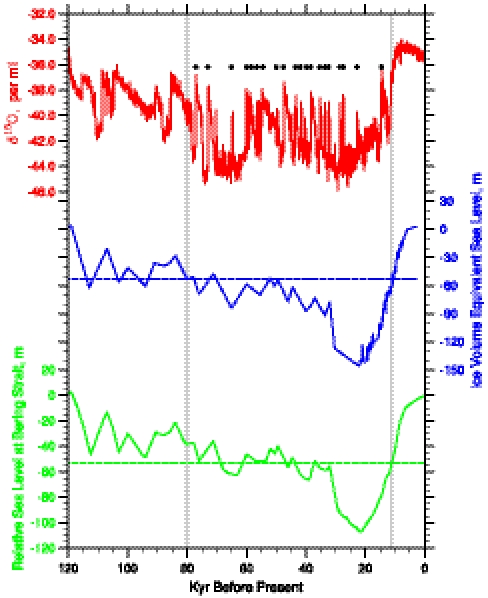
Abrupt climate transitions, known as Dansgaard-Oeschger (D/O) cycles, are a prominent feature of the last glacial period. Identified in different paleo-climate archives, such as Greenland ice cores (1–3), they occurred mostly from about 80–11 thousand years before present (kyr BP) (Fig. 1A). Layers of ice-rafted debris found in North Atlantic sediment cores provide further evidence for a different kind of climate instability, often associated with surging ice-sheets (4, 5). While it is still debated as to whether these variations in North Atlantic climate are driven externally—e.g. by solar forcing or originating from internal climate instabilities (6–10)—it has been established that the Atlantic Meridional Overturning Circulation (AMOC, or the ocean conveyor belt circulation) is at least involved (11–13). It also remains an open question why D/O events were absent during the Holocene and the beginning of the last glacial period, and more importantly whether this type of abrupt climate transition could occur in a future warmer climate associated with elevated atmospheric greenhouse gases.
Fig. 1.
Time series of the North Greenland Ice core δO18 record (A, ref. 1), ice-volume equivalent sea level (B, ref. 21) and the predicted relative sea level in the BS region (C). The dashed lines indicate the present-day depth of the Bering Strait. All sea levels are relative to the present-day sea level. The dots indicate Dansgaard-Oeschger events (2, 3).
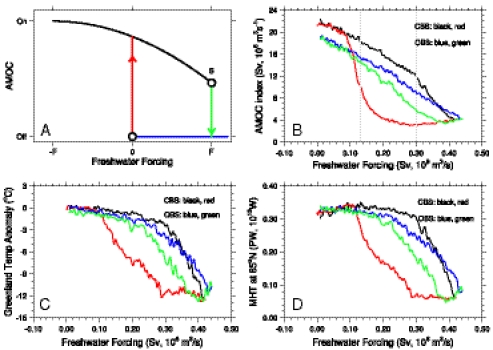
The AMOC characterizes the zonally averaged oceanic circulation in the Atlantic which transports warm saltier upper ocean water from the rest of the oceans to the subpolar North Atlantic where this water loses heat to the atmosphere, becomes dense and sinks to depth, then flows southward and upwells elsewhere. Theoretical studies show that as freshwater forcing increases very slowly in the North Atlantic, the AMOC initially weakens slowly, and then suddenly collapses (ref. 14, Fig. 2A, black line). As freshwater forcing is subsequently slowly reduced, AMOC stays in the “off” mode until a critical value of freshwater forcing is attained that triggers a rapid AMOC resumption (Fig. 2A, red line). The abrupt transitions of the AMOC from “on” to “off,” or vice versa, could induce significant cooling or warming events in the North Atlantic and surrounding regions by disrupting or enhancing the northward ocean heat transport in the Atlantic basin. Therefore, this AMOC hysteresis behavior has been used as a plausible mechanism to explain the abrupt climate transitions recorded in the Greenland Ice core record and supported by paleo-proxy observations (1–5, 11–13).
Fig. 2.
Theoretical and simulated AMOC hysteresis curves (A, B) and the associated changes of Greenland surface temperature and meridional heat transport at 65 °N in the Atlantic (C, D). In panel a), “S” is the bifurcation point beyond which AMOC collapses and the “+/-F” values indicate the freshwater forcing strength. In (B), (C), and (D), the black/red (blue/green) lines are for the closed (open) BS simulation. The black/blue (red/green) lines represent the phase of freshwater forcing increase (decrease) in these simulations. Note that a change of the freshwater forcing by 0.1 Sv (Sv ≡ 106 m3 s-1) in this figure takes place over 500 model years.
Studies based on earth system models of intermediate complexity (EMICs) and a coarse resolution atmosphere-ocean global climate model (AOGCM) indicate that the AMOC may exhibit multiple-equilibrium states under the same climatic forcing (15, 16), which supports a theoretical study (14). However, to date, there is no state-of-the-art AOGCM that supports the notion of a bistable ocean circulation under modern conditions with an open Bering Strait (BS), casting doubt on whether the AMOC mechanism could explain past abrupt climate transitions (17).
The stability of the glacial AMOC depends crucially on the salinity transport into the North Atlantic, which is partly controlled by the influx of fresher North Pacific surface waters into the Arctic Ocean via the BS (18–21). Presently this influx amounts to about 800-thousand-cubic-meters per second (0.8 Sv; 1 Sv ≡ 106 m3 s-1, ref. 22). Reconstructed past sea level changes (23) and Greenland ice core records (1–3) indicate that abrupt climate transitions occurred when the sea level was about 50 m below its present level (Fig. 1 A and B). With a present-day depth of about 50 m, BS was a land-bridge for most of the last glacial period, which allowed for early human migration to North America. More accurately computed relative sea level changes in the BS (see Supporting Information) suggest that the North Pacific was closed off from the Arctic Ocean from about 80–11 kyr B.P (Fig. 1C), which roughly coincides with the time of strong D/O and millennial-scale variability. Earlier studies speculated that the BS may have played a major role in the occurrence of these abrupt climate transitions through controlling the AMOC’s response to external freshwater forcing (18–21). Furthermore, in subsequent modeling studies it was demonstrated that a BS closure is likely to have affected the stability of the major Laurentide ice-sheet (24), consistent with a recent marine core study (25).
Model and Experiments
Here we evaluate the potential impact of the BS closure/opening on the glacial climate stability by testing the role of the Bering Strait on AMOC hysteresis. A fully coupled state-of-the-art AOGCM—the Community Climate System Model, version 3 (CCSM3, ref. 26)— is employed with a resolution high enough to properly simulate effects of BS closure on the North Atlantic climate system and its stability. This model simulates realistic BS transports under present-day conditions (18) in comparison to observations (22). To isolate the potential effect of the BS closure/opening on the AMOC hysteresis, two identical water-hosing simulations under present-day boundary conditions are carried out, except that the BS is open in one (Open Bering Strait, or OBS) but closed in the other (Closed Bering Strait, or CBS).
Following ref. 15, an initial freshwater flux of 200 m3/s (about 4 times the value used in ref. 15) is added to the North Atlantic between 20 and 50 °N. This freshwater flux increases by 200 m3/s per year until the AMOC collapses. Afterwards this additional freshwater forcing linearly decreases to zero at the same rate. With such a slow rate change, a freshwater forcing increment/decrement of 0.1 Sv takes place over 500 y, thus maintaining the AMOC at a quasiequilibrium state throughout our simulation. Therefore, our simulations differ significantly from many previous coupled model studies (18, 19) since here we focus specifically on the BS impact on the AMOC hysteresis, not AMOC’s response to a short-lived freshwater pulse. Our simulations also stand out from EMIC type simulations (15) by using an AOGCM with a reasonably high horizontal resolution that captures atmosphere-ocean-sea-ice coupling more realistically.
Results
In the OBS simulation, the AMOC (defined as the maximum of the Atlantic meridional overturning streamfunction below 500 m depth) slows down almost linearly as the freshwater forcing increases until AMOC collapses (Fig. 2B, Fig. S1A). As the freshwater forcing is reduced, AMOC stays in the off mode only for a short period (less than 400 yr) before it starts to linearly strengthen. This seems to confirm previous results which indicate that, with an open BS, the AMOC off mode is an advectively unstable mode (19, 27). Therefore, with an open BS, there are no AMOC multiple equilibria. When BS is closed, however, the AMOC exhibits a behavior reminiscent of the hysteresis behavior in the simplified models (15): AMOC weakens slowly as freshwater forcing increases initially, with a significant acceleration when freshwater forcing exceeds 0.3 Sv, leading to an AMOC collapse for a freshwater forcing of 0.42 Sv. After that, the AMOC stays near the off mode for about 1,400 yr while the freshwater forcing gradually reduces, before it finally returns to the prehosing level when the freshwater forcing drops below 0.15 Sv (Fig. S1A). The AMOC recovery from off to active mode is, however, not as sharp as indicated in theoretical studies (14) and intermediate complexity models (15, 28), perhaps due to the damping associated with local and remote air-sea interactions. Additionally, the AMOC system might not be completely in equilibrium at each point on the curve, creating possible transients.
As the AMOC collapses, the mean surface temperatures of Greenland drop by 12 °C in both simulations (Fig. 2C, Fig. S1B), comparable to the magnitude of Greenland temperature variations in the abrupt climate change events recorded in the Greenland ice core data (29), confirming that an AMOC collapse could indeed induce large temperature changes in Greenland.
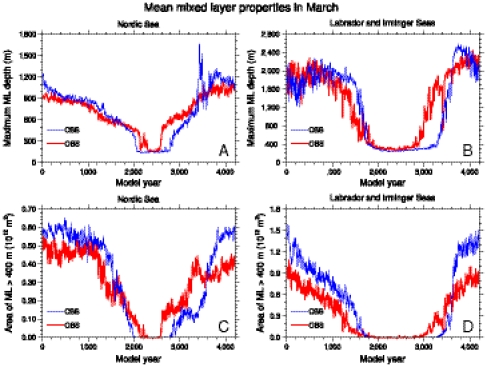
Although the AMOC recovers more abruptly in the CBS simulation than in the OBS simulation, the increase of Greenland temperatures is actually not as abrupt in the former as in the latter simulation. As suggested by Fig. 2D and Fig. S1C, the Greenland temperature change seems closely associated with the alterations of the Atlantic meridional heat transport (MHT) at 65 °N, which is closely related to the strength of North Atlantic deep convection. This deep convection restarts about 600 yr earlier in the Nordic Seas than in the Labrador and Irminger Seas in the CBS simulation (Fig. 3), resulting in a two-stage recovery of the Atlantic deep convection and a slower increase of Greenland temperature. In contrast, deep convection in these two regions in the OBS simulation restarts less than 300 yr apart, leading to a more abrupt Greenland warming. This two-stage recovery in the CBS simulation may be an artifact of the modern-day background climate used in this experiment. Under glacial conditions, the Nordic Seas were mostly sea ice covered and deep convection possibly occurred mostly in the Labrador and Irminger Seas. This might have led to a one-stage recovery of the Atlantic deep convection, resulting in a more abrupt warming in Greenland, such as in ref. 17.
Fig. 3.
Changes of the maximum March mixed layer depth and the area over which the maximum March mixed layer depth is greater than 400 meters in the Nordic Sea (A, C), and the Labrador and Irminger Seas (B, D). Blue lines are for the closed Bering Strait simulation and red lines for the open Bering Strait simulation.
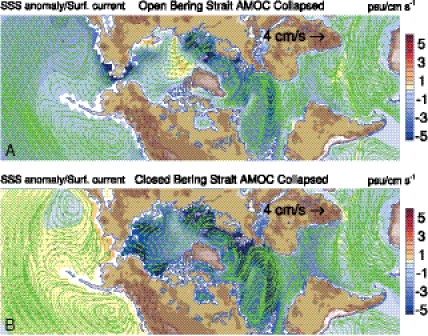
The different AMOC responses to freshwater forcing in our simulations can be attributed to variations of the BS throughflow. Earlier studies indicate that with an open BS, the flow through this strait is controlled primarily by the sea level difference between the Pacific and the Arctic (Atlantic), with a higher sea level in the former (19, 30). In the OBS experiment, a fresher North Atlantic and a weaker AMOC lead to a dynamic sea level rise in the North Atlantic (31–33). This reduces, or even reverses, the sea level contrast between the Pacific and the Atlantic, leading to a weakened/reversed BS throughflow (Fig. 4A, Fig. S2, Fig. 3A), resulting in a reduced freshwater transport from the Pacific into the North Atlantic, and even transporting the now fresher North Atlantic water back into the North Pacific. In any case, this process reduces the freshwater flux into the North Atlantic from across the Arctic. There is subsequently less freshwater convergence and a smaller salinity anomaly in the North Atlantic (Fig. 4A, Fig. S3A), and this prevents a sudden AMOC collapse. When the freshwater forcing gradually reduces after the AMOC collapses eventually, the freshwater anomaly in the Atlantic still is diverging out of the subpolar region into the South Atlantic and North Pacific via surface ocean currents with the same speed as when AMOC has just collapsed. This will make the surface ocean saltier, leading to a weakened oceanic stratification, a restart of deep convection and the AMOC (Fig. 3, Fig. S4), and a resumption of fresh Pacific water being transported into the North Atlantic via the BS (Fig. S2), thus preventing the AMOC from a sudden jump in strength (19). Instead it increases slowly in magnitude.
Fig. 4.
Sea surface salinity (SSS) anomaly and sea surface currents when AMOC collapses for the open Bering Strait (A) and closed Bering Strait (B) simulations. The arrows are the sea surface currents with units of cm/s. The shading is the SSS anomaly with a contour interval of 0.5 psu.
With a closed BS, as freshwater forcing strengthens in the North Atlantic, the AMOC also weakens and part of the freshwater added to the North Atlantic is transported into the Arctic. However, the closed BS prevents this freshwater from being carried into the Pacific, inducing a prominent freshening effect in the Arctic and a sea level rise, especially along the edges of the Arctic. As a result, a large surface cyclonic gyre forms in the subpolar North Atlantic and the Arctic basins (Fig. 4B, Fig. S3B). This subpolar-Arctic cyclonic gyre transports the Arctic freshwater anomaly back into the North Atlantic, generating an enhanced freshwater convergence there and a much greater negative surface salinity anomaly (Fig. 4B). This reduces the upper ocean water density (Fig. S4), strengthens the upper ocean stratification, and suppresses deep convection in the subpolar North Atlantic, leading to the collapse of the AMOC in this simulation. Once the AMOC collapses, the ocean’s ability to transport the North Atlantic freshwater anomaly elsewhere of the world ocean through the overturning circulation is greatly reduced. Therefore, the divergence of this North Atlantic freshwater anomaly depends mostly on the much less efficient water mass exchange between the subpolar-Arctic cyclonic gyre and the subtropical gyre. As the freshwater forcing in the North Atlantic starts to weaken, the resulting freshwater anomaly in the North Atlantic (Fig. S4) can only be transported southward because of the closed BS, thus delaying the removal of the freshwater anomaly and leading to a delayed recovery of the AMOC (19). Once the Arctic freshwater anomaly becomes sufficiently small due to the transport by the oceanic currents and the atmospheric circulation, this big subpolar-Arctic cyclonic gyre breaks into two gyres again—a cyclonic gyre in the subpolar North Atlantic and an anticyclonic gyre in the Arctic, reducing the freshwater convergence in the subpolar North Atlantic, leading to renewal of the deep convection there (Fig. S4) and a rapid AMOC recovery on timescales of a few hundred years.
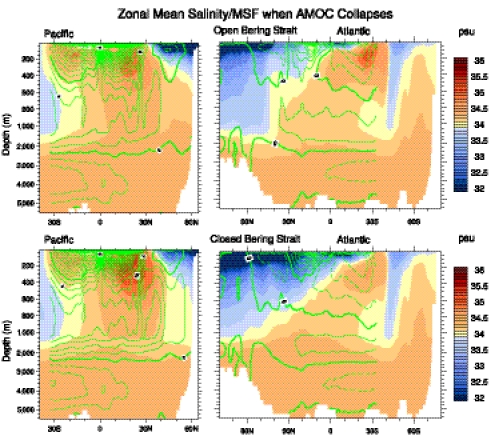
The effect of the BS closure on the AMOC and the adjustment of the global scale ocean circulation can be further illustrated from the zonal mean salinity and meridional overturning streamfunction fields in the Atlantic and Pacific basins during the weak AMOC phase (Fig. 5) and strong AMOC phase (Fig. S5). Resulting from the changes of the BS transport in the OBS simulation, the upper few hundred meters of the North Atlantic are much saltier in the OBS run than in the CBS run. But the upper North Pacific is much fresher in the OBS run than in the CBS run due to the reduced/reversed freshwater transport from the North Pacific into North Atlantic via the BS (see Fig. 4). Resulting from these different salinity distributions in the two basins, although the Atlantic overturning patterns are quite similar in these two simulations when AMOC is off (Fig. 5), the Pacific overturning circulations are quite different. As illustrate in ref. 34 and Fig. S6, a Pacific MOC sets up in the CBS simulation due to this saltier North Pacific, but not in the OBS simulation. On the other hand, the fresher upper North Atlantic in the CBS simulation prevents a quick resumption of deep convection, thus keeping the AMOC in the off mode for much longer, even in case of weakened external freshwater forcing. These processes lead to the AMOC hysteresis in the CBS simulation. The surge of freshwater from the North Atlantic into the North Pacific via the BS and into the southern oceans in the OBS simulation leads to an early resumption of the deep convection in the North Atlantic (19), preventing the occurrence of the AMOC hysteresis in the OBS simulation.
Fig. 5.
Zonal mean salinity (shading) and meridional streamfunction (contour) in the Pacific (Left) and the Atlantic (Right) with a collapsed AMOC. The contour interval of the meridional streamfunction is 2 Sv, and that of zonal mean salinity is 0.1 psu. The upper panels are for the open Bering Strait simulation and lower panels for the closed Bering Strait simulation. Note: the scale for the upper 1,000 m of the ocean is stretched.
Conclusion and Discussion
Our AOGCM simulations have suggested that under present-day conditions, a strong AMOC hysteresis can only be found when the BS is closed. With an open BS, the AMOC does not exhibit an apparent hysteresis from the freshwater forcing. These results imply that if the AMOC hysteresis is indeed a plausible mechanism to explain past abrupt climate transitions, such as the D/O events, these abrupt climate transitions could occur only during glacial times with a (nearly) closed BS. With an open BS, such as during the Holocene and in the future warmer climate associated with elevated levels of atmospheric greenhouse gases, our results indicate that the manifestations of bistability are unlikely to occur, reducing the chances for abrupt climate transitions associated with an AMOC collapse or recovery.
Our results also suggest that the discharge of land-based ice (or the instability of the land-based ice, ref. 35) might be only one of the necessary conditions to induce abrupt climate transitions, with the existence of the AMOC hysteresis being another one. For example, due to the lack of AMOC hysteresis, although the discharged land-based ice volume during the early Holocene is equivalent to about a 50 m global sea level rise, there have been no abrupt climate transitions in this period of similar magnitude to those that occurred during the last glacial period. Moreover, although the same conclusion regarding abrupt climate transitions only being able to occur during glacial times has been reached, the mechanism for glacial climate instability proposed in this study is fundamentally different from the mechanism proposed by a previous study (21) in which the authors proposed only that a BS closure has prevented the freshwater anomaly from being exported into the North Pacific. The lack of the AMOC hysteresis with an open Bering Strait could be the key for the absence of the abrupt climate change events during the early Holocene while major discharge of continental ice was still ongoing (Fig. 1B).
In order to isolate the BS effects on AMOC hysteresis and with the concern of possible future abrupt climate changes in mind, we intentionally used the same climate boundary condition—the present-day condition. Questions may be raised regarding whether our result with a closed BS would hold if glacial boundary conditions had been used. Earlier AOGCM studies showed that the AMOC’s response to a strong pulse of freshwater forcing in the North Atlantic under present-day and glacial conditions is similar with a closed Bering Strait (19), suggesting that the conclusions reached here would be valid for glacial times. However, some previous simple model studies on AMOC hysteresis show diversified results under these climate conditions. Some indicate that AMOC hysteresis exists under both last glacial maximum (LGM) and present-day conditions, but with a narrower AMOC hysteresis width in the former than in the latter (36–38). Others suggest that under LGM conditions, the AMOC only has one stable mode (28). Moreover, due to the crudeness of these simple models, the BS cannot be represented properly and normally it is closed. Thus the results from this type of model are mostly equivalent to our closed BS simulation (more discussion in Supporting Information). Therefore, although our model could not simulate all of the physical processes in the Atlantic basin perfectly, the underlying physical mechanism we explore here is plausible to explain the questions we raised at the beginning. Thus we conclude it is very likely that the results reached here would hold under glacial conditions, at least qualitatively. However further study using glacial climate boundary conditions and multimodels is still needed for a further understanding of past abrupt climate transitions.
Supplementary Material
Acknowledgments.
A portion of this study was supported by the Office of Science (BER), U.S. Department of Energy, Cooperative Agreement No. DE-FC02-97ER62402. The National Center for Atmospheric Research is sponsored by the National Science Foundation. This research used resources of the National Energy Research Scientific Computing Center, which is supported by the Office of Science of the U.S. Department of Energy under Contract DE-AC02-05CH11231. Weiqing Han is supported by National Science Foundation CAREER award OCE 0847605 and NASA OSTST award NNX08AR62G.
Footnotes
The authors declare no conflict of interest.
This article is a PNAS Direct Submission.
This article contains supporting information online at www.pnas.org/lookup/suppl/doi:10.1073/pnas.1116014109/-/DCSupplemental.
References
- 1.North Greenland Ice Core Project members. High-resolution record of Northern Hemisphere climate extending into the last interglacial period. Nature. 2004;431:147–151. doi: 10.1038/nature02805. [DOI] [PubMed] [Google Scholar]
- 2.Dansgaard W, et al. Evidence for general instability for past climate from a 250-kyr ice-core record. Nature. 1993;364:218–220. [Google Scholar]
- 3.Ditlevsen P-D, Kristensen M-S, Andersen K-K. The recurrence time of Dansgaard-Oeschger events and limits on the possible periodic component. J Climate. 2005;18:2594–2603. [Google Scholar]
- 4.Heinrich H. Origin and consequences of cyclic ice rafting in the northeast Atlantic Ocean during the past 130,000 years. Quat Res. 1988;29:142–152. [Google Scholar]
- 5.Hemming S-R. Heinrich events: Massive late Pleistocene detritus layers of the North Atlantic and their global climate imprint. Rev Geophys. 2004;42:RG1005. doi: 10.1029/2003RG000128. [Google Scholar]
- 6.Braun H, et al. Possible solar origin of the 1470-year glacial climate cycle demonstrated in a coupled model. Nature. 2005;438:208–211. doi: 10.1038/nature04121. [DOI] [PubMed] [Google Scholar]
- 7.Schulz M. On the 1470-year pacing of Dansgaard-Oeschger warm events. Paleoceanography. 2002;17:1014. doi: 10.1029/2000PA000571. [Google Scholar]
- 8.Alley R-B, MacAyeal D-R. Ice-rafted debris associated with bing/purge oscillations of the Laurentide ice sheet. Paleoceanography. 1994;9:503–511. [Google Scholar]
- 9.Broecker W-S. Massive iceberg discharges as triggers for global climate change. Nature. 1994;372:421–424. [Google Scholar]
- 10.Dima M, Lohmann G. Conceptual model for millennial climate variability: a possible combined solar-thermohaline circulation origin for the ∼1,500-year cycle. Climate Dynamics. 2009;32:301–311. [Google Scholar]
- 11.Clark P-U, et al. In: Ocean Circulation: Mechanisms and Impacts. Schmittner A, Chiang J, Hemming S, editors. Vol. 173. Washington, DC.: American Geophysical Union; 2007. pp. pp209–246. Geophysical Monograph. [Google Scholar]
- 12.Gutjahr M, Hoogakker B, Frank M, McCave I. Changes in North Atlantic Deep Water strength and bottom water masses during Marine Isotope Stage 3 (45–35 ka BP) Quaternary Sci Rev. 2010;29:2451–2461. [Google Scholar]
- 13.Zahn R, et al. Thermohaline instability in the North Atlantic during meltwater events: Stable isotope and ice-rafted detritus records from core SO75-26KL, Portuguese margin. Paleoceanography. 1997;12:696–710. [Google Scholar]
- 14.Rahmstorf S. Bifurcations of the Atlantic Thermohaline circulation in response to changes in the hydrological cycle. Nature. 1995;378:145–149. [Google Scholar]
- 15.Rahmstorf S, et al. Thermohaline circulation hysteresis: A model intercomparison. Geophys Res Lett. 2005;32:L23605. doi: 10.1029/2005GL023655. [Google Scholar]
- 16.Hawkins, et al. Bistability of the Atlantic overturning circulation in a global climate model and links to ocean freshwater transport. Geophys Res Lett. 2011;38:L10605. doi: 10.1029/2011GL047208. [Google Scholar]
- 17.Liu Z, et al. Transient simulation of last deglaciation with a new mechanism for Bolling-Allerod warming. Science. 2009;325:310–314. doi: 10.1126/science.1171041. [DOI] [PubMed] [Google Scholar]
- 18.Hu A, Meehl G-A, Han W. Role of the Bering Strait in the thermohaline circulation and abrupt climate change. Geophys Res Lett. 2007;34:L05704. doi: 10.1029/2006GL028906. [Google Scholar]
- 19.Hu A, et al. Response of thermohaline circulation to freshwater forcing under present day and LGM conditions. J Climate. 2008;21:2239–2258. [Google Scholar]
- 20.De Boer A-M, Nof D. The exhaust valve of the North Atlantic. J Climate. 2004;17:417–422. [Google Scholar]
- 21.De Bore A-M, Nof D. The Bering Strait’s grip on the northern hemisphere climate. Deep-Sea Res Pt I. 2004;51:1347–1366. [Google Scholar]
- 22.Woodgate R-A, Aagaard K. Revising the Bering Strait freshwater flux into the Arctic Ocean. Geophys Res Lett. 2005;32:L02602. doi: 10.1029/2004GL021747. [Google Scholar]
- 23.Lambeck K, Chappell J. Sea level change through the last glacial cycle. Science. 2001;292:679–686. doi: 10.1126/science.1059549. [DOI] [PubMed] [Google Scholar]
- 24.Hu A, et al. Influence of Bering Strait flow and North Atlantic circulation on glacial sea level changes. Nat Geosci. 2010;3:118–121. doi: 10.1038/NGEO729. [Google Scholar]
- 25.Grützner J, Higgins S-M. Threshold behaviour of millennial scale variability in deep water hydrography inferred from a 1.1 Ma long record of sediment provenace at the southern Gardar Drift. Paleoceanography. 2010;25:PA4204. doi: 10.1029/2009PA001873. [Google Scholar]
- 26.Collins W-D, et al. The Community Climate System Model: CCSM3. J Climate. 2006;19:2122–2143. [Google Scholar]
- 27.Ganopolski A, Rahmstorf S. Rapid changes of glacial climate simulated in a coupled climate model. Nature. 2001;409:153–158. doi: 10.1038/35051500. [DOI] [PubMed] [Google Scholar]
- 28.Krebs U, Timmermann A. Fast advective recovery of the Atlantic meridional overturning circulation after a Heinrich event. Paleoceanography. 2007;22:PA1220. doi: 10.1029/2005PA001259. [Google Scholar]
- 29.Alley R-B, et al. Abrupt climate change. Science. 2003;299:2005–2010. doi: 10.1126/science.1081056. [DOI] [PubMed] [Google Scholar]
- 30.Shaffer G, Bendtsen J. Role of the Bering Strait in controlling North Atlantic Ocean circulation and climate. Nature. 1994;367:354–357. [Google Scholar]
- 31.Levermann A, et al. Dynamic sea level changes following changes in the thermohaline circulation. Clim Dynam. 2005;24:347–354. [Google Scholar]
- 32.Yin J, Schlesinger M-E, Stouffer R-J. Model projections of rapid sea level rise on the mortheast coast of the United States. Nat Geosci. 2009;2:262–266. doi: 10.1038/NGEO462. [Google Scholar]
- 33.Hu A, Meehl G-A, Han W, Yin J. Transient response of the MOC and climate to potential melting of the Greenland Ice Sheet in the 21st century. Geophys Res Lett. 2009;36:L10707. doi: 10.1029/2009GL037998. [Google Scholar]
- 34.Hu A, et al. The Pacific-Atlantic seesaw and the Bering Strait. Geophys Res Lett. 2012;38:L03702. doi: 10.1029/2011GL050567. [Google Scholar]
- 35.Schulz M, Berger W-H, Sarnthein M, Grootes P-M. Amplitude variations of 1470-year climate oscillations during the last 100,000 years linked to fluctuations of continental ice mass. Geophys Res Lett. 1999;26:3385–3388. [Google Scholar]
- 36.Prange M, Romanova V, Lohmann G. The glacial Thermohaline circulation: stable or unstable? Geophys Res Lett. 2002;29 doi: 10.1029/2002GL015337. [Google Scholar]
- 37.Weber S-L, Drijfhout S-S. Stability of the Atlantic meridional overturning circulation in the last glacial maximum climate. Geophys Res Lett. 2007;34:L22706. doi: 10.1029/2007GL031437. [Google Scholar]
- 38.Paillard D. Glacial hiccups. Nature. 2001;409:147–148. doi: 10.1038/35051691. [DOI] [PubMed] [Google Scholar]
Associated Data
This section collects any data citations, data availability statements, or supplementary materials included in this article.


