

Abstract
Mathematical models can provide key insights into the course of an ongoing epidemic, potentially aiding real-time emergency management in allocating health care resources and by anticipating the impact of alternative interventions. We study the ex post reliability of predictions of the 2010–2011 Haiti cholera outbreak from four independent modeling studies that appeared almost simultaneously during the unfolding epidemic. We consider the impact of different approaches to the modeling of spatial spread of Vibrio cholerae and mechanisms of cholera transmission, accounting for the dynamics of susceptible and infected individuals within different local human communities. To explain resurgences of the epidemic, we go on to include waning immunity and a mechanism explicitly accounting for rainfall as a driver of enhanced disease transmission. The formal comparative analysis is carried out via the Akaike information criterion (AIC) to measure the added information provided by each process modeled, discounting for the added parameters. A generalized model for Haitian epidemic cholera and the related uncertainty is thus proposed and applied to the year-long dataset of reported cases now available. The model allows us to draw predictions on longer-term epidemic cholera in Haiti from multiseason Monte Carlo runs, carried out up to January 2014 by using suitable rainfall fields forecasts. Lessons learned and open issues are discussed and placed in perspective. We conclude that, despite differences in methods that can be tested through model-guided field validation, mathematical modeling of large-scale outbreaks emerges as an essential component of future cholera epidemic control.
Keywords: waterborne diseases, epidemiology, ecohydrology, human mobility, Markov chain Monte Carlo
As a major cholera epidemic spread through Haiti (1–6), leading to 170,000 reported cases and 3,600 deaths at the end of 2010 (1), four independent modeling studies (7–10) appeared almost simultaneously, each predicting the subsequent course of the epidemic and/or the impact of potential management strategies.
The spate of mathematical models confirmed earlier suggestions that their impact on public health practice is gaining momentum (11). Indeed mathematical models of infectious diseases, once properly tested for reliability, can provide key insight into the course of an epidemic in time for action, thus averting deaths and reducing the number of infected patients through a sensible allocation of resources, possibly including vaccines (12, 13). Because the Haiti cholera models were published early in the course of the epidemic, which as of Oct 26, 2011 had gone on to produce an estimated 485,092 cases, 259,549 hospitalizations, and 6,712 deaths (1), the subsequent course of the epidemic allows an assessment of the reliability of the early predictions and a related discussion on the lessons learned.
Before 2010, cholera had never before been reported in Haiti (14, 15) and it was thus likely that the population had no significant prior exposure or acquired immunity to the disease. Haiti also lacked preparedness for this epidemic and suitable health infrastructure through which to combat it (2, 3). Although there is some debate as to the source, most experts agree that the first cases were autochthonous, brought into Haiti from a distant geographic source (6, 16, 17), and that these cases seeded the subsequent epidemic, which originated within the Centre department and then spread to all of the Haitian departments, exhibiting complex spatial and temporal patterns (1, 6) (Fig. S1).
Once a cholera epidemic starts, infected patients excrete huge numbers of Vibrio cholerae bacteria that spread either through water pathways (via active and passive dispersal) (10, 18–20) or through human mobility networks involving both susceptibles and infected individuals (8, 10, 20). Poor sanitation, which characterized Haiti after the disastrous 2010 earthquake, facilitates both types of spread and fosters the abundance of microorganisms in the water system. Some, such as V. cholerae, are extremely versatile and can quickly adapt to new environments. Being primarily an aquatic bacterium, V. cholerae can persist indefinitely in rivers, estuaries, and coastal regions without any need for human passage. The incidence of cholera in such ecosystems fluctuates as a function of climatic forces (in particular El Niño Southern Oscillation, ENSO) and changes as extensively described for the region around the Bay of Bengal (21–27) (e.g., ENSO is likely to operate in part through interannual changes in rainfall and act as a remote driver of the disease (26, 27)). Because of weak sanitary infrastructures and favorable environmental conditions, it seems therefore likely that cholera will continue to be a threat in Haiti, as well as in many developing countries (3–5).
In this paper, we examine premises, methods, and results of models of the 2010–2011 Haiti epidemic cholera, to derive lessons that directly affect the predictive value of model outputs on pathogen dispersal mechanisms, model-guided field validations, data requirements, and model identification. On the basis of this analysis, we highlight shortcomings of past approaches and discuss mechanisms of disease transmission driven by rainfall. Best-performing models are identified via rigorous criteria from available epidemiological and hydrological time series and, through them, a multiseason projection is proposed and discussed.
A First Assessment
All four models of the 2010–2011 Haiti cholera epidemic (7–10) address the coupled dynamics of susceptibles, infected individuals, and bacterial concentrations in the water reservoir in a spatially explicit setting of local human communities. The entire Haitian population was assumed to be susceptible at the outset of the epidemic. Each of the models assumed that the rate at which susceptibles become infected is dependent on the V. cholerae concentration in available water and, in turn, that new free-living bacteria are produced by infected individuals through fecal contamination of water. The main differences among the models stemmed from assumptions about pathogen redistribution mechanisms among the different human communities.
We first examine the reliability of our own original scheme (7), later discussing the main differences from the other approaches (8–10) and the impact of these differences on predictions. The reference model of epidemiological dynamics and pathogen redistribution is described in (SI Materials and Methods). Fig. 1 compares the projected course of the epidemic as published in January 2011 with the actual reported case counts reported at the end of September 2011 (1). Highlighted (dark gray) in Fig. 1 is the dataset used for calibration, which is limited to the end of December 2010 before the first decline of the incidence of the disease. The original prediction (7) ran up to the end of May 2011 (solid line in Fig. 1). The 5-mo forecast, judged in retrospect, was quite robust and could have been used to make practical decisions and act in time. To facilitate a further assessment of our model reliability, we have now extended the original prediction to the end of September 2011 (Fig. 1, dashed line). Whereas the order of magnitude of total cumulated infections is captured up to September 2011, important features are clearly missed, such as the June–July revamping of weekly incidence (which is likely correlated to seasonal rainfall, Fig. 1, Top).
Fig. 1.

(Top) Daily decadal rainfall intensity, averaged over the entire Haiti region (SI Materials and Methods). (Middle) Weekly reported cases (1) (gray bars) compared with the simulated incidence pattern (solid line) computed by the model in ref. 7. Data from each department were collected until September 30, 2011. The calibration dataset (dark gray) was limited to the total reported cases available until December 2010. The solid line shows the published early prediction (7) that was run until the end of May 2011. To facilitate the assessment, we have now extended the original prediction to the end of September 2011 (dashed line). (Bottom) Simulated and reported weekly cumulated cases.
The various approaches dealing with the Haiti cholera outbreak (7–10) may be differentiated on the basis of their treatment of spatial transmission mechanisms. Andrews and Basu (9) treated each Haiti administrative department independently without explicitly considering the spread of cholera among them whereas the other models (7, 8, 10) explicitly modeled inter- and intradepartmental pathogen redistribution. Different spatial resolutions also characterize the metacommunity models (10 local communities in ref. 8, 11 in ref. 9, 560 in ref. 7, and on the order of 20,000 in ref. 10).
For those studies that provided predictions of the subsequent course of the outbreak, the projections can be tested against current data, yielding a first assessment of validity and the limitations of different modeling assumptions. For example, Andrews and Basu (9) forecast a toll of 779,000 cases and 11,100 deaths from March 1 to November 30, 2011 that significantly overestimated the course of the epidemic; 324,405 new reported cases (accounted for as proposed in ref. 9) (SI Materials and Methods) and 2,040 deaths were actually reported between March 1 and October 26 (1). We suggest that the differences with observational data stem from the nature of the modeling assumptions that undermine the predictability of the approach. In fact, disregarding interdepartmental pathogen dispersal mechanisms implies the independent fitting of the model parameters to 11 separate departments. Therefore, model parameters are also charged with the effects of long-range transmission mechanisms, including human mobility that is empirically known to be reaching well beyond departmental domains (28). Regardless of calibration techniques, the large number of parameters (33 vs. 5 in ref. 7) likely increases the uncertainty of early projections.
The role of asymptomatic carriers may be clarified by the detailed examination of one scheme (8) that employs transmission mechanisms similar to those in ref. 7 (save for the inclusion of a human-to-human contagion) but neglects the role of inapparent infections. Asymptomatic carriers are thought to be a critical factor in cholera epidemics (29), particularly in Haiti (7, 9, 10), because of their number, unimpaired mobility, and thus major role in long- and short-range disease transmission. Inapparent infections are estimated at 20% of the total (9, 10, 29–31,). Moreover, they lead to some acquired immunity, thus temporarily reducing the number of persons in a region who are actually susceptible to the disease. The model by Tuite et al. (8) with realistic values of the basic reproduction number  (SI Materials and Methods) fits the initial phases of the epidemic but would predict an excessive number of reported cases at later stages. To overcome this limitation, the authors propose an ad hoc sixfold reduction of the effective reproduction number in the first 3 mo of the epidemic, owing to disease-control interventions. If the compartment of susceptibles is not depleted otherwise, an equal decrease in transmission rates is implied, which seems unrealistic compared with the sanitation interventions analyzed. Adopting a model in which inapparent infections are accounted for avoids the need to force effective reproduction numbers to decrease in time because of unspecified disease-control measures (32).
An interesting mathematical cholera transmission model, individual based and of stochastic nature (10), focuses on the effects of vaccination strategies for epidemic cholera in Haiti. It addresses the same basic transmission processes as those in refs. 7 and 8, but also includes a 1- to 5-d latent period, a hyperinfective state of freshly shed bacilli, and a model of human mobility that incorporates remotely sensed population density data at 1-km2 resolution and the localization of major rivers and highways. The study does not attempt to tune processes by matching observed space–time distributions of reported cholera cases (10) but is rather based on model parameter values and ranges from the literature. The main shortcomings of this approach include a limited capability of reproducing past observed infections and thus of reliably predicting future epidemic evolutions.
A Second Assessment
The newly available information on the Haitian outbreak allows a thorough reanalysis of primary and ancillary transmission mechanisms. The result of our reanalysis is a host of models of different complexity that are described in SI Materials and Methods.
Because the analysis is now extended to a 1-y time span, the loss of acquired immunity (i.e., a flux from the pool of recovered cases back to the pool of susceptible individuals) cannot be ignored. It is thus accounted for by all models compared here. We have also revised our metacommunity model of transmission among human settlements exposed to the infection by including specific mechanisms of hydrological transport (10, 18–20), as suggested by empirical observation of the downstream spreading of early infections along the Artibonite River (6). Pathogen dispersal along waterways is described (i) by a careful extraction of the river networks (Fig. 2) from digital terrain maps (DTMs), through suitable geomorphologic criteria (SI Materials and Methods), and (ii) as a biased random walk process on an oriented graph (18) (Materials and Methods and SI Materials and Methods). Pathogen redistribution is also enhanced by contamination of the water reservoir driven by heavy seasonal rains (Materials and Methods). Inclusion of such overloads was prompted by the clear empirical correlation, observed in Haiti in June and July, between weekly rainfall and enhanced infections (Fig. 1). We considered two options: an increase of contamination rates depending on rainfall intensity and a mechanistic account of the washout of open-air defecation sites by surface runoff (SI Materials and Methods). Human mobility patterns are explicitly modeled (8, 10, 20). Observations of fast intercatchment transmission of the infection that would not be explained by water pathway pathogen dispersal and of actual individual displacements in times of cholera support this assumption. Mobility patterns are described by a layer of nodal connectivity (Fig. 2D and Materials and Methods). With suitable spatial resolution, human settlements may be placed at nodes of the hydrological network (Fig. S2), and edges are measured by the distances connecting them (SI Materials and Methods). We assume that susceptible and infected individuals engage in short-term trips from the communities where they live toward other settlements. While traveling or commuting, susceptible individuals can be exposed to pathogens and return as infected carriers to their settlement (10, 20). Similarly, infected hosts can disseminate the disease away from their home community—in many cases infected individuals are asymptomatic and thus are not barred from their usual activities. Connectivity structures and fluxes of human mobility have long been studied in epidemiology (33, 34), often on the basis of gravity-like models where the flux between two communities owing to human mobility is proportional to the product of the respective populations and decays with the distance separating them (10, 20, 35). Our choice of a model of this kind (SI Materials and Methods) is indirectly supported by a recent empirical study (28) that tracked daily Haitian average movements through mobile phones to determine likely new areas for cholera outbreaks far from the site where the disease was first detected. The study proves that outbound travels from the source area are frequent and most of the country received persons from the affected area whereas the vast majority of individuals leaving the source area traveled to just a few large recipients that include surrounding communal sections.
Fig. 2.

(A) Color-coded digital terrain elevation map (DTM) of Haiti; (B) the subdivision of Haitian territory in hydrological units (subbasins) extracted from the DTM, as a result of the convergence of several geomorphological criteria (SI Materials and Methods); (C) spatial distribution of population density obtained by LandScan remote sensing, which is translated into a geo-referenced spatial distribution of nodes  endowed with population
  (SI Materials and Methods); (D) A relevant subset of the network of human mobility, here portrayed synthetically by the four largest outbound connections for each node.
We have also comparatively tested other disease transmission mechanisms. The revised models considered in particular enhanced community-wide transmission due to a hyperinfectious V. cholerae state (freshly shed cholera pathogens requiring much lower concentrations to cause infection) (9, 10, 29, 36, 37). Latent stages and human-to-human transmission have been ruled out as discussed in SI Materials and Methods. Other cofactors of disease transmission, judged of lesser importance, are also discussed in SI Materials and Methods.
Parameter calibration is performed via Markov chain Monte Carlo techniques (38, 39) (SI Materials and Methods). To compare the ability of different models (with different added complexity and parameters) to reproduce the spatiotemporal epidemic patterns observed in Haiti, we have ranked the performances of different candidate models according to Akaike's information criterion (AIC) (40). AIC is a model-selection procedure that explicitly takes into account the trade-off between model accuracy and complexity. The ranking is based on AIC scores that measure the goodness of fit, discounting for the different number of calibration parameters (SI Materials and Methods). We specifically tested four candidate models: (i) a simple model with no pathogen hyperinfectivity and a single water compartment (SI Materials and Methods), (ii) the same model with pathogen hyperinfectivity, (iii) a model with two water compartments (water reservoir and sewage system) but no hyperinfectivity, and (iv) the same as in iii but including vibrio hyperinfectivity. AIC scores are in Table S1. The optimal model is fully described in Materials and Methods. According to the results of model identification, bursts of infections can be best explained by accounting for larger concentrations in the water compartment due to massive pathogen loads brought by hydrologic washout. AIC not retaining the modeling of hyperinfective stages of the V. cholerae bacterium may be surprising given its importance in other approaches. Our result would confirm earlier remarks (41) suggesting that the timescale of hyperinfectivity is so short that all that matters for modeling purposes would be the overall rate of transmission resulting from the many mechanisms that underlie it, especially given the complexity of the spatial linkages. This result cannot be generalized, however, as discussed in SI Materials and Methods.
Fig. 3 shows the results of the best-ranking model and its estimation uncertainty. Optimal parameters and their credible intervals are reported in Table S2. The model can better reproduce the timing and the magnitude of the epidemic in the 10 Haitian departments (Fig. S4), including the seasonal June–July resurgence, in particular in the most populated and affected regions (Artibonite and Ouest). The capabilities of describing the spatial and temporal patterns of the reported infections grew considerably with the information gained after the early predictions, although the short-term prognostic value of the early model (7) remains noteworthy. Thus, different levels of model sophistication might serve well for evolving insight into the course of an ongoing epidemic. In particular, the model including rainfall drivers and waning immunity allows us to draw predictions for long-term cholera dynamics in Haiti: Fig. 4 shows a multiseason projection up to January 2014, obtained by using suitable rainfall field predictions (SI Materials and Methods). We have chosen to run the example with an average duration of the acquired immunity of 3 y (it must be noted, however, that in such cases model-guided field studies on the rate of loss of acquired immunity become crucial). The related predictions are fairly consistent in suggesting significant Fall bursts of infections, stemming from seasonal rainfall and from the timing of the replenishment of the pool of susceptibles from previous infections due to immunity waning. The underestimation of the predicted infections in the late Fall of 2011 (for which data are now available) is likely explained by the fact that rainfall patterns projected from the end of September missed the extreme rainfall events that actually occurred in the first decade of October. Note finally that this is a worst-case scenario that assumes no improvement in sanitation and ignores any decrease in exposure upon learning from past experience.
Fig. 3.

Simulated evolution of the Haiti epidemic cholera from October 2010 to September 2011 by the revised complete model that includes bursts of infections caused by pathogen loads brought into the water reservoir by hydrologic washout. The final choice follows from the ranking of the performances of different candidate models according to Akaike's information criterion (40). (Upper) Weekly cumulated reported cases are visualized as the sum of the reported cases in each department (gray bars), fitted by the simulation of the revised model at the department level (blue solid line). The performance of the model at the department level is also shown (blue solid lines). (Inset) Haitian departments are listed as follows: 1, Nord-Ouest; 2, Nord; 3, Nord-Est; 4, Artibonite; 5, Centre; 6, Grand-Anse; 7, Nippes; 8, Ouest; 9, Sud; and 10, Sud-Est. (Lower) Evolution of reported new weekly cases (gray bars) along with the simulated incidence pattern of the revised model (solid line). Error bars highlight the range of uncertainty due to parameter estimation (described in detail in SI Materials and Methods). See also animation Movie S1.
Fig. 4.

Multiseasonal evolution of Haiti epidemic cholera (from October 2010 to January 2014) simulated by the best-performing model. Reported new weekly cases (gray bars) are shown along with the simulated incidence pattern (solid line). (Upper) Rainfall is predicted starting from October 1, 2011. The range of uncertainty due to the uncertainty in rainfall forecast (SI Materials and Methods) is highlighted by the shading. Red dots highlight cases reported after September and not used for calibration. Note the agreement between the epidemic fading in the data and the model projection, with the exception of an unpredicted infections peak in the late Fall of 2011. This exception is likely explained by the extreme rainfall events that occurred in the first decade of October that were missed by the rainfall patterns projected from the end of September.
Discussion
The encouraging outcomes of early predictions of the 2010–2011 Haiti cholera outbreak and the broadened capabilities of a generalized approach based also on later observations have been highlighted. Despite their capabilities, several limitations and open issues remain toward a general predictive model of epidemic cholera.
One important limitation for long-term predictions is our relatively poor knowledge of community-wide loss rates of acquired immunity (here characterized by a deterministic rate parameter ρ) (Materials and Methods). Susceptibles decrease because of infections and mortality and increase through the loss of immunity of recovered cases. The dynamics of recovered individuals play a crucial role in the long run. Although at short timescales it is reasonable to assume complete immunity of recovered patients, waning or boosting of acquired immunities at longer times may have a substantial impact on epidemic dynamics. Acquired immune responses may vary in relation to age group, V. cholerae strain (e.g., serogroup, biotype, and serotype) (42), the severity of the contracted infection (43), and endemic vs. epidemic cholera (44). On a population level, the buildup of durable immunity usually results in a lengthening of the interepidemic intervals. However, complex cyclic climatic forcings may control interarrivals of cholera outbreaks. Unfortunately, cholera elicits only a temporary immunity (44) whose uncertainty affects the long-term replenishment of the pool of susceptibles. Thus, the fraction of the population susceptible to the disease at the onset of subsequent outbreaks will likely be predictable only with great uncertainty. Worst-case scenarios (i.e., assuming again the entire Haitian population being susceptible) seem too crude an approximation for predicting a meaningful deployment of suitable medical supplies and staff.
In a similar vein, the minimalist assumption of a constant ratio of asymptomatic to symptomatic infections during the course of the epidemic, to which modeling results prove quite sensitive (32), is clearly an approximation. Extended epidemiological evidence and relatedly improved modeling are needed. Also, individuals with blood group O are more prone to severe cholera symptoms than other blood group individuals, although the mechanism underlying this association is still under debate (45, 46). Hence, the distribution of blood groups among the population might need to be considered where significant differences emerge. Besides blood group, moreover, the susceptibility to cholera depends on local intestinal immunity (from previous exposure or vaccination), bacterial load and intrinsic host factors such as stomach pH (gastric acid provides a barrier) (47) whose community-wide evaluations are difficult. One further issue concerns the modeling of the rapid patient discharge from treatment centers. Infected patients are released when fewer than three watery stools over the past 6 h are observed. This action is reasonable, given the need for space in emergency hospitals, but poses the problem that released patients are treated as recovered. However, they still excrete significant quantities of vibrios and thus contribute to enhanced spread of the disease, a process that is not accounted for in any of the proposed models. Although backtracking the mobility of early discharges seems possible on the basis of treatment center acceptance data, a large-scale application seems impractical. A related issue concerns the actual sanitation within treatment centers, e.g., the isolation of their latrines from the local water cycle especially during acute phases of the epidemic. From a modeling viewpoint, all this information is currently combined into calibration parameters at the loss of predictive power.
Another issue concerns the proper depletion of the pool of susceptibles due to intervention strategies. In this context, two main interventions have been discussed: vaccination and the extended use of antibiotics (48, 49). Whereas the idea of mass vaccination in Haiti has split experts (13), the impact of parameter uncertainty on the effects of vaccinations is certainly in need of an assessment. A more uniform opinion concerns the use of antibiotics. With respect to the latter, the World Health Organization generally recommends the administration of antibiotics only to severe cases of cholera (50). However, soon after the onset of the cholera epidemic in Haiti, many researchers demanded a widening of these regulations toward an extended use of antibiotics (49, 51). In favor of a broader use of antibiotics to all hospitalized cases, regardless of the severity of the symptoms, is the shorter duration of the acute phase and the reduced shedding of V. cholerae bacteria into the environment (52). The new policies therefore recommend also treating moderately ill patients with antibiotics (53). Significant differences in the use of antibiotics existed among treatment centers. The most extreme examples were health partners who used antibiotics in a prophylactic manner to protect family/community members affiliated with cholera patients (54). The most common antibiotic used in Haiti is a single dose of doxycycline, which proved very effective for cholera treatment (55). However, drastic increases of doxycycline/tetracycline-resistant isolates were recently reported, referring to a cholera outbreak in Zambia (56) where a clear correlation was observed between the development of resistant strains and large-scale use of antibiotics (either for treatment or for prophylaxis) (56). In fact, many drug-resistant strains of V. cholerae have been described within recent years due to the spread of antibiotic resistance genes by horizontal gene transfer (HGT) (for recent review see ref. 57). That antibiotics themselves, as well as signals within V. cholerae's environmental niche, induce diverse mechanisms of HGT (58–61) strengthens the fear of the development of antibiotic resistance in Haiti. It is therefore crucial to monitor the resistance pattern of the circulating V. cholerae strains. Regardless of deeper questions about possible development of specific resistance by the bacterial strains, we note that only very detailed information—possibly beyond reach—about clinical practice in space and time would allow us to better frame the related parameters of the transmission model (Materials and Methods).
In conclusion, weak sanitary infrastructures and favorable environmental conditions will likely lead to indefinite persistence of the pathogen within Haiti, suggesting that cholera will continue to be a threat for many years. Thus, we deem it significant that reliable predictions of epidemic cholera within Haiti could be offered by spatially explicit quantitative disease transmission models. Such models could thus be effectively used in the very course of an outbreak to allocate healthcare resources. To some extent, and with greater uncertainty, they could also possibly evaluate alternative strategies of emergency management. Although deeper integration of epidemiological, socioeconomical, and environmental data is needed to clarify issues still open, and despite differences in methods that can be tested through model-guided field validation, mathematical modeling of large-scale outbreaks emerges as an essential component of the control of future cholera epidemics and of modern epidemiology.
Materials and Methods
We describe in what follows only the best-ranked model according to the AIC (see SI Materials and Methods for a detailed description of all candidate models). Let  ,
,  , and
, and  be the local abundances of susceptible, infected, and recovered individuals in each node
  of the river network at time
  , and let
  be the concentrations of V. cholerae in the water reservoir. We consider
  metacommunities (
 ) spatially distributed within a given domain that embeds the hydrologic and the human mobility networks. Epidemiological dynamics and pathogen transport can be described by the following set of coupled differential equations:
 |
 |
 |
 |
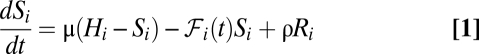
The evolution of the susceptible compartment (Eq. 1) is a balance between population demography and infections due to contact with pathogens infesting the water reservoir. The host population is assumed to be at a demographic equilibrium, where μ is the human mortality rate and  is the size of the local community. The total contact rate
  accounts for both local (first-term) and mobility-related (second-term) disease transmission. The parameter β represents the rate of exposure to contaminated water (possibly varying in time and/or space to account for heterogeneous sanitation conditions and related control strategies) (7), whereas
  is the probability of becoming infected due to the exposure to a concentration
  of vibrios, with
  being the half-saturation constant (62). Human mobility patterns are defined according to a connection matrix in which individuals leave their original node (say
  ) with a probability
  , reach their target location (say
  ) with a probability
  , and then come back to node
  . Here, we have opted for a gravity-like model of connections
  that decays exponentially with nodal distance; i.e.,
 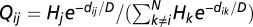 , where
  is the (shortest-path) distance between nodes
  and
and  , and
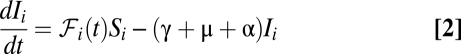
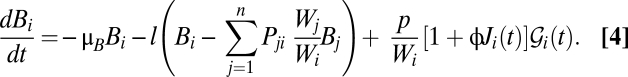
, and  is the deterrence cutoff distance. The dynamics of the infected compartment (Eq. 2) are a balance between newly infected individuals and losses due to recovery and natural/pathogen-induced mortality. Infected individuals recover at a rate γ or die of natural or cholera-induced mortality at a rate μ or α, respectively. The dynamics of recovered individuals are considered here (Eq. 3), because usually waterborne diseases confer just temporary immunity (25). The parameter ρ quantifies the loss of acquired immunity and the related replenishment of the susceptible compartment. Infected individuals contribute to the concentration of free-living vibrios in the water reservoir at a rate
  , where
  is the contamination rate and
  (with
(with  ) (7, 19) is the volume of water in the reservoir. To account for both local and mobility-related pathogen dispersion, here we actually consider the total infective pool
  ; i.e.,
  . To address the seasonal revamping of infections, we assume that the baseline contamination rate can be increased by local rainfall intensities
  via a runoff coefficient ϕ (SI Materials and Methods). We further assume that the vibrios diluted in the water reservoir undergo hydrological dispersal at rate
  . The spread of pathogens over the river network is described as a biased random walk process on an oriented graph in which pathogens move from node
  to node
  of the hydrological network with probability
  (18, 63). The transport process is assumed to be conservative, i.e.,
  , except for the network outlets where absorbing boundary conditions are imposed. Finally, the bacteria in the water reservoir are assumed to die at a constant rate μB. As initial conditions, we impose that, as of October 18, 2010 (
 ), we have
  except for the nodes
  where
where  is given, matching the reported cases as detailed in ref. 6. Also,
  for all nodes
  , and
, and  is in equilibrium with the local number of infected cases; i.e.,
  . Several model parameters can be estimated from the literature (Table S2). Five parameters are obtained through calibration of contrasting model simulations with the reported cumulative cases in each Haitian department as recorded in the epidemiological dataset (SI Materials and Methods). These parameters are the ratio
  , the hydrological dispersal rate
  , the human mobility rate
  , the average deterrence distance
  , and the contamination parameter ϕ (SI Materials and Methods).
Supplementary Material
Acknowledgments
The authors thank Benoit Renollet (Fondation Terre des Hommes Lausanne), Ellen Rymshaw and Cécile Bassi Foulon (Médecins sans Frontières), and Claire-Lise Chaignat and Peter Graaff (World Health Organization) for fact-finding and key support to the field work in Haiti. The authors also thank M. Parlange, D. Trono, Julien Biermann (for dedicated project work), and the Direction du Développement et de la Coopération Suisse program for logistic support in Haiti. A.R., E.B., L.M., and L.R. acknowledge support provided by the European Research Council (ERC) Grant RINEC-227612 and by Swiss National Science Foundation (SNF/FNS) Project 200021_124930/1. M.G. and A.R. acknowledge support from the SFN/FNS Project IZK0Z2_139537/1 for international cooperation. I.R.-I. acknowledges support from the James S. McDonnell Foundation through Studying Complex Systems Grant 220020138.
Footnotes
The authors declare no conflict of interest.
This article contains supporting information online at www.pnas.org/lookup/suppl/doi:10.1073/pnas.1203333109/-/DCSupplemental.
References
- 1.Pan American Health Organization Haiti cholera outbreak data. 2011. Available at http://new.paho.org/hq/images/Atlas_IHR/CholeraHispaniola/atlas.html. Accessed December 10, 2011.
- 2.Butler D. Cholera tightens grip on Haiti. Nature. 2010;468:483–484. doi: 10.1038/468483a. [DOI] [PubMed] [Google Scholar]
- 3.Walton DA, Ivers LC. Responding to cholera in post-earthquake Haiti. N Engl J Med. 2011;364:3–5. doi: 10.1056/NEJMp1012997. [DOI] [PubMed] [Google Scholar]
- 4.Sack DA. How many cholera deaths can be averted in Haiti? Lancet. 2011;377:1214–1216. doi: 10.1016/S0140-6736(11)60356-5. [DOI] [PubMed] [Google Scholar]
- 5.Friedrich MJ. Haiti cholera outbreak. JAMA. 2011;305:2402. [Google Scholar]
- 6.Piarroux R, et al. Understanding the cholera epidemic, Haiti. Emerg Infect Dis. 2011;17:1161–1168. doi: 10.3201/eid1707.110059. [DOI] [PMC free article] [PubMed] [Google Scholar]
- 7.Bertuzzo E, et al. Prediction of the spatial evolution and effects of control measures for the unfolding Haiti cholera outbreak. Geophys Res Lett. 2011;38:L06403. [Google Scholar]
- 8.Tuite A, et al. Cholera epidemic in Haiti, 2010: Using a transmission model to explain spatial spread of disease and identify optimal control interventions. Ann Intern Med. 2011;154:593–601. doi: 10.7326/0003-4819-154-9-201105030-00334. [DOI] [PubMed] [Google Scholar]
- 9.Andrews JR, Basu S. Transmission dynamics and control of cholera in Haiti: An epidemic model. Lancet. 2011;377:1248–1255. doi: 10.1016/S0140-6736(11)60273-0. [DOI] [PMC free article] [PubMed] [Google Scholar]
- 10.Chao DL, Halloran ME, Longini IM., Jr Vaccination strategies for epidemic cholera in Haiti with implications for the developing world. Proc Natl Acad Sci USA. 2011;108:7081–7085. doi: 10.1073/pnas.1102149108. [DOI] [PMC free article] [PubMed] [Google Scholar]
- 11.Clark J, et al. Ecological forecasts: An emerging imperative. Science. 2001;293:657–660. doi: 10.1126/science.293.5530.657. [DOI] [PubMed] [Google Scholar]
- 12.Chaignat C, et al. Cholera in disasters: Do vaccines prompt new hopes? Expert Rev Vaccines. 2008;7:431–435. doi: 10.1586/14760584.7.4.431. [DOI] [PubMed] [Google Scholar]
- 13.Cyranoski D. Cholera vaccine plan splits experts. Nature. 2011;469:273–274. doi: 10.1038/469273a. [DOI] [PubMed] [Google Scholar]
- 14.Ackers M, et al. Are there national risk factors for epidemic cholera? The correlation between socioeconomic and demographic indices and cholera incidence in Latin America. Int J Epidemiol. 1998;27:330–334. doi: 10.1093/ije/27.2.330. [DOI] [PubMed] [Google Scholar]
- 15.Anonymous The Lancet Infectious Diseases As cholera returns to Haiti, blame is unhelpful. Lancet Infect Dis. 2010;10:813. doi: 10.1016/S1473-3099(10)70265-6. [DOI] [PubMed] [Google Scholar]
- 16.Chin C, et al. The origin of the Haitian cholera outbreak strain. N Engl J Med. 2011;364:33–42. doi: 10.1056/NEJMoa1012928. [DOI] [PMC free article] [PubMed] [Google Scholar]
- 17.Hendriksen R, et al. Population genetics of Vibrio cholerae from Nepal in 2010: Evidence on the origin of the Haitian outbreak. MBio. 2011;2:e00157–11. doi: 10.1128/mBio.00157-11. [DOI] [PMC free article] [PubMed] [Google Scholar]
- 18.Bertuzzo E, et al. On the space-time evolution of a cholera epidemic. Water Resour Res. 2008;44:W01424. [Google Scholar]
- 19.Bertuzzo E, et al. On spatially explicit models of cholera epidemics. J R Soc Interface. 2010;7:321–333. doi: 10.1098/rsif.2009.0204. [DOI] [PMC free article] [PubMed] [Google Scholar]
- 20.Mari L, et al. Modelling cholera epidemics: The role of waterways, human mobility and sanitation. J. R. Soc. Interface. 2012;9:376–388. doi: 10.1098/rsif.2011.0304. [DOI] [PMC free article] [PubMed] [Google Scholar]
- 21.Huq A, et al. Coexistence of V. cholerae O1 and O139 Bengal in plankton in Bangladesh. Lancet. 1995;345:1249. doi: 10.1016/s0140-6736(95)92038-2. [DOI] [PubMed] [Google Scholar]
- 22.Colwell RR. Global climate and infectious disease: The cholera paradigm. Science. 1996;274:2025–2031. doi: 10.1126/science.274.5295.2025. [DOI] [PubMed] [Google Scholar]
- 23.Pascual M, Rodó X, Ellner SP, Colwell R, Bouma MJ. Cholera dynamics and El Ninõ southern oscillation. Science. 2000;289:1766–1769. doi: 10.1126/science.289.5485.1766. [DOI] [PubMed] [Google Scholar]
- 24.Pascual M, Bouma MJ, Dobson AP. Cholera and climate: Revisiting the quantitative evidence. Microbes Infect. 2002;4:237–245. doi: 10.1016/s1286-4579(01)01533-7. [DOI] [PubMed] [Google Scholar]
- 25.Koelle K, Rodó X, Pascual M, Yunus M, Mostafa G. Refractory periods and climate forcing in cholera dynamics. Nature. 2005;436:696–700. doi: 10.1038/nature03820. [DOI] [PubMed] [Google Scholar]
- 26.Pascual M, Chaves LF, Cash B, Rodó X, Yunus M. Predicting endemic cholera: The role of climate variability and disease dynamics. Research. 2008;36:131–140. [Google Scholar]
- 27.Cash D, et al. Disentangling the impact of ENSO and Indian ocean variability on the regional climate of Bangladesh: Implications for cholera risk. J Clim. 2010;23:2817–2831. [Google Scholar]
- 28.Bengtsson L, et al. Improved response to disasters and outbreaks by tracking population movements with mobile phone network data: A post-earthquake geospatial study in Haiti. PLoS Med. 2011;8:e1001083. doi: 10.1371/journal.pmed.1001083. [DOI] [PMC free article] [PubMed] [Google Scholar]
- 29.King AA, Ionides EL, Pascual M, Bouma MJ. Inapparent infections and cholera dynamics. Nature. 2008;454:877–880. doi: 10.1038/nature07084. [DOI] [PubMed] [Google Scholar]
- 30.Longini IM, Jr, et al. Controlling endemic cholera with oral vaccines. PLoS Med. 2007;4:e336. doi: 10.1371/journal.pmed.0040336. [DOI] [PMC free article] [PubMed] [Google Scholar]
- 31.Weil A, et al. Clinical outcomes in household contacts of patients with cholera in Bangladesh. Clin Infect Dis. 2009;49:1473–1479. doi: 10.1086/644779. [DOI] [PMC free article] [PubMed] [Google Scholar]
- 32.Rinaldo A, et al. A transmission model of the 2010 cholera epidemic in Haiti. Ann Intern Med. 2011;155:403–404. doi: 10.7326/0003-4819-155-6-201109200-00018. [DOI] [PubMed] [Google Scholar]
- 33.Eubank S, et al. Modelling disease outbreaks in realistic urban social networks. Nature. 2004;429:180–184. doi: 10.1038/nature02541. [DOI] [PubMed] [Google Scholar]
- 34.Riley S. Large-scale spatial-transmission models of infectious disease. Science. 2007;316:1298–1301. doi: 10.1126/science.1134695. [DOI] [PubMed] [Google Scholar]
- 35.Erlander S, Stewart NF. The Gravity Model in Transportation Analysis – Theory and Extensions. Zeist, The Netherlands: VSP Books; 1990. [Google Scholar]
- 36.Merrell DS, et al. Host-induced epidemic spread of the cholera bacterium. Nature. 2002;417:642–645. doi: 10.1038/nature00778. [DOI] [PMC free article] [PubMed] [Google Scholar]
- 37.Hartley DM, Morris JG, Smith DL. Hyperinfectivity: A critical element in the ability of Vibrio cholerae to cause epidemics? PLoS Med. 2006;3:63–69. doi: 10.1371/journal.pmed.0030007. [DOI] [PMC free article] [PubMed] [Google Scholar]
- 38.Vrugt JA, Robinson BA. Improved evolutionary optimization from genetically adaptive multimethod search. Proc Natl Acad Sci USA. 2007;104:708–711. doi: 10.1073/pnas.0610471104. [DOI] [PMC free article] [PubMed] [Google Scholar]
- 39.ter Braak CJF, Vrugt JA. Differential evolution Markov chain with snooker updater and fewer chains. Stat Comput. 2008;18:435–446. [Google Scholar]
- 40.Akaike H. A new look at the statistical model identification. IEEE Trans Automat Contr. 1974;19:716–723. [Google Scholar]
- 41.Pascual M, Koelle K, Dobson AP. Hyperinfectivity in cholera: A new mechanism for an old epidemiological model? PLoS Med. 2006;3:e280. doi: 10.1371/journal.pmed.0030280. [DOI] [PMC free article] [PubMed] [Google Scholar]
- 42.Ali M, et al. Natural cholera infection-derived immunity in an endemic setting. J Infect Dis. 2011;204:912–918. doi: 10.1093/infdis/jir416. [DOI] [PMC free article] [PubMed] [Google Scholar]
- 43.Cash R, et al. Response of man to infection with Vibrio cholerae. 1. Clinical, serologic and bacteriologic responses to a known inoculum. J Infect Dis. 1974;129:45–52. doi: 10.1093/infdis/129.1.45. [DOI] [PubMed] [Google Scholar]
- 44.Longini I, et al. Epidemic and endemic cholera trends over a 33-year period in Bangladesh. J Infect Dis. 2002;186:246–251. doi: 10.1086/341206. [DOI] [PubMed] [Google Scholar]
- 45.Chaudhuri A, De S. Cholera and blood-groups. Lancet. 1977;2:404. doi: 10.1016/s0140-6736(77)90332-4. [DOI] [PubMed] [Google Scholar]
- 46.Harris J, et al. Blood group, immunity, and risk of infection with Vibrio cholerae in an area of endemicity. Infect Immun. 2005;73:7422–7427. doi: 10.1128/IAI.73.11.7422-7427.2005. [DOI] [PMC free article] [PubMed] [Google Scholar]
- 47.Sack DA, Sack RB, Nair GB, Siddique AK. Cholera. Lancet. 2004;363:223–233. doi: 10.1016/s0140-6736(03)15328-7. [DOI] [PubMed] [Google Scholar]
- 48.Ivers LC, Farmer P, Almazor CP, Léandre F. Five complementary interventions to slow cholera: Haiti. Lancet. 2010;376:2048–2051. doi: 10.1016/S0140-6736(10)62243-X. [DOI] [PubMed] [Google Scholar]
- 49.Farmer P, al Meeting cholera's challenge to Haiti and the world: A joint statement on cholera prevention and care. PLoS Negl Trop Dis. 2011;5:e1145. doi: 10.1371/journal.pntd.0001145. [DOI] [PMC free article] [PubMed] [Google Scholar]
- 50.WHO Fact sheet N.107 – August 2011. Technical report (World Health Organization, Regional Office for the Eastern Mediterranean) 2011. Available at http://www.who.int/mediacentre/factsheets/fs107/en/index.html. Accessed November 1, 2011.
- 51.Nelson EJ, Nelson DS, Salam MA, Sack DA. Antibiotics for both moderate and severe cholera. N Engl J Med. 2011;364:5–7. doi: 10.1056/NEJMp1013771. [DOI] [PubMed] [Google Scholar]
- 52.Harris J, et al. Cholera's western front. Lancet. 2010;376:1961–1965. doi: 10.1016/S0140-6736(10)62172-1. [DOI] [PMC free article] [PubMed] [Google Scholar]
- 53.Centers for Disease Control and Prevention Defeating cholera: Clinical presentation and management for Haiti cholera outbreak. Technical report. 2010. Available at http://www.cdc.gov/haiticholera/clinicalmanagement/pdf/clinicalmanagement.pdf. Accessed November 1, 2011.
- 54.Ministère de la Santé Publique et de la Population (MSPP) and the Regional Office of the World Health Organization for the Americas (PAHO) (2011) Cholera and post-earthquake response in Haiti. Health Cluster Bulletin 17, Friday, February 4, Technical report. Available at http://new.paho.org/blogs/haiti/?p=1770. Accessed November 1, 2011.
- 55.Sack DA, Islam S, Rabbani H, Islam A. Single-dose doxycycline for cholera. Antimicrob Agents Chemother. 1978;14:462–464. doi: 10.1128/aac.14.3.462. [DOI] [PMC free article] [PubMed] [Google Scholar]
- 56.Mwansa J, et al. Multiply antibiotic-resistant Vibrio cholerae O1 biotype El Tor strains emerge during cholera outbreaks in Zambia. Epidemiol Infect. 2007;135:847–853. doi: 10.1017/S0950268806007254. [DOI] [PMC free article] [PubMed] [Google Scholar]
- 57.Kitaoka M, Miyata ST, Unterweger D, Pukatzki S. Antibiotic resistance mechanisms of Vibrio cholerae. J Med Microbiol. 2011;60:397–407. doi: 10.1099/jmm.0.023051-0. [DOI] [PubMed] [Google Scholar]
- 58.Beaber JW, Hochhut B, Waldor MK. SOS response promotes horizontal dissemination of antibiotic resistance genes. Nature. 2004;427:72–74. doi: 10.1038/nature02241. [DOI] [PubMed] [Google Scholar]
- 59.Guerin E, et al. The SOS response controls integron recombination. Science. 2009;324:1034. doi: 10.1126/science.1172914. [DOI] [PubMed] [Google Scholar]
- 60.Meibom KL, Blokesch M, Dolganov NA, Wu CY, Schoolnik GK. Chitin induces natural competence in Vibrio cholerae. Science. 2005;310:1824–1827. doi: 10.1126/science.1120096. [DOI] [PubMed] [Google Scholar]
- 61.Suckow G, Seitz P, Blokesch M. Quorum sensing contributes to natural transformation of Vibrio cholerae in a species-specific manner. J Bacteriol. 2011;193:4914–4924. doi: 10.1128/JB.05396-11. [DOI] [PMC free article] [PubMed] [Google Scholar]
- 62.Codeço CT. Endemic and epidemic dynamics of cholera: The role of the aquatic reservoir. BMC Infect Dis. 2001;1:1. doi: 10.1186/1471-2334-1-1. [DOI] [PMC free article] [PubMed] [Google Scholar]
- 63.Bertuzzo E, Maritan A, Gatto M, Rodriguez-Iturbe I, Rinaldo A. River networks and ecological corridors: Reactive transport on fractals, migration fronts, hydrochory. Water Resour Res. 2007;43:W04419. [Google Scholar]
Associated Data
This section collects any data citations, data availability statements, or supplementary materials included in this article.