

Background: 2-Amino-9H-pyrido[2,3-b]indole (AαC) is a carcinogen formed in tobacco smoke, but little is known about its metabolism in humans.
Results: UDP-Glucuronosyltransferases catalyze the binding of N-oxidized-AαC to DNA.
Conclusion: Glucuronidation, normally a detoxication pathway, contributes to the genotoxicity of AαC.
Significance: The exposure to and UGT bioactivation of AαC provides a biochemical mechanism for the elevated risk of liver and digestive tract cancers in smokers.
Keywords: Mass Spectrometry (MS), Metabolism, Nuclear Magnetic Resonance, UDP-glucuronosyltransferase, Xenobiotics, Heterocyclic Aromatic Amine, Tobacco Carcinogen
Abstract
2-Amino-9H-pyrido[2,3-b]indole (AαC) is a carcinogenic heterocyclic aromatic amine (HAA) that arises in tobacco smoke. UDP-glucuronosyltransferases (UGTs) are important enzymes that detoxicate many procarcinogens, including HAAs. UGTs compete with P450 enzymes, which bioactivate HAAs by N-hydroxylation of the exocyclic amine group; the resultant N-hydroxy-HAA metabolites form covalent adducts with DNA. We have characterized the UGT-catalyzed metabolic products of AαC and the genotoxic metabolite 2-hydroxyamino-9H-pyrido[2,3-b]indole (HONH-AαC) formed with human liver microsomes, recombinant human UGT isoforms, and human hepatocytes. The structures of the metabolites were elucidated by 1H NMR and mass spectrometry. AαC and HONH-AαC underwent glucuronidation by UGTs to form, respectively, N2-(β-d-glucosidurony1)-2-amino-9H-pyrido[2,3-b]indole (AαC-N2-Gl) and N2-(β-d-glucosidurony1)-2-hydroxyamino-9H-pyrido[2,3-b]indole (AαC-HON2-Gl). HONH-AαC also underwent glucuronidation to form a novel O-linked glucuronide conjugate, O-(β-d-glucosidurony1)-2-hydroxyamino-9H-pyrido[2,3-b]indole (AαC-HN2-O-Gl). AαC-HN2-O-Gl is a biologically reactive metabolite and binds to calf thymus DNA (pH 5.0 or 7.0) to form the N-(deoxyguanosin-8-yl)-AαC adduct at 20–50-fold higher levels than the adduct levels formed with HONH-AαC. Major UGT isoforms were examined for their capacity to metabolize AαC and HONH-AαC. UGT1A4 was the most catalytically efficient enzyme (Vmax/Km) at forming AαC-N2-Gl (0.67 μl·min−1·mg of protein−1), and UGT1A9 was most catalytically efficient at forming AαC-HN-O-Gl (77.1 μl·min−1·mg of protein−1), whereas UGT1A1 was most efficient at forming AαC-HON2-Gl (5.0 μl·min−1·mg of protein−1). Human hepatocytes produced AαC-N2-Gl and AαC-HN2-O-Gl in abundant quantities, but AαC-HON2-Gl was a minor product. Thus, UGTs, usually important enzymes in the detoxication of many procarcinogens, serve as a mechanism of bioactivation of HONH-AαC.
Introduction
Epidemiologic studies conducted over the past two decades have consistently shown that tobacco smoking is a risk factor for cancers of the gastrointestinal tract (1, 2). There is also mounting evidence that tobacco smoke is an independent risk factor for hepatocellular carcinoma, the predominant form of human liver cancer (3, 4). However, the causal agents of these cancers in tobacco smoke remain to be determined.
The heterocyclic aromatic amine (HAA),3 2-amino-9H-pyrido[2,3-b]indole (AαC), a pyrolysis product of protein (5), occurs in mainstream tobacco smoke at levels ranging from 60 to 258 ng/cigarette (6, 7). These amounts are 25–100-fold higher than those of the aromatic amine, 4-aminobiphenyl (4-ABP), a known human carcinogen that has been implicated in the pathogenesis of bladder cancer in smokers (8). Apart from the endocyclic nitrogen atoms, AαC has the same chemical structure as 2-aminofluorene (2-AF), perhaps the most well studied among the carcinogenic aromatic amines (Fig. 1) (9). AαC is a liver carcinogen in mice and both a potent lacI transgene colon mutagen and an inducer of aberrant crypt foci, early biomarkers of neoplasms, in the colon of mice (10–12). Thus, AαC may be a causal agent of liver and other digestive tract cancers in smokers.
FIGURE 1.

Chemical structures of AαC, 4-ABP, and 2-AF.
HAAs and structurally related arylamines undergo metabolic activation by N-hydroxylation of the exocyclic amine groups by cytochrome P450 enzymes. Phase II enzymes such as N-acetyltransferases, sulfotransferases, or ATP-dependent enzymes (13–15) catalyze the formation of unstable esters of the N-hydroxylated metabolites, which undergo heterolytic cleavage to produce the proposed reactive arylnitrenium ion that binds covalently to DNA (Scheme 1). UDP-glucuronsyltransferases (UGTs) catalyze the glucuronidation and elimination of numerous classes of xenobiotics, steroids, other endogenous compounds and are prominently involved in the detoxication of carcinogens (16, 17). The UGTs are present in the 1A, 2A, and 2B subfamilies and are expressed in liver and extrahepatic tissues (16, 18). The UGT isoforms catalyze the detoxication of aromatic amines, HAAs, and their N-hydroxylated metabolites by N-glucuronidation (17, 19–23) (Scheme 1).
SCHEME 1.

Metabolism of arylamines by P450, UGT, and other phase II enzymes.
The evaluation of the human health risk of AαC requires an understanding of the enzymes involved in bioactivation and detoxication of this procarcinogen; however, the metabolism of AαC has not been well studied in humans (24). Recombinant human cytochrome P450 1A2 catalyzes the N-oxidation of the exocyclic amine group of AαC to form 2-hydroxyamino-9H-pyrido[2,3-b]indole (HONH-AαC), a genotoxic metabolite (25). P450 1A2 also catalyzes the detoxication of AαC by ring oxidation of the C3 or C6 atoms of the heterocyclic ring (25, 26) followed by O-glucuronidation (27, 28). However, human hepatocytes efficiently bioactivate AαC to reactive metabolites that form DNA adducts (29). The propensity of AαC and structurally related compounds in tobacco smoke to undergo bioactivation by enzymes expressed in liver and extrahepatic tissues provides a biochemical mechanism for the elevated risk of liver and digestive cancers in smokers (25, 29–31).
In this study we have characterized the metabolic products of AαC and HONH-AαC that are formed by UGT enzymes present in human liver microsomes, recombinant human UGT1A and UGT2B isoforms, and freshly cultured human hepatocytes. We report a novel pathway of bioactivation of HONH-AαC where UGTs catalyze the formation an O-linked glucuronide conjugate, AαC-HN2-O-Gl, which binds covalently to DNA. Thus, UGT enzymes, normally viewed as a means of detoxication of many carcinogens, serves as a mechanism of bioactivation and likely transports of HON-AαC from liver to extrahepatic tissues.
EXPERIMENTAL PROCEDURES
Caution
AαC and several of its derivatives are potential human carcinogens and should be handled with caution in a well ventilated fume hood with the appropriate protective clothing.
Chemicals and Reagents
AαC was purchased from Toronto Research Chemicals (Toronto, ON, Canada). Uridine-5′-diphosphoglucuronic acid (UDPGA), alamethicin, and β-glucuronidase type IX-A from Escherichia coli were purchased from Sigma.
Human liver samples were from Tennessee Donor Services, Nashville, TN, and were kindly provided by Dr. F. P. Guengerich, Vanderbilt University. Recombinant human UGT expressed in baculovirus-infected insect cell baculosomes (UGT1A1, -1A3, -1A4, -1A6, -1A8, -1A9, and -1A10 and UGT2B7 were purchased from BD Biosciences. 2-Hydroxyamino-1-methyl-6-phenylimidazo-[4,5-b]pyridine (HONH-PhIP), 4-hydroxyaminobiphenyl (HONH-4-ABP), N-(deoxyguanosin-8-yl)-PhIP (dG-C8-PhIP), N-(deoxyguanosin-8-yl)-4-ABP (dG-C8–4-ABP), N-(deoxyguanosin-8-yl)-AαC (dG-C8-AαC), and their [13C10]dG isotopically labeled internal standards were synthesized as previously described (32–34).
General Methods
Mass spectra were acquired on a Finnigan Quantum Ultra triple stage quadrupole mass spectrometer (Thermo Fisher, San Jose, CA) with a Michrom Advance CaptiveSprayTM source (Auburn, CA). Typical instrument tuning parameters were as follows: capillary temperature, 200 °C; source spray voltage, 2 kV; tube lens offset, 95 V; capillary offset, 35 V; source fragmentation, 10 V. Argon, set at 1.5 millitorr, was used as the collision gas. There was no sheath or auxiliary gas. All analyses were conducted in the positive ionization mode. Metabolites were also characterized with the Thermo Fisher linear quadrupole ion trap mass spectrometer with the Advance CaptiveSprayTM ion source. The source voltage was 1.5 kV, the capillary voltage was 25 V, and the tube lens was 80 V. The isolation width was set at m/z 4 and 1, respectively, for the MS2 and MS3 scan modes, the activation Q was set at 0.35, and the activation time was 10 ms. Helium was used as the collision damping gas in the ion trap. One microscan was used for data acquisition. The automatic gain control settings were full MS target 30,000 and MSn target 10,000, and the maximum injection time was 10 ms.
NMR Studies
1H NMR resonance assignment experiments for the glucuronide metabolites of AαC and HNOH-AαC were conducted at 25 °C with a Bruker Avance III 600 MHz spectrometer equipped with a triple resonance cryoprobe (Bruker BioSpin Corp., Billerica, MA). The 1H chemical shifts were referenced directly from the DMSO-d6 multiplet at 2.56 ppm. A standard double quantum filtered COSY experiment was employed to collect 1024 t1 increments over a 7507-Hz spectral window. Standard rotating frame NOESY (ROESY) was employed using 400 ms mixing time. The 2-D NMR data were analyzed with the program SPARKY (University of California, San Francisco).
Synthesis of HONH-AαC and Biosynthesis of Glucuronide Conjugates of AαC and HNOH-AαC
HONH-AαC was synthesized by reduction of 2-nitro-9H-pyrido[2,3-b]indole as described (31). The glucuronide metabolites were prepared by incubating AαC or HONH-AαC (1 mg in 100 μl DMSO) with 5 mg of human liver microsomal protein in 5 ml of 100 mm Tris-HCl buffer (pH 7.5) containing 10 mm MgC12, 0.5 mm EDTA, and 5 mm UDPGA for 3 h at 37 °C. The microsomal mixture was preincubated with alamethicin (50 μg/mg protein) on ice for 30 min to overcome the latency phenomena associated with UGT enzymes before the addition of the AαC compounds. Ascorbic acid (2 mm) was added to the microsomal incubation containing NOH-AαC to minimize oxidation of the substrate. The reactions were terminated by the addition of 1 volume of ice-cold CH3OH, and the mixtures were placed on ice for 30 min. The precipitated proteins were removed by centrifugation.
UGT Glucuronidation and Enzyme Kinetics of AαC and HNOH-AαC with Recombinant UGT Isoforms
UGTs were diluted to a concentration of 0.5 mg protein/ml in 100 mm Tris-HCl buffer (pH 7.5) containing 10 mm MgC12, 0.5 mm EDTA, 2 mm UDPGA, and 25 μg of alamethicin per 0.5 mg of protein and incubated on ice for 30 min before the addition of AαC substrates. The reactions were conducted under an atmosphere of argon at 37 °C. Time-dependent studies with HONH-AαC (10 or 100 μm) showed that product formation was linear over 140 min (data not shown). Enzyme kinetics experiments were conducted with HNOH-AαC at various concentrations between 5 and 500 μm, and the concentrations of AαC ranged from 75 to 1500 μm. The time of incubation was 1 h. Aliquots (100 μl) were taken and added to 2 volumes of ice-cold CH3OH to terminate the reaction followed by centrifugation to remove protein. The methanolic extracts were analyzed by HPLC. The activities of UGT isoforms were assessed with β-estradiol (150 μm) as a substrate for UGTs 1A1 and 1A3, trifluoperazine (200 μm) as a substrate for UGT 1A4, and 7-hydroxy-4-trifluoromethylcoumarin (50 μm) as a substrate for UGTs 1A6, 1A8, 1A9, 1A10, and 2B7. The enzyme activities were in good agreement to those values provided by BD Biosciences.
HPLC Analysis of AαC- and HON-AαC-glucuronide Conjugates
Metabolites were analyzed with an Agilent model 1100 HPLC Chemstation (Palo Alto, CA) equipped with a photodiode array detector. The metabolites were separated with a Aquasil C18 column (4.6 × 150 mm, 5-μm particle size) from Thermo Scientific. The chromatography of the glucuronide conjugates of AαC began at 10 mm NH4CH3CO2 (pH 6.8) for 2 min followed by a linear gradient over 22 min to 100% CH3CN at a flow rate of 1 ml/min. The chromatography of the glucuronide conjugates of HNOH-AαC also commenced at 10 mm NH4CH3CO2 (pH 6.8) for 2 min followed by a linear gradient over 16 min to arrive at 40% CH3CN and reached 100% CH3CN at 25 min. The estimates of formation of glucuronide conjugates of AαC and HNOH-AαC were determined by integration of the peak monitored at 338 nm. We assumed that the molar extinction coefficients of the glucuronide conjugates were comparable with the molar extinction coefficient of AαC (21,560 ϵ (m−1 cm−1).
Kinetic Studies on AαC-N2-Gl, AαC-HON2-Gl, and AαC-HN2-O-Gl as Function of pH or by Treatment with β-Glucuronidase
The stabilities AαC- and HONH-AαC glucuronide conjugates were examined in 50 mm potassium phosphate buffer (pH 7.0) or 50 mm citric acid buffer (pH 5.0). The conjugates were also incubated with β-glucuronidase (240 units/ml) in 50 mm potassium phosphate buffer (pH 7.0). The compounds (4 μg, 10.7 nmol) were incubated under an atmosphere of argon at 37 °C for up to 3 h. The conjugates and hydrolysis products were assayed directly by HPLC except for studies with β-glucuronidase; the solution was diluted with 2 volumes of ice-cold CH3OH, and the protein was removed by centrifugation, prior HPLC (see above).
DNA Binding Studies with HONH-AαC, AαC-HON2-Gl, and AαC-HN2-O-Gl
Calf thymus DNA (0.6 mg/ml) was incubated with HONH-AαC (10 μg, 50 nmol), HONH-PhIP (11 μg, 46 nmol), or HONH-4-ABP (13 μg, 70 nmol) or AαC-HN2-O-Gl and AαC-HON2-Gl (6 μg, 16 nmol) in 1 ml of 50 mm potassium citrate buffer (pH 5.0) or 50 mm potassium phosphate buffer (pH 7.0). AαC-HN2-O-Gl and AαC-HO-N2-Gl were also incubated with DNA (0.6 mg/ml) and β-glucuronidase (240 units/ml) in 50 mm potassium buffer (pH 7.0). The DNA solutions were incubated at 37 °C for 2 h under an atmosphere of argon. The reactions were terminated by 3 solvent extractions with an equal volume of ethyl acetate, and the DNA samples were precipitated from solution by the addition of 0.1 volume of 5 m NaCl followed by 1.5 ml of C2H5OH. The DNA filament was washed with a C2H5OH:H2O mixture (7:3) and air-dried.
UGT-mediated Binding of HONH-AαC to DNA
Human liver microsomal protein (0.5 mg) in 0.5 ml of 100 mm Tris-HCl buffer (pH 7.5) containing salts, ascorbic acid, 5 mm UDPGA (see above), and calf thymus DNA (0.3 mg) was preincubated with alamethicin (25 μg/0.5 mg protein) on ice for 30 min followed by the addition 1-naphthol (0, 100 or 1000 μm) and then HONH-AαC (10 μm). The incubation proceeded at 37 °C for 30 min. The reaction was terminated by the addition of CaCl2 (50 mm final concentration) to precipitate the protein. After centrifugation, the supernatant was retrieved, and 0.1 volumes of 5 m NaCl and 2 volumes C2H5OH were added to precipitate DNA. The supernatants containing HONH-AαC glucuronide conjugates were measured by HPLC (see above). The pelleted DNA was washed with C2H5OH:H2O mixture (7:3) and digested enzymatically as described below.
Metabolism Studies of AαC with Human Hepatocytes
Human liver samples were obtained from patients undergoing liver resection for primary or secondary hepatomas through the Biological Resource Center (CHRU Pontchaillou, Rennes, France). The research protocol was conducted under French legal guidelines and fulfilled the requirements of the local institutional ethics committee. This study was approved by the Institutional Review Board at the Wadsworth Center. Hepatocytes were isolated by a two-step collagenase perfusion procedure, and parenchymal cells were seeded in Petri dishes at a density of 3 × 10⁶ viable cells/19.5-cm2 dish in 3 ml of Williams' modified medium before incubation with AαC (10 or 50 μm) as previously described (29). Metabolites and DNA were isolated from the cell extracts (29) and characterized by LC-ESI/MS (see below).
LC-ESI/MS/MS3 Measurements of DNA Adducts
DNA (5 μg) in 0.1 ml of 5 mm Bis-Tris-HCl buffer (pH 7.1) was spiked with 100 pg of internal standards ([13C10]dG-C8-AαC, ([13C10]dG-C8-PhIP, or ([13C10]dG-C8–4-ABP) or 1.5 adducts per 105 DNA bases. The DNA was subjected to enzymatic digestion as previously reported (33, 34). Analyses of adducts were performed with a NanoAcquityTM UPLC system (Waters Corp., Milford, MA) interfaced with a linear quadrupole ion trap mass spectrometer. A Waters Symmetry trap column (180 × 20 mm, 5 μm particle size) was employed for online solid phase enrichment of the DNA adducts. The analytical column was a C18 AQ (0.3 × 150-mm, 3-μm particle size) from Michrom Bioresources Inc. (Auburn, CA). The UPLC conditions have been reported (35). Adducts were measured at the MS3 scan stage which produced the aglycone adduct [BH2]+ (36). The ions were monitored at the MS3 scan stage by consecutive reaction monitoring: dG-C8-PhIP (m/z 490.1 > 374.1 >); [13C10]-dG-C8-PhIP (m/z 500.1 > 379.1 >); dG-C8-AαC (m/z 449.1 > 333.1 >); [13C10]-dG-C8-AαC (m/z 459.1 > 338.1 >); dG-C8–4-ABP (m/z 435.1 > 319.1 >); [13C10]-dG-C8–4-ABP (m/z 445.1 > 324.1 >). The total ions were measured at the MS3 scan stage. The normalized collision energies were set at 32 and 40, and the isolation widths were set at m/z 3.0 and 1.0, respectively, for the MS2 and MS3 scan stages. The source voltage was 2.5 kV, the capillary voltage was 25 V, and the tube lens voltages were 80 V. The activation Q was set at 0.35, and the activation time was 10 ms for both scan modes.
LC-ESI/MS/MS Analysis of AaC-glucuronide Metabolites in Human Hepatocytes
Cell extracts were assayed by LC-ESI/MS/MS with the TSQ Quantum Ultra triple stage quadrupole mass spectrometer in the selected reaction monitoring mode and employed the following transitions for the glucuronide conjugates of oxidized AαC: 376.1 > 183.1, 184.1, and 200.1, with a collision energy of 35 eV. The sample preparation, chromatographic conditions, and MS tuning parameters were previously described (29).
Data Analysis
GraphPad Prism 5 software (La Jolla, CA) was employed to calculate enzyme kinetic values. Apparent Km and Vmax values for glucuronidation by each enzyme were derived from the Michaelis-Menten equation,
or by the substrate inhibition equation,
where v is the initial velocity, Vmax is the maximum enzyme velocity (pmol·min−1·mg−1 protein), Km is the Michaelis constant, [S] is the initial substrate concentration, Ksi is the dissociation constant for the substrate from the enzyme inhibitor complex. Catalytic efficiency (Vmax/Km) was expressed as μl·min−1·mg of protein−1. The data were fitted using nonlinear regression employing the least squares to obtain the best curve.
RESULTS
Glucuronide Metabolites of AαC and HONH-AαC Produced by Human Liver Microsomes
The HPLC profile of glucuronide conjugates of AαC and HONH-AαC produced by human liver microsomes under elevated substrate concentrations (1 mm) is shown in Fig. 2. One major glucuronide conjugate was formed with AαC (tR 9.4). The online UV spectrum of the metabolite displayed a chromophore that was very similar to the spectrum of AαC, suggesting the metabolite was AαC-N2-Gl. Two glucuronide conjugates were formed with HONH-AαC (tR 14.9 and 15.8 min). The UV spectra of both conjugates strongly resembled the UV spectrum of HONH-AαC. The ratio of the peak area between the conjugates was about 2.4:1.
FIGURE 2.

HPLC profiles and online UV spectra of glucuronide metabolites of AαC and HONH-AαC produced by human liver microsomes, glucuronide metabolite of AαC (A) and glucuronide metabolites of HONH-AαC (B). Different gradient conditions were employed for the resolution of the metabolites, as described under “Experimental Procedures”.
1H NMR Spectroscopy of Glucuronide Conjugates of AαC and HONH-AαC
The glucuronide conjugate of AαC (120 μg) and the major (210 μg) and minor (80 μg) conjugates of HONH-AαC were produced in sufficient quantities to analyze by 1H NMR spectrometry (Figs. 3–5). The chemical shift values for the metabolites are summarized in Table 1.
FIGURE 3.

Shown are one (1-D)- and two-dimensional (2-D) 1H NMR spectra of the major glucuronide metabolite of AαC (in DMSO-d6) recorded on a Bruker Avance III 600-MHz spectrometer; the one-dimensional 1H NMR spectrum (top panel, 11. 78–4.52 ppm) shows the NH9, aromatic protons of AαC moiety and H1′ proton of the glucuronide moiety. The two-dimensional ROESY contour plot (middle panel) shows NOE connectivities between protons through distance coupling around the NH9, the aromatic proton region, and the aliphatic region situated around the H1′ of the glucuronic acid. The portions of the two-dimensional COSY spectrum (bottom panel) focused on the protons having coupling through chemical bonds on the moiety of AαC. Note: x is an impurity.
FIGURE 4.

One (1-D)- and two-dimensional (2-D) 1H NMR (ROESY and COSY) spectra of the major glucuronide metabolite of HONH-AαC (in DMSO-d6) recorded on a Bruker Avance III 600 MHz spectrometer; the one-dimensional 1H NMR spectrum (top panel, 11.78–3.5 ppm) shows the NH9, aromatic protons of AαC moiety, and H1′, H2′ proton of the glucuronide moiety. The two-dimensional ROESY contour plot (middle panel) shows NOE connectivities between protons through distance coupling around the NH9, the aromatic proton region, and the aliphatic region situated around the H1′ of the glucuronic acid. The portions of the two-dimensional COSY spectrum (bottom panel) focused on the protons having coupling through chemical bonds on the moiety of AαC.
FIGURE 5.

One (1-D)- and two-dimensional (2-D) NMR (ROESY and COSY) spectra of the minor glucuronide metabolite of HONH-AαC (in DMSO-d6) recorded on a Bruker Avance III 600 MHz spectrometer; the one-dimensional 1H NMR spectra (top panel, 11. 78–3.15 ppm) show the aromatic protons of AαC moiety and H1′,H2′ protons of the glucuronide moiety before and after the addition of D2O. The small amount of D2O served to dilute and shift the resonances of the exchangeable protons. Previous to the addition of D2O, the contour plot of a two-dimensional ROESY spectrum (middle panel) showed NOE connectivities between protons through distance coupling around the NH9, the aromatic proton region, and the aliphatic region situated around the H1′ of the glucuronic acid. The observe dimension is oriented along the y axis of this plot to take advantage of the stronger intensity of the NH-9-H8 cross-peak along this dimension. The portions of the two-dimensional COSY spectrum (bottom panel) focused on the protons having coupling through chemical bonds on the moiety of AαC. Note: x is an impurity.
TABLE 1.
NMR Chemical shift data (ppm) for glucuronide conjugates of AαC and HONH-AαC
| Proton assignment | AαC | AαC-HN2-Gl | AαC-HON2-Gl | AαC-HN2-O-Gl |
|---|---|---|---|---|
| H3 | 6.37 | 6.48 (d, J = 8.3; 1.0)a | 7.02 (d, J = 8.4, 1.0) | 7.09 (d, J = 8.4; 1.0) |
| H4 | 8.07 | 8.15 (d, J = 8.3; 1.0) | 8.33 (d, J = 8.4; 1.0) | 8.37 (d, J = 8.4; 1.0) |
| H5 | 7.85 | 7.89 (d, J = 7.7; 1.0) | 7.98 (d, J = 7.7; 1.0) | 8.02 (d, J = 7.8; 1.0) |
| H6 | 7.11 | 7.13 (t; 1.0) | 7.17 (t; 1.0) | 7.20 (t; 1.0) |
| H7 | 7.23 | 7.25 (t; 1.0) | 7.32 (t; 1.0) | 7.35 (t; 1.0) |
| H8 | 7.36 | 7.36 (d, J = 8.0; 1.0) | 7.40 (d, J = 8.1; 1.0) | 7.44 (d, J = 7.9; 1.0) |
| NH9 | 11.12 | 11.37 (s; 1.0) | 11.46 (s; 1.0) | 11.61 (s; 1.0) |
| H1′ | 5.09 (m; 1.0) | 5.64 (d, J = 8.6; 1.0) | 4.58 (d, J = 7.7, 1.0) | |
| H2′ | 3.24 (m)b | 3.71 (m; 1.0) | 3.28 (m)b | |
| NH2 | 6.09 | |||
| N2-H | 7.18 (d, J = 8.8; 1.0) |
a The protons were determined by 1-D as s (singlet), d (doublet), t (triplet) or m (multiplet) with an area integration at one proton (H4 was established as the reference for integration). J, J-coupling constant (unit: Hz) for doublet. The chemical shifts were reported in the average number.
b Those protons were determined by 2-D COSY as multiplet.
All of the protons of the heterocyclic ring and the endocyclic N-9 atom were observed in the 1H NMR spectrum of the glucuronide conjugate of AαC. The resonance signal at 7.18 ppm had the intensity of one proton and occurred as a doublet (J = 8.8 Hz). This signal was assigned as the N2-H. It is coupled to the anomeric proton (H-1′) of the glucuronide moeity at 5.09 ppm, seen as a “triplet” due to the addition to the passive coupling with the glucuronide H-2′ proton (Fig. 3). There is also an NOE connectivity between this resonance at 7.18 ppm and the H-3 of the heterocyclic ring. The analogous NOE connectivity is observed in the parental AaC analysis. This conjugate also exhibits an NOE connectivity between H-1′ of the glucuronic acid and the H-3 proton of the heterocyclic ring. These results provide spectral data to assign this glucuronide conjugate as AαC-N2-Gl.
All of the protons of the heterocyclic ring and the endocyclic N9 atom were observed in the 1H NMR spectra of the two glucuronide conjugates of HONH-AαC (Figs. 4 and 5). A clear NOE signal was also observed in the NOESY spectra for the protons attached to the N9 atom and the H8 protons of both conjugates. These spectral data exclude the N9 atom as site of conjugation with glucuronic acid. The NOESY spectra also showed NOE signals between the H3 protons of HONH-AαC and the H1′ of the glucuronic acid moieties of both conjugates. These observed NOE connectivities support the proposed sites of conjugation at the exocyclic N2- or N2-O atoms and not at the more distant N1 pyridinyl nitrogen atom. The similarities among the UV chromophores of both conjugates and HONH-AαC (Fig. 2) also favor the assignment of the glucuronide conjugation at the exocyclic N2 or N2-O atoms. The minor glucuronide product of HONH-AαC displayed a pronounced up-field shift in the resonance signal of the H1′ glucuronide at 4.58 ppm in comparison to the H1′ resonance signal of the major conjugate, which was situated at 5.64 ppm. The resonance signals of the H1′ glucuronide proton for O-glucuronide conjugates of several hydroxylamine metabolites occur at 4.5–4.7 ppm (37–40), whereas the resonance signals of the H1′ glucuronide proton of N-glucuronide conjugates of N-hydroxylated HAA metabolites are situated above 5.0 ppm (41, 42). The spectral data suggest that AαC-HON2-Gl is the more abundant glucuronide conjugate and that AαC-HN2-O-Gl is the minor conjugate. However, the 1H NMR spectra do not permit unequivocal assignment of the structures. The identities of these isomeric metabolites were distinguished by ESI/MS/MSn.
ESI/MS/MSn Product Ion Spectra of Glucuronide Conjugates of AαC and HONH-AαC
The product ion spectra of the glucuronide conjugates were acquired in the negative ionization mode. The product ion spectrum of AαC-N2-Gl ([M-H]− at m/z 358.1), shown in Fig. 6A, displays fragment ions at m/z 296.0 ([M-H-H2O-CO2]− and m/z 278.0 ([M-H-2H2O-CO2]−). The proposed negatively charged acetyl derivative of AαC at m/z 224.2 [M-H-C4H6O5]− and the deprotonated AαC at m/z 182.1 [M-H-C6H8O6]− were also observed.
FIGURE 6.

ESI product ion spectra of AαC glucuronide conjugates acquired in the negative ion mode by ion trap mass spectrometry. A, AαC-N2-Gl. B, AαC-HON2-Gl. C, AαC-HN2-O-Gl. D, second generation product ion spectrum of AαC-HN2-O-Gl acquired on m/z 193. Proposed mechanisms of formation of prominent fragment ions are presented.
The product ion spectrum of AαC-HON2-Gl, [M-H]− at m/z 374.1 is shown in Fig. 6B. Prominent ions are observed at m/z 282.1 [M-H-C2H4O4]− attributed to deprotonated HONH-AαC containing the C1-C4 atoms of glucuronic acid and at m/z 222.1 [M-H-C5H8O6]− attributed to deprotonated HONH-AαC containing the C1 and C2 atoms of glucuronic acid (Fig. 6B). The fragment ion at m/z 198 [M-H-C6H8O6]− is attributed to the negatively charged HONH-AαC, which occurred by cleavage of the glucuronide linkage, and the ion at m/z 182.0 [M-H-C6H8O7]− is attributed to the loss of oxygen from HONH-AαC.
The product ion spectrum of AαC-HN2-O-Gl, [M-H]− at m/z 374.1, is shown in Fig. 6C. One predominant ion was observed at m/z 193 [M-H-C11H7N3]− and is proposed to occur by cleavage of the N2-O bond of HONH-AαC, with the oxygen atom remaining attached to the C1 atom of the glucuronate. The second generation product ion spectrum of AαC-HN2-O-Gl acquired on m/z 193 shows the typical collision-induced dissociation fragmentation pattern previously reported for the glucuronate (Fig. 6D) (43) and proves that the linkage formed between HONH-AαC and glucuronic acid occurred at the oxygen atom of HONH-AαC. The product ion spectra of O-glucuronide conjugates of arylhydroxamic acids typically display a prominent ion at m/z 193, attributed to the glucuronate, in the negative ion mode (44).
Glucuronidation of AαC and HONH-AαC with Recombinant Human UGTs
Recombinant human UGT isoforms 1A1, 1A3, 1A4, 1A6, 1A8, 1A9, 1A10, and 2B7 were screened for their capacities to catalyze AαC-N2-Gl, AαC-HON2-Gl, and AαC-HN2-O-Gl formation. UGT1A4 was the only isoform that showed detectable N2-glucuronidation activity for AαC (93.4 ± 1.5 pmol·min−1·mg of protein−1) and only under elevated substrate concentrations (Km = 2060 μm). HONH-AαC underwent N2- or O-glucuronidation by UGT 1A1, 1A4, 1A9, and 2B7 but with different specificities in product formation (supplemental Table 1S). AαC-HON2-Gl was the predominant conjugate formed with UGT2B7, whereas AαC-HN2-O-Gl was the major conjugate produced by UGTs 1A1 and 1A9. UGT1A4 catalyzed the formation AαC-HON2-Gl but did not form AαC-HN2-O-Gl. UGTs 1A1, 1A9, and 2B7 produced both AαC-HON2-Gl and AαC-HN2-O-Gl. The activity observed for UGT1A8 was below the level of metabolite detection by HPLC (<7 pmol · min−1 · mg of protein−1).
Steady-state Enzyme Kinetic Parameters of AαC-N2-Gl, AαC-HON2-Gl, and AαC-HN2-O-Gl Formation
The steady-state enzyme kinetic parameters were determined for UGTs 1A1, 1A4, 1A9, and 2B. The data are summarized in Table 2, and the non-linear regression Michaelis-Menten curves are provided in supplemental Fig. 1S. In the case of UGT1A4, very high concentrations of AαC and HONH-AαC (Km values > 1000 μm for both substrates) were required to observe product formation. Therefore, the apparent Vmax and Km values for AαC-N2-Gl and AαC-HON2-Gl formation were estimated by non-linear regression at concentrations of substrates below the Km values. UGT 1A1 displayed the highest rate of catalysis of AαC-HN2-O-Gl formation (Vmax = 575 pmol·min−1·mg of protein−1, Km = 21.4 μm); however, UGT 1A9 displayed the lowest apparent Km (Km = 0.7 μm), and it was the most catalytically efficient UGT isoform in producing AαC-HN2-O-Gl (77.1 μl·min−1·mg of protein−1). Moreover, an atypical substrate inhibition was observed for UGT1A9; the rate of formation of AαC-HN2-O-Gl, but not the rate of formation of AαC-HON2-Gl, was diminished when the initial substrate concentration of HONH-AαC exceeded 20 μm. The diminution in activity may be attributed to the binding of HONH-AαC or AαC-HN2-O-Gl with the enzyme-UDP complex, leading to a nonproductive dead-end complex that slows the catalytic cycle (45). The substrate inhibition effect may not be relevant in vivo given that the exposure to AαC via tobacco smoke or cooked meat is on the order of several μg per day. On the basis of the enzyme kinetic data, we expect the formation of AαC-HN2-O-Gl to be greater than that of AαC-HON2-Gl under the low substrate concentrations of AαC that occur in vivo. The preferred formation of AαC-HN2-O-Gl over AαC-HON2-Gl is supported by studies with human hepatocytes that are described below.
TABLE 2.
Steady-state enzyme kinetic parameters for glucuronidation of AαC and HONH-AαC by recombinant UGT isoforms
| Substrate | Glucuronide | UGT isoforma | Vmax | Km | Vmax/Km |
|---|---|---|---|---|---|
| pmol · min−1 · mg−1protein | μm | μl · min−1 · mg−1protein | |||
| HONH-AαC | AαC-HON2-Gl | UGT1A1 | 248 ± 14.5 | 49.8 ± 7.9 | 4.99 |
| UGT1A4b | 3960 ± 606 | 1140 ± 227 | 3.48 | ||
| UGT1A9 | 15.0 ± 1.8 | 6.3 ± 4.5 | 2.37 | ||
| UGT2B7 | 447 ± 60.9 | 173 ± 43.2 | 2.58 | ||
| AαC-HN2-O-Gl | UGT1A1 | 575 ± 33.7 | 21.4 ± 4.4 | 26.9 | |
| UGT1A9c | 57.5 ± 3.5 | 0.7 ± 0.6 | 77.1 | ||
| UGT2B7 | 60.5 ± 5.9 | 78.4 ± 18.5 | 0.77 | ||
| AαC | AαC-N2-Gl | UGT1A4c | 1390 ± 170 | 2060 ± 379 | 0.67 |
a The glucuronidation activity (unit: pmol · min−1 · mg−1 protein) was examined for all UGT isoforms using recommended methods provided by BD Biosciences. Estradiol was a substrate for UGTs 1A1 (750) and 1A3 (150); 7-hydroxy-4-trifluoromethylcoumarin was a substrate for UGTs 1A10 (128), 1A8 (388), 2B7 (780), 1A6 (6700), and 1A9 (7000); trifluoperazine was a substrate for UGT1A4 (820). There was no detectable glucuronidation activity of either AαC or HONH-AαC for UGTs 1A3, 1A6, and 1A10. UGT1A8 displayed low glucuronidation activity of HONH-AαC (<7 pmol · min−1 · mg−1 protein). Only UGT1A4 displayed activity for N2-glucuronidation of AαC.
b Kinetic constants could not be determined with confidence because of the high substrate concentrations required for analysis.
c Substrate inhibition was observed, Ksi = 255 ± 58 μm.
Kinetic Studies on AαC-N2-Gl AαC-HON2-Gl and AαC-HN2-O-Gl as Function of pH or by Treatment with β-Glucuronidase
The stabilities of AαC-N2-Gl, AαC-HO-N2-Gl, and AαC-HN2-O-Gl were determined in potassium citrate buffer (pH 5.0) and potassium phosphate buffer (pH 7.0) (supplemental Fig. 2S). AαC-N2-Gl underwent hydrolysis to form AαC. The half-life (t½) of AαC-N2-Gl was estimated at 72 min (pH 5.0) and 58 h (pH 7.0). AαC-HON2-Gl slowly underwent hydrolysis to form HONH-AαC. The t½ was 5.7 h at pH 5.0 and 100 h at pH 7.0. AαC-HN2-O-Gl underwent hydrolysis to form AαC; there was no evidence for the formation of HONH-AαC, NO2-AαC, or azoxy products by HPLC analysis (data not shown). The t½ of AαC-HN2-O-Gl was 6.8 h at pH 5.0 and 19 h at pH 7.0. The hydrolysis of AαC-HN2-O-Gl to yield AαC demonstrates that the N2-O linkage is labile and that AαC-HN2-O-Gl may undergo nucleophilic substitution reactions with DNA or protein (20).
AαC-HN2-O-Gl was a substrate for β-glucuronidase (E. coli). The sole, initial product formed was HONH-AαC (56 pmol·min−1·unit−1 β-glucuronidase, t½ = 2 min) in 50 mm potassium phosphate buffer (pH 7.0), whereas the rates of hydrolysis of AαC-N2-Gl and AαC-HO-N2-Gl were considerably slower (≤93 fmol·min−1·unit−1 β-glucuronidase, t½ not determined) (supplemental Fig. 2S). The differences in rates of enzymatic hydrolysis of these AαC conjugates are consistent with the known fact that O-glucuronide conjugates are superior substrates to N-glucuronide conjugates for β-glucuronidase (E. coli) (46).
Reactivity of HONH-AαC, AαC-HON2-Gl, and AαC-HN2-O-Gl with Calf Thymus DNA
The reactivity of HONH-AαC and its glucuronide conjugates to DNA under different pH conditions was compared with the DNA binding of the N-hydroxy derivative of 4-ABP, a tobacco carcinogen (8), and the N-hydroxy derivative of 2-amino-1-methyl-6-phenylimidazo[4,5-b]pyridine (PhIP), a carcinogen formed in cooked meat (12). The amounts of the dG-C8-AαC, dG-C8–4-ABP, and dG-C8-PhIP adducts formed by these reactive metabolites were determined by LC-ESI/MS/MS3 (29). The mass chromatograms are shown in supplemental Figs. 3S and 4S. The highest level of DNA binding occurred for HONH-4-ABP followed by HONH-AαC and lastly by HONH-PhIP under acidic (pH 5.0) and neutral (pH 7.0) pH conditions (Fig. 7). The reactivity of HONH-4-ABP with DNA was about 25-fold greater under acidic pH than neutral pH conditions, whereas the acidic pH increased the level of HONH-AαC DNA adduct formation by 10-fold and by 5-fold for HONH-PhIP. The enhanced reactivity of arylhydroxylamines with DNA under acidic pH conditions has been ascribed to the formation of the arylnitrenium ion (47).
FIGURE 7.

Reactivity of HONH-AαC, AαC-HON2-Gl, AαC-HN2-O-Gl, HONH-4-ABP, and HONH-PhIP with calf thymus DNA at pH 5. 0 or 7.0 to form dG-C8 adducts. The reactivity of AαC-HON2-Gl, AαC-HN2-O-Gl with calf thymus DNA was also investigated at pH 7.0 in the presence of β-glucuronidase. Data are the average ± S.D. of 3 independent measurements.
AαC-HN2-O-Gl reacted with DNA (pH 7.0) to form the dG-C8-AαC adduct at levels that were ∼50-fold higher than the adduct levels formed by the reaction of HONH-AαC or AαC-HON2-Gl with DNA. The O-glucuronide linkage of AαC-HN2-O-Gl was critical for dG-C8-AαC formation, and the addition of β-glucuronidase to the reaction mixture diminished the level of dG-C8-AαC formation by ∼50-fold. Moreover, the binding of AαC-HN2-O-Gl to DNA at pH 5.0 was still 3.5-fold greater than the level of DNA binding of HONH-AαC. It is worthy to note that AαC-HO-N2-Gl also reacted with DNA at pH 5.0 and formed an appreciable level of adducts. The acidic pH results in hydrolysis of AαC-HON2-Gl to form reactive HONH-AαC.
UGT-mediated Binding of HONH-AαC to DNA
UGT isoforms expressed in human liver microsomes produced AαC-HON2-Gl and AαC-HN2-O-Gl and catalyzed the binding of HONH-AαC to calf thymus DNA (Fig. 8, A and B). The presence of 1-naphthol, a substrate for multiple UGTs (18), in the incubation medium led to dose-dependent decreases in AαC-HN2-O-Gl and AαC-HON2-Gl and dG-C8-AαC adduct formation. These findings show that UGTs catalyze the binding of HONH-AαC to DNA.
FIGURE 8.
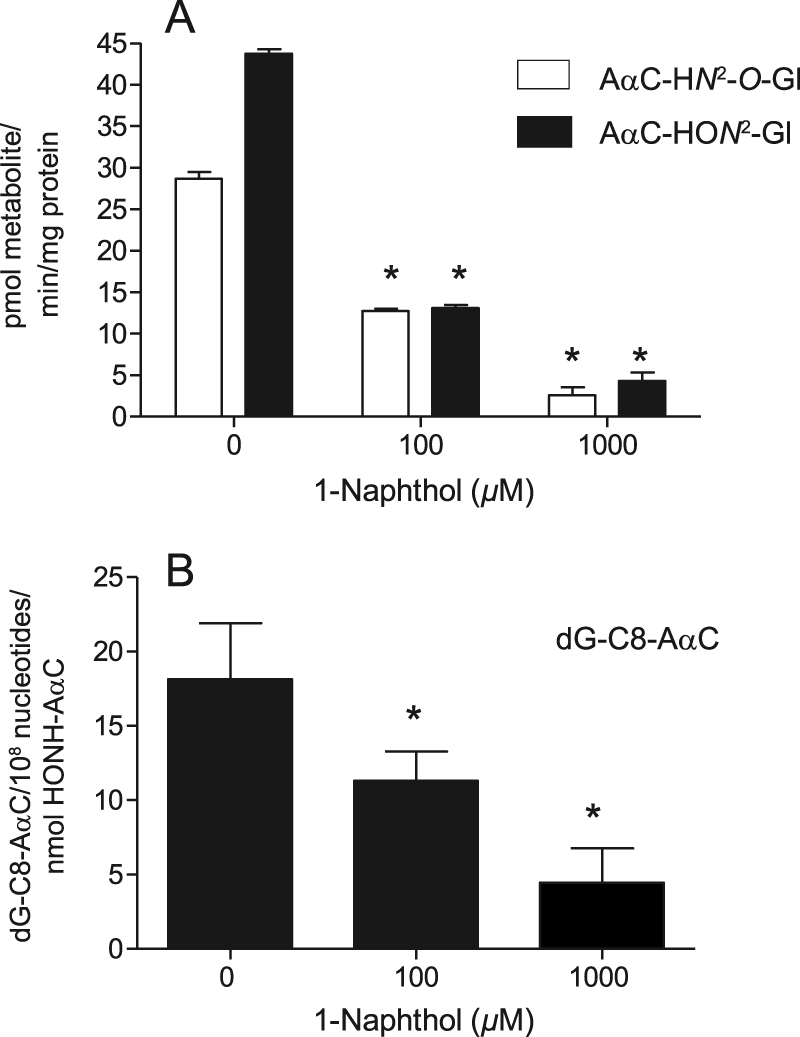
UGT-mediated bioactivation of HONH-AαC by human liver microsomes fortified with UDPGA and calf thymus DNA without or with 1-naphthol (0, 100, or 1000 μm). A, AαC-HON2-Gl and AαC-HN2-O-Gl formation is shown. B, dG-C8-AαC adduct formation is shown. One-way analysis of variance showed statistical significance for both metabolism and DNA adduct formation (p = 0.001). *, Dunnett's multiple comparison test showed statistical significance (p < 0.01 for 0 versus 100 μm and 0 versus 1000 μm) for both AαC-HON2-Gl and AαC-HN2-O-Gl formation and dG-C8-AαC DNA adduct formation. Data are the average ± S.D. of three independent measurements.
AαC-N2-Gl, AαC-HON2-Gl, and AαC-HN2-O-Gl Formation in Human Hepatocytes
We have shown that AαC undergoes extensive metabolism and forms DNA adducts at high levels in hepatocytes (29). In this study we have characterized several glucuronide conjugates of AαC produced in hepatocytes. The product ion spectra of AαC-HON2-Gl and AαC-HN2O-Gl formed in hepatocytes are shown in supplemental Fig. 5S. The 1H NMR of the P450-ring-oxidized metabolites of AαC, 2-amino-3-hydroxy-9H-pyrido[2,3-b]indole (3-HO-AαC), and 2-amino-6-hydroxy-9H-pyrido[2,3-b]indole (6-HO-AαC) and their UV and mass spectral data and those of their O-glucuronide conjugates formed in human hepatocytes are presented supplemental Figs. 6S and 7S. The mass chromatograms of AαC-HO-N2-Gl, AαC-HN2-O-Gl, and the O-glucuronide conjugates of 3-HO-AαC and 6-HO-AαC are shown in Fig. 9A. Prominent peaks attributed to AαC-HN2-O-Gl, 2-amino-3-(β-d-glucosiduronyloxy)-9H-pyrido[2,3-b]indole (AαC-O3-Gl), and 2-amino-6-(β-d-glucosiduronyloxy)-9H-pyrido[2,3-b]indole (AαC-O6-Gl) are readily observed, whereas only trace levels of AαC-HON2-Gl are formed in hepatocytes exposed to AαC (10 μm). Similar findings were obtained with hepatocytes from two other donors (data not shown). The formation of the AαC-O3-Gl and AαC-O6-Gl metabolites progressed during the 24-h incubation period (10 or 50 μm AαC). AαC-N2-Gl formation also increased with time, occurring at levels comparable with the ring-oxidized conjugates (data not shown). AαC-HON2-Gl was primarily detected in hepatocytes treated with AαC (50 μm), and metabolite formation continued over 24 h. However, the biosynthesis of AαC-HN2-O-Gl peaked at 3 h and then dramatically declined at 24 h for both concentrations of AαC (Fig. 9, B and C). These findings show that O-glucuronidation is a principal pathway of conjugation of HONH-AαC under low exposure conditions to AαC (Fig. 9, A). We surmise that a portion of AαC-HN2O-Gl reacts with DNA and possibly protein.
FIGURE 9.

A, Shown are mass chromatograms of AαC-HON2-Gl, AαC-HN2-O-Gl, AαC-O3-Gl, and the AαC-O6-Gl in human hepatocytes incubated with AαC (10 μm) for 3 h. Levels of N-oxidized and ring-oxidized glucuronide conjugates of AαC formed as a function of time in human hepatocytes treated with 10 μm AαC (B) or 50 μm AαC (C).
DISCUSSION
The N-glucuronidation of HAAs, aromatic amines, and their genotoxic N-hydroxylated metabolites by UGTs is an important mechanism of detoxication of these structurally related chemicals. The UGT enzyme pathways compete with P450 and phase II enzyme pathways, which bioactivate these procarcinogens (Scheme 1) (17, 19–21, 23).
To date, the direct O-glucuronidation of carcinogenic N-hydroxy-HAAs or arylhydroxylamines by UGTs (14, 17, 20, 47, 48) has not been reported. The formation of AαC-HN2-O-Gl by human UGTs is the first example of the occurrence of an O-glucuronide conjugate from this group of structurally related carcinogens. AαC-HN2-O-Gl is a biologically reactive metabolite that binds to DNA (Fig. 7). Moreover, the binding of HONH-AαC to DNA is catalyzed by UGTs present in human liver microsomes (Fig. 8).
The kinetic parameters of UGT enzymes were characterized to determine which isoforms catalyze this unique pathway of bioactivation of HONH-AαC. UGT1A9 is the most catalytically active isoform in O-glucuronidation of HONH-AαC (Table 2). UGT1A9 is also the principal UGT isoform involved in the O-linked glucuronidation of simple phenols (18) and a major isoform involved in the detoxication by N3-glucuronidation of HONH-PhIP, the genotoxic metabolite of the cooked meat carcinogen PhIP (21). UGT1A9 is present in human liver, colon, prostate, and breast among other tissues (16). Given the low Km (0.9 μm) value of UGT1A9-mediated AαC-HN2-O-Gl formation, we may expect that UGT1A9 catalyzes the O-glucurionidation of HONH-AαC and its binding to DNA in vivo.
O-Glucuronide conjugates of several arylhydroxamic acids are produced by UGT enzymes (20, 49), including the O-glucuronide conjugate of N-hydroxy-2-acetylaminofluorene, which was identified in urine of rats treated with 2-acetylaminofluorene (50). The metabolite was stable in urine, but it was labile in vitro under slightly alkaline pH. The investigators proposed that the N-acetyl group of the AAF moiety had migrated to a hydroxyl group of the glucuronic acid (20). The resulting O-glucuronide of 2-hydroxyaminofluorene underwent reaction with nucleophiles (Scheme 2). This metabolite may have contributed to 2-acetylaminofluorene-DNA adduct formation in vivo (13, 20). However, the O-glucuronide conjugate of 2-hydroxyaminofluorene or O-glucuronide conjugates of other arylhydroxylamines have not been detected in vivo probably because the conjugates are unstable in aqueous solution and decompose within several minutes (48).
SCHEME 2.

UGT-mediated bioactivation of the N-hydroxy metabolites of 2-acetylaminofluorene and AαC. Under slightly alkaline pH, the N-acetyl moiety of the O-glucuronide metabolite of HONH-AAF undergoes transacetylation to an hydroxyl group of the glucuronate. The resultant O-glucuronide conjugate, 2-AF-N2-O-Gl-Ac, is labile and reacts with DNA or protein (20). HONH-AαC undergoes direct O-glucuronidation, to form AαC-HN2-O-Gl, which forms covalent adducts with DNA and presumably proteins.
The stability of the O-glucuronide linkage of AαC-HN2-O-Gl is considerably greater than that of the O-glucuronide conjugate of 2-hydroxyaminofluorene. The half-life of AαC-HN2-O-Gl exceeds 6 h at pH 7.0, but AαC-HN2-O-Gl undergoes a facile nucleophilic displacement reaction with dG to form the dG-C8-AαC adduct. Electrophiles of intermediate reactivity have been viewed as the most genotoxic species because highly reactive electrophiles will react with weaker nucleophiles or undergo solvolysis with water before they can react with DNA (51). Thus, AαC-HN-O-Gl is an ideal genotoxic electrophile that can react with DNA.
UGTs play several different roles in the metabolism of AαC that impact its biological activity. N2-Glucuronidation of AαC leads to the formation of a detoxicated product. However, HONH-AαC can undergo either N2- or O-glucuronidation. The enzyme kinetic studies with recombinant human UGT isoforms and metabolism studies with human hepatocytes reveal that AαC-HN-O-Gl is the predominant glucuronide conjugate of HONH-AαC formed under low substrate concentrations (Fig. 9 and supplemental Table 1S). Moreover, because of its long half-life, AαC-HN-O-Gl is likely to be exported from liver to extrahepatic tissues, where it can react with DNA (Scheme 2). The role of UGTs in the genotoxicity of AαC, as opposed to N-acetyltransferase and sulfotransferase enzymes that are normally associated with the bioactivation of HAAs (17), warrants further study.
Supplementary Material
Acknowledgment
We acknowledge the use of the Wadsworth NMR Core Facility.
This work was supported, in whole or in part, by National Institutes of Health Grants R01 CA122320 and R01 CA134700 (to R. J. T.). This work was also supported by INSERM, la Ligue contre le Cancer, the region Bretagne and Anses for financial aid (to G. N. and S. L.), and the College Doctoral International of the Université Européenne de Bretagne for a travel fellowship (to G. N.).

This article contains supplemental Table 1S and Figs. 1S–7S.
- HAA
- heterocyclic aromatic amine
- ESI
- electrospray ionization
- MSn
- multistage tandem mass spectrometry
- UGT
- UDP-glucuronosyltransferase
- UDPGA
- uridine diphosphoglucuronic acid
- 2-AF
- 2-aminofluorene
- 4-ABP
- 4-aminobiphenyl
- HONH-ABP
- 4-hydroxyaminobiphenyl
- AαC
- 2-amino-9H-pyrido[2,3-b]indole
- HONH-AαC
- 2-hydroxyamino-9H-pyrido[2,3-b]indole
- 3-HO-AαC
- 2-amino-3-hydroxy-9H-pyrido[2,3-b]indole
- 6-HO-AαC
- 2-amino-6-hydroxy-9H-pyrido[2,3-b]indole
- AαC-HN2-Gl
- N2-(β-d-glucosidurony1)-2-amino-9H-pyrido[2,3-b]indole
- AαC-HON2-Gl
- N2-(β-d-glucosidurony1)-2-hydroxyamino-9H-pyrido[2,3-b]indole
- AαC-HN2-O-Gl
- O-(β-d-glucosidurony1)-2-hydroxyamino-9H-pyrido[2,3-b]indole
- AαC-O3-Gl
- 2-amino-3-(β-d-glucosiduronyloxy)-2-amino-9H-pyrido[2,3-b]indole
- AαC-O6-Gl
- 2-amino-6-(β-d-glucosiduronyloxy)-9H-pyrido[2,3-b]indole
- PhIP
- 2-amino-1-methyl-6-phenylimidazo[4,5-b]pyridine
- HONH-PhIP
- 2-hydroxyamino-1-methyl-6-phenylimidazo[4,5-b]pyridine
- dG-C8–4-ABP
- N-(deoxyguanosin-8-yl)-4-ABP
- dG-C8-AαC
- N-(deoxyguanosin-8-yl)-AαC
- dG-C8-PhIP
- N-(deoxyguanosin-8-yl)-PhIP
- AαC-N2-Gl
- N2-(β-d-glucosidurony1)-2-amino-9H-pyrido[2,3-b]indole
- Bis-Tris
- 2-[bis(2-hydroxyethyl)amino]-2-(hydroxymethyl)propane-1,3-diol
- ROESY
- standard rotating frame NOESY.
REFERENCES
- 1. Giovannucci E. (2001) An updated review of the epidemiological evidence that cigarette smoking increases risk of colorectal cancer. Cancer Epidemiol. Biomarkers Prev. 10, 725–731 [PubMed] [Google Scholar]
- 2. Lüchtenborg M., White K. K., Wilkens L., Kolonel L. N., Le Marchand L. (2007) Smoking and colorectal cancer. Different effects by type of cigarettes? Cancer Epidemiol. Biomarkers Prev. 16, 1341–1347 [DOI] [PubMed] [Google Scholar]
- 3. Lee Y. C., Cohet C., Yang Y. C., Stayner L., Hashibe M., Straif K. (2009) Meta-analysis of epidemiologic studies on cigarette smoking and liver cancer. Int. J. Epidemiol. 38, 1497–1511 [DOI] [PubMed] [Google Scholar]
- 4. Vineis P., Alavanja M., Buffler P., Fontham E., Franceschi S., Gao Y. T., Gupta P. C., Hackshaw A., Matos E., Samet J., Sitas F., Smith J., Stayner L., Straif K., Thun M. J., Wichmann H. E., Wu A. H., Zaridze D., Peto R., Doll R. (2004) Tobacco and cancer. Recent epidemiological evidence. J. Natl. Cancer Inst. 96, 99–106 [DOI] [PubMed] [Google Scholar]
- 5. Yoshida D., Matsumoto T., Yoshimura R., Matsuzaki T. (1978) Mutagenicity of amino-α-carbolines in pyrolysis products of soybean globulin. Biochem. Biophys. Res. Commun. 83, 915–920 [DOI] [PubMed] [Google Scholar]
- 6. Yoshida D., Matsumoto T. (1980) Amino-α-carbolines as mutagenic agents in cigarette smoke condensate. Cancer Lett. 10, 141–149 [DOI] [PubMed] [Google Scholar]
- 7. Smith C. J., Qian X., Zha Q., Moldoveanu S. C. (2004) Analysis of α- and β-carbolines in mainstream smoke of reference cigarettes by gas chromatography-mass spectrometry. J. Chromatogr. A 1046, 211–216 [DOI] [PubMed] [Google Scholar]
- 8. IARC Monographs on the Evaluation of Carcinogenic Risks to Humans. Tobacco Smoke and Involuntary Smoking (2004), pp. 1005–1187, International Agency for Research on Cancer, Lyon, France: [PMC free article] [PubMed] [Google Scholar]
- 9. Kriek E. (1992) Fifty years of research on N-acetyl-2-aminofluorene, one of the most versatile compounds in experimental cancer research. J. Cancer Res. Clin. Oncol. 118, 481–489 [DOI] [PMC free article] [PubMed] [Google Scholar]
- 10. Zhang X. B., Felton J. S., Tucker J. D., Urlando C., Heddle J. A. (1996) Intestinal mutagenicity of two carcinogenic food mutagens in transgenic mice. 2-Amino-1-methyl-6-phenylimidazo[4,5-b]pyridine and amino(α)carboline. Carcinogenesis 17, 2259–2265 [DOI] [PubMed] [Google Scholar]
- 11. Okonogi H., Ushijima T., Shimizu H., Sugimura T., Nagao M. (1997) Induction of aberrant crypt foci in C57BL/6N mice by 2-amino-9H-pyrido[2,3-b]indole (AαC) and 2-amino-3,8-dimethylimidazo[4,5-f]quinoxaline (MeIQx). Cancer Lett. 111, 105–109 [DOI] [PubMed] [Google Scholar]
- 12. Sugimura T., Wakabayashi K., Nakagama H., Nagao M. (2004) Heterocyclic amines. Mutagens/carcinogens produced during cooking of meat and fish. Cancer Sci. 95, 290–299 [DOI] [PMC free article] [PubMed] [Google Scholar]
- 13. Miller E. C. (1978) Some current perspectives on chemical carcinogenesis in humans and experimental animals. Presidential address. Cancer Res. 38, 1479–1496 [PubMed] [Google Scholar]
- 14. Kato R. (1986) Metabolic activation of mutagenic heterocyclic aromatic amines from protein pyrolysates. CRC Crit. Rev. Toxicol. 16, 307–348 [DOI] [PubMed] [Google Scholar]
- 15. Glatt H. (2006) in Acrylamide and Other Hazardous Compounds in Heat-Treated Foods (Skog K., Alexander J., eds), pp. 358–404, Woodhead Publishing Ltd., Cambridge, England [Google Scholar]
- 16. Nagar S., Remmel R. P. (2006) Uridine diphosphoglucuronosyltransferase pharmacogenetics and cancer. Oncogene 25, 1659–1672 [DOI] [PubMed] [Google Scholar]
- 17. Turesky R. J., Le Marchand L. (2011) Metabolism and biomarkers of heterocyclic aromatic amines in molecular epidemiology studies. Lessons learned from aromatic amines. Chem. Res. Toxicol. 24, 1169–1214 [DOI] [PMC free article] [PubMed] [Google Scholar]
- 18. Tukey R. H., Strassburg C. P. (2000) Human UDP-glucuronosyltransferases. Metabolism, expression, and disease. Annu. Rev. Pharmacol. Toxicol. 40, 581–616 [DOI] [PubMed] [Google Scholar]
- 19. Kadlubar F. F., Miller J. A., Miller E. C. (1977) Hepatic microsomal N-glucuronidation and nucleic acid binding of N-hydroxy arylamines in relation to urinary bladder carcinogenesis. Cancer Res. 37, 805–814 [PubMed] [Google Scholar]
- 20. Irving C. C. (1981) Glucuronide formation in the metabolism of N-substituted aryl compounds. Natl. Cancer Inst. Monogr. 58, 109–111 [PubMed] [Google Scholar]
- 21. Nowell S. A., Massengill J. S., Williams S., Radominska-Pandya A., Tephly T. R., Cheng Z., Strassburg C. P., Tukey R. H., MacLeod S. L., Lang N. P., Kadlubar F. F. (1999) Glucuronidation of 2-hydroxyamino-1-methyl-6-phenylimidazo[4,5-b]pyridine by human microsomal UDP-glucuronosyltransferases. Identification of specific UGT1A family isoforms involved. Carcinogenesis 20, 1107–1114 [DOI] [PubMed] [Google Scholar]
- 22. Zenser T. V., Lakshmi V. M., Hsu F. F., Davis B. B. (2002) Metabolism of N-acetylbenzidine and initiation of bladder cancer. Mutat. Res. 506–507, 29–40 [DOI] [PubMed] [Google Scholar]
- 23. Malfatti M. A., Felton J. S. (2004) Human UDP-glucuronosyltransferase 1A1 is the primary enzyme responsible for the N-glucuronidation of N-hydroxy-PhIP in vitro. Chem. Res. Toxicol. 17, 1137–1144 [DOI] [PubMed] [Google Scholar]
- 24. Frederiksen H. (2005) Two food-borne heterocyclic amines. Metabolism and DNA adduct formation of amino-α-carbolines. Mol. Nutr. Food Res. 49, 263–273 [DOI] [PubMed] [Google Scholar]
- 25. Raza H., King R. S., Squires R. B., Guengerich F. P., Miller D. W., Freeman J. P., Lang N. P., Kadlubar F. F. (1996) Metabolism of 2-amino-α-carboline. A food-borne heterocyclic amine mutagen and carcinogen by human and rodent liver microsomes and by human cytochrome P4501A2. Drug Metab. Dispos. 24, 395–400 [PubMed] [Google Scholar]
- 26. Frederiksen H., Frandsen H. (2003) Impact of five cytochrome p450 enzymes on the metabolism of two heterocyclic aromatic amines, 2-amino-9H-pyrido[2,3-b]indole (AαC) and 2-amino-3-methyl-9H-pyrido[2,3-b]indole (MeAαC). Pharmacol. Toxicol. 92, 246–248 [DOI] [PubMed] [Google Scholar]
- 27. Frederiksen H., Frandsen H. (2004) Excretion of metabolites in urine and feces from rats dosed with the heterocyclic amine, 2-amino-9H-pyrido[2,3-b]indole (AαC). Food Chem. Toxicol. 42, 879–885 [DOI] [PubMed] [Google Scholar]
- 28. Yuan Z. X., Jha G., McGregor M. A., King R. S. (2007) Metabolites of the carcinogen 2-amino-α-carboline formed in male Sprague-Dawley rats in vivo and in rat hepatocyte and human HepG2 cell incubates. Chem. Res. Toxicol. 20, 497–503 [DOI] [PMC free article] [PubMed] [Google Scholar]
- 29. Nauwelaers G., Bessette E. E., Gu D., Tang Y., Rageul J., Fessard V., Yuan J. M., Yu M. C., Langouët S., Turesky R. J. (2011) DNA adduct formation of 4-aminobiphenyl and heterocyclic aromatic amines in human hepatocytes. Chem. Res. Toxicol 24, 913–925 [DOI] [PMC free article] [PubMed] [Google Scholar]
- 30. Shimada T., Guengerich F. P. (1991) Activation of amino-α-carboline, 2-amino-1-methyl-6-phenylimidazo[4,5-b]pyridine, and a copper phthalocyanine cellulose extract of cigarette smoke condensate by cytochrome P450 enzymes in rat and human liver microsomes. Cancer Res. 51, 5284–5291 [PubMed] [Google Scholar]
- 31. King R. S., Teitel C. H., Kadlubar F. F. (2000) In vitro bioactivation of N-hydroxy-2-amino-α-carboline. Carcinogenesis 21, 1347–1354 [PubMed] [Google Scholar]
- 32. Turesky R. J., Lang N. P., Butler M. A., Teitel C. H., Kadlubar F. F. (1991) Metabolic activation of carcinogenic heterocyclic aromatic amines by human liver and colon. Carcinogenesis 12, 1839–1845 [DOI] [PubMed] [Google Scholar]
- 33. Goodenough A. K., Schut H. A., Turesky R. J. (2007) Novel LC-ESI/MS/MS(n) method for the characterization and quantification of 2′-deoxyguanosine adducts of the dietary carcinogen 2-amino-1-methyl-6-phenylimidazo[4,5-b]pyridine by two-dimensional linear quadrupole ion trap mass spectrometry. Chem. Res. Toxicol. 20, 263–276 [DOI] [PMC free article] [PubMed] [Google Scholar]
- 34. Bessette E. E., Goodenough A. K., Langouët S., Yasa I., Kozekov I. D., Spivack S. D., Turesky R. J. (2009) Screening for DNA adducts by data-dependent constant neutral loss-triple stage mass spectrometry with a linear quadrupole ion trap mass spectrometer. Anal. Chem. 81, 809–819 [DOI] [PMC free article] [PubMed] [Google Scholar]
- 35. Gu D., Turesky R. J., Tao Y., Langouët S. A., Nauwelaërs G. C., Yuan J. M., Yee D., Yu M. C. (2012) DNA adducts of 2-amino-1-methyl-6-phenylimidazo[4,5-b]pyridine and 4-aminobiphenyl are infrequently detected in human mammary tissue by liquid chromatography/tandem mass spectrometry. Carcinogenesis 33, 124–130 [DOI] [PMC free article] [PubMed] [Google Scholar]
- 36. Bessette E. E., Spivack S. D., Goodenough A. K., Wang T., Pinto S., Kadlubar F. F., Turesky R. J. (2010) Identification of carcinogen DNA adducts in human saliva by linear quadrupole ion trap/multistage tandem mass spectrometry. Chem. Res. Toxicol. 23, 1234–1244 [DOI] [PMC free article] [PubMed] [Google Scholar]
- 37. Straub K., Davis M., Hwang B. (1988) Benzazepine metabolism revisited. Evidence for the formation of novel amine conjugates. Drug Metab. Dispos. 16, 359–366 [PubMed] [Google Scholar]
- 38. Turgeon J., Paré J. R., Lalande M., Grech-Bélanger O., Bélanger P. M. (1992) Isolation and structural characterization by spectroscopic methods of two glucuronide metabolites of mexiletine after N-oxidation and deamination. Drug Metab. Dispos. 20, 762–769 [PubMed] [Google Scholar]
- 39. Clement B., Christiansen K., Girreser U. (2001) Phase 2 metabolites of N-hydroxylated amidines (amidoximes). Synthesis, in vitro formation by pig hepatocytes, and mutagenicity testing. Chem. Res. Toxicol. 14, 319–326 [DOI] [PubMed] [Google Scholar]
- 40. Schaber G., Wiatr G., Wachsmuth H., Dachtler M., Albert K., Gaertner I., Breyer-Pfaff U. (2001) Isolation and identification of clozapine metabolites in patient urine. Drug Metab. Dispos. 29, 923–931 [PubMed] [Google Scholar]
- 41. Turesky R. J., Bracco-Hammer I., Markovic J., Richli U., Kappeler A. M., Welti D. H. (1990) The contribution of N-oxidation to the metabolism of the food-borne carcinogen 2-amino-3,8-dimethylimidazo[4,5-f]quinoxaline in rat hepatocytes. Chem. Res. Toxicol. 3, 524–535 [DOI] [PubMed] [Google Scholar]
- 42. Snyderwine E. G., Welti D. H., Fay L. B., Würzner H. P., Turesky R. J. (1992) Metabolism of the food mutagen 2-amino-3-methylimidazo[4,5-f]quinoline in nonhuman primates undergoing carcinogen bioassay. Chem. Res. Toxicol. 5, 843–851 [DOI] [PubMed] [Google Scholar]
- 43. Levsen K., Schiebel H. M., Behnke B., Dötzer R., Dreher W., Elend M., Thiele H. (2005) Structure elucidation of phase II metabolites by tandem mass spectrometry. An overview. J. Chromatogr. A 1067, 55–72 [DOI] [PubMed] [Google Scholar]
- 44. Feng P. C., Fenselau C., Colvin M. E., Hinson J. A. (1983) Synthesis and analysis of glucuronides of N-hydroxyamides. Drug Metab. Dispos. 11, 103–108 [PubMed] [Google Scholar]
- 45. Luukkanen L., Taskinen J., Kurkela M., Kostiainen R., Hirvonen J., Finel M. (2005) Kinetic characterization of the 1A subfamily of recombinant human UDP-glucuronosyltransferases. Drug Metab. Dispos. 33, 1017–1026 [DOI] [PubMed] [Google Scholar]
- 46. Zenser T. V., Lakshmi V. M., Davis B. B. (1999) Human and Escherichia coli β-glucuronidase hydrolysis of glucuronide conjugates of benzidine and 4-aminobiphenyl and their hydroxy metabolites. Drug Metab. Dispos. 27, 1064–1067 [PubMed] [Google Scholar]
- 47. Kadlubar F. F., Beland F. A. (1985) in Polycyclic Hydrocarbons and Carcinogenesis (Harvey R. G., ed), pp. 341–370, American Chemical Society, Washington, D. C [Google Scholar]
- 48. Irving C. C. (1973) in Metabolic Conjugation and Metabolic Hydrolysis (Fishman W. H., ed), pp. 53–119, academic Press, Inc., New York [Google Scholar]
- 49. Mulder G. J., Hinson J. A., Gillette J. R. (1977) Generation of reactive metabolites of N-hydroxy-phenacetin by glucoronidation and sulfation. Biochem. Pharmacol. 26, 189–196 [DOI] [PubMed] [Google Scholar]
- 50. Cramer J. W., Miller J. A., Miller E. C. (1960) N-Hydroxylation. A new metabolic reaction observed in the rat with the carcinogen 2-acetylaminofluorene. J. Biol. Chem. 235, 885–888 [PubMed] [Google Scholar]
- 51. Lawley P. D. (1984) in Chemical Carcinogens (Searle C. E., ed) Vol. 1, pp. 324–484, ACS Monographs 182, Washington, D. C. [Google Scholar]
Associated Data
This section collects any data citations, data availability statements, or supplementary materials included in this article.