Background: Mitochondrial biogenesis is a complex process, and its regulation is not well known.
Results: cAMP-induced mitochondrial biogenesis through a decrease in the cellular phosphate potential is due to an increase in the glutathione redox status.
Conclusion: Mitochondrial biogenesis is tightly linked to glutathione redox status.
Significance: This is the first evidence for a glutathione redox control of a transcription factor involved in mitochondrial biogenesis.
Keywords: ATP, Cyclic AMP (cAMP), Glutathione, Mitochondria, Yeast, Mitochondria Biogenesis, Redox Homeostasis
Abstract
Cell fate and proliferation are tightly linked to the regulation of the mitochondrial energy metabolism. Hence, mitochondrial biogenesis regulation, a complex process that requires a tight coordination in the expression of the nuclear and mitochondrial genomes, has a major impact on cell fate and is of high importance. Here, we studied the molecular mechanisms involved in the regulation of mitochondrial biogenesis through a nutrient-sensing pathway, the Ras-cAMP pathway. Activation of this pathway induces a decrease in the cellular phosphate potential that alleviates the redox pressure on the mitochondrial respiratory chain. One of the cellular consequences of this modulation of cellular phosphate potential is an increase in the cellular glutathione redox state. The redox state of the glutathione disulfide-glutathione couple is a well known important indicator of the cellular redox environment, which is itself tightly linked to mitochondrial activity, mitochondria being the main cellular producer of reactive oxygen species. The master regulator of mitochondrial biogenesis in yeast (i.e. the transcriptional co-activator Hap4p) is positively regulated by the cellular glutathione redox state. Using a strain that is unable to modulate its glutathione redox state (Δglr1), we pinpoint a positive feedback loop between this redox state and the control of mitochondrial biogenesis. This is the first time that control of mitochondrial biogenesis through glutathione redox state has been shown.
Introduction
In aerobic living systems, oxidative phosphorylation activity can vary widely to adequately match ATP synthesis to the energy demand according to physiological or pathological conditions. There are two means, which are not exclusive, for the eukaryotic cell to match ATP synthesis to ATP demand. Short term adaptation relies on a flux modulation through every functional unit of the mitochondrial oxidative phosphorylation, whereas long term adaptation to various rates of ATP utilization can be achieved by modifying the number of these functional units (mitochondrial biogenesis). Indeed, in the light of the large physiological variations in ATP turnover observed in living systems, it is highly likely that the amount of enzymes involved in the oxidative phosphorylation pathway plays a significant role in this process (1–3). Moreover, the trade-off between rate and yield of ATP synthesis in heterotrophic organisms has been highlighted as a possible major mechanism of cooperation and competition involved in the evolutionary aspects of energy metabolism (4). Consequently, the molecular mechanisms involved in the adjustment of energy production to energy demand are of particular interest.
Previous work from our laboratory has shown that an increase in mitochondrial reactive oxygen species production is involved in mitochondria-to-nucleus signaling and induces a decrease in the activity of the transcription factor complex HAP2/3/4/5 (HAP complex), which is involved in mitochondrial biogenesis (5–9). In these conditions, although the cells sense the oxidative stress and respond to it by increasing the amount of antioxidant enzymes (i.e. superoxide dismutase and catalase), this increase is not sufficient to suppress the overflow of reactive oxygen species. Such an increase can be deleterious to the cell and is often associated with a mitochondrial malfunction. Through this signaling pathway, the cell protects itself by decreasing mitochondrial biogenesis and thus the amount of dysfunctional mitochondria (10). Hence, oxidative stress down-regulates mitochondrial biogenesis. However, the mechanisms involved in this redox-sensitive process are not known.
In both mammalian cells and yeast, the regulation of mitochondrial biogenesis clearly involves the cAMP signaling pathway, but the molecular mechanisms of this process are not well defined. Indeed, it has been shown that treatment of human preadipocytes with forskolin, which leads to an overactivation of the cAMP pathway, increased mitochondrial DNA copy number (11). However, whereas in mammalian cells adenylate cyclase activation is tissue- and isoform-specific (12), in yeast the Ras proteins have been shown to activate this enzyme (13). In yeast, growing evidence shows that overactivation of the Ras/cAMP pathway affects the cell mitochondrial content (14, 15). Here, using a cAMP-responsive yeast strain (16), we further investigated the molecular mechanisms involved in the regulation of mitochondrial biogenesis. We show that cAMP induces an increase in the overall biogenesis of the mitochondrial compartment. We unveil the origin of the induction of this mitochondrial biogenesis and show that this process is positively controlled by the cellular glutathione redox state. The master regulator of mitochondrial biogenesis in yeast, the transcriptional co-activator Hap4p, is shown to be quantitatively regulated by the glutathione redox state (i.e. the more oxidized this redox state, the less Hap4p expressed).
EXPERIMENTAL PROCEDURES
Yeast Strains, Culture Medium, and Growth Conditions
The following yeast strains were used in this study: diploid strain Saccharomyces cerevisiae OL556 (a/α, cdc25–5/cdc25-5, his3/his3, leu2/leu2, rca1(pde2)/rca1, TRP1/trp1, ura3/ura3) supplied by M. Jacquet (Orsay, France); BY4742 (Mat a; his3Δ1; leu2Δ0; lys2Δ0; ura3Δ0); Δglr1 (glr1::kanMX4). Cells were grown aerobically at 28 °C in the following medium: 0.175% yeast nitrogen base without sulfate (Difco), 0.2% casein hydrolysate (Merck), 0.5% (NH4)2SO4, 0.1% KH2PO4, 2% lactate (w/v) (Prolabo), pH 5.5, 20 mg/liter l-tryptophan (Sigma), 40 mg/liter adenine hydrochloride (Sigma), and 20 mg/liter uracil (Sigma). When cells carried a plasmid, the relevant amino acid was taken out from the medium. Growth was measured at 600 nm in a Safas spectrophotometer (Monaco). Dry weight determinations were performed on samples of cells harvested throughout the growth period and washed twice in distilled water. When applicable, cells were treated with cAMP (exogenously added to the culture medium) at the indicated concentration for 6 h. In order to modulate the intracellular glutathione redox state, the Δglr1 null mutant was grown in the following medium: 0.2% lactate, 0.175% yeast nitrogen base without sulfate, 0.2% KH2PO4, 0.5% NH4Cl, 300 μm (NH4)2SO4, and the relevant amino acids according to Ref. 17.
Oxygen Consumption Assays
The oxygen consumption was measured polarographically at 28 °C using a Clark oxygen electrode in a 1-ml thermostatically controlled chamber. Respiratory rates (JO2) were determined from the slope of a plot of O2 concentration versus time. Respiration assays of growing cells were performed in the growth medium except in the case of uncoupled respiration, which was performed after cells were harvested, in the following buffer: 2 mm magnesium sulfate, 1.7 mm sodium chloride, 10 mm potassium sulfate, 10 mm glucose, and 100 mm ethanol, pH 6.8 (18).
Cytochrome Content Determination
The cellular content of mitochondrial cytochromes c + c1, b, and a + a3 was calculated as described by Dejean et al. (19), taking into account the respective molar extinction coefficient values and the reduced minus oxidized spectra recorded using a dual beam spectrophotometer (Cary 4000, Varian).
β-Galactosidase Activity
A standard permeabilization procedure was used as described (20). After the preincubation period, 0.4 mg/ml o-nitrophenyl-β-d-galactopyranoside (Sigma) was added, and the tube was briefly vortexed. The reaction was stopped by the addition of 0.5 m Na2CO3 (Sigma). The samples were centrifuged for 30 s at 14,000 × g, and the absorbance of the supernatant read at 420 nm. Activity is given in arbitrary units.
Glutathione Redox Determination
6 × 10⁷ cells were harvested, and the pellet was resuspended in 350 μl of 3.4% metaphosphoric acid (Sigma). Glass beads (0.4-mm diameter) were added, and cells were vortexed (4 × 30 s) and then centrifuged for 2 min at 10,000 × g. Supernatants were used to measure reduced glutathione (GSH) and glutathione disulfide (GSSG) on the same run by reverse phase high pressure liquid chromatography with electrochemical detection (21).
Adenine Nucleotide Measurement
Cellular extracts were prepared by an ethanol extraction method adapted from the one described previously (22). Briefly, cells were harvested by rapid filtration on a nitrocellulose filter (1 μm). The filter was immediately dropped into a glass tube containing 5 ml of ethanol/Hepes (10 mm), pH 7.2 (4:1), and the tube was then incubated at 80 °C for 3 min. The mixture was cooled down on ice for at least 3 min, and the ethanol/Hepes solution was eliminated by evaporation using a rotary evaporator apparatus. The residue was resuspended in 500 μl of water. Insoluble particles were eliminated by centrifugation (12,000 × g, 10 min, 4 °C), and adenine nucleotide content was determined on the supernatant. ATP and ADP were measured by HPLC using a reverse phase (Spherisorb, ODS II, 5μ) column (0.46 × 25 cm) at 30 °C. Elution was performed with a 25 mm sodium pyrophosphate/pyrophosphoric acid (pH 5.75) buffer at a flow rate of 1.2 ml/min. Adenine nucleotide detection was performed at 254 nm; the determination was linear in a range of 3–3000 pmol.
Inorganic Phosphate Determination
Inorganic phosphate was determined according to the method of Sumner (23).
Protein Extraction, Electrophoresis, and Blotting
Cells were suspended in 50 μl of a mixture of 3.5% β-mercaptoethanol in 2 m NaOH. After a 15-min incubation on ice, proteins were precipitated with 50 μl of 3 m trichloroacetic acid for 15 min on ice. After a rapid centrifugation, the pellet was resuspended in a 1:1 (v/v) mixture of 10% SDS and sample buffer (0.1 m Tris, 2% SDS, 2% β-mercaptoethanol, 25% glycerol, 0.002% bromphenol blue). After quantification with a Bio-Rad kit, proteins were analyzed by 12% SDS-PAGE according to the method of Laemmli. After electrotransfer onto polyvinylidene difluoride membranes (Amersham Biosciences), blots were probed with the appropriate antibodies. The proteins were visualized by ECL (Amersham Biosciences), according to the manufacturer's instructions.
Antibody Production
Polyclonal anti-HAP4 antibody was generated by Eurogentec using the HAP4 fragment 330–554 as an antigen.
Enzymatic Activity Determination
Cells were washed and then broken by vigorous shaking with an equal volume of glass beads in a buffer containing 50 mm potassium phosphate and a mixture of protease inhibitors (Complete EDTA-freeTM, Roche Applied Science). Centrifugations (700 × g, 2 min) allowed the elimination of pelleted unbroken cells and glass beads. Cellular proteins were quantified by the biuret method. Citrate synthase (2.3.3.1) activity was determined by monitoring at 412 nm the oxidation of coenzyme A (produced by citrate synthase activity) by 5,5′-dithiobis-2-nitrobenzoic acid as a function of time in a Safas spectrophotometer. The enzyme activity was calculated using an extinction coefficient of 13,600 m−1·cm−1 at 412 nm. One citrate synthase unit was equal to 1 μmol of 5,5′-dithiobis-2-nitrobenzoic acid reduced/min/mg dry weight. Cytochrome c oxidase activity was determined by measuring oxygen consumption in the presence of 5 mm ascorbate, 1 mm N,N,N′,N′-tetramethyl-1,4-phenylendiammoniumdichloride, and 0.5 μg/mg protein antimycin A (all from Sigma). Glucose-6-phosphate dehydrogenase activity was determined in the following buffer: 30 mm MgCl2, 0.2 m triethanolamine, 15 mm EGTA, and 5 mm glucose 6-phosphate. NADPH apparition was followed at 340 nm. The enzyme activity was calculated using an extinction coefficient of 6,200 m−1·cm−1 at 340 nm.
Electronic Microscopy
The yeast pellets were placed on the surface of a copper EM grid (400 mesh) that had been coated with Formvar. Each loop was very quickly submersed in liquid propane precooled and held at −180 °C by liquid nitrogen. The loops were then transferred in a precooled solution of 4% osmium tetroxide in dry acetone in a 1.8-ml polypropylene vial at −82 °C for 72 h (substitution) and warmed gradually to room temperature, followed by three washes in dry acetone. Specimens were stained for 1 h in 1% uranyl acetate in acetone at 4 °C in a black room. After another rinse in dry acetone, the loops were infiltrated progressively with araldite (epoxy resin, Fluka). Ultrathin sections were contrasted with lead citrate and observed with a Hitachi 7650 electron microscope (Bordeaux Imaging Center-Electronic Microscopy Pôle of the University of Bordeaux Segalen).
Northern Blot
Northern blot analyses were performed as described previously (24). The HAP4 fragment was amplified by PCR using S288C genomic DNA and oligonucleotides 5′-CCCGGATCCATCATGACCGCAAAGACT-3′ plus 5′-CGCCTGCAGCTATTTCAAAATACTTGTACC-3′ and was radiolabeled by random priming with Ready-To-Go DNA Labeling Beads (GE Healthcare). The ACT1 probe was prepared as described previously (25).
cAMP Concentration Determination
Yeast cells grown in the above mentioned medium were harvested after 6 h of incubation in the presence or absence of exogenous cAMP. Cells were then suction-filtered on glass filters, rapidly washed with cold medium + 0.1 m NaCl, and suspended in 3 ml of 0.5 m perchloric acid. The cells were disrupted by vortexing in the presence of glass beads, followed by centrifugation to remove insoluble material. After the addition of 7% perchloric acid and glass beads, the cells were broken by mixing the test tube vigorously for 90 s on a vortex mixer. The yeast extract was transferred to a microcentrifuge tube, and the pH was adjusted to 6.8 with KOMO (0.3 m KOH, 2 m 3-(N-morpholino)propanesulfonic acid (MOPS)). Determination of cAMP in cell extracts was performed as described previously (27) using a cAMP assay kit, including a standard (Amersham Biosciences). Cell volume measurements used to calculate cAMP intracellular concentrations were performed using a MultisizerTM 4 Coulter Counter (Beckman Coulter).
RESULTS
The Ras/cAMP pathway is a nutrient signaling pathway, and cellular cAMP content is under tight control, in particular through its degradation by the type 2 phosphodiesterase gene (PDE2) product. The OL556 strain is an engineered S. cerevisiae strain that allows manipulation of intracellular cAMP through its addition in the extracellular medium (16). In this strain, the gene encoding Pde2p is deleted, and Cdc25p activity is attenuated by a point mutation. We made use of this strain in order to manipulate intracellular cAMP concentration to various extents and study the energy metabolism response to variations in the activity of the Ras/cAMP pathway. Extracellular cAMP concentrations of 1–3 mm were used that led to physiological variations of the intracellular cAMP concentration from 4 to 50 μm (Table 1) (16, 26, 27). Under these conditions, no significant modification in cell proliferation was assessed (data not shown).
TABLE 1.
Intracellular cAMP amount and concentration
cAMP was quantitated as described under “Experimental Procedures.” Cellular volume measurements used to calculate cAMP intracellular concentrations were performed using a MultisizerTM 4 Coulter Counter (Beckman Coulter). Values are means ± S.D. of at least three measurements performed on three independent cell cultures.
| Extracellular cAMP | Intracellular cAMP | Intracellular cAMP |
|---|---|---|
| mm | pmol/mg dry weight | μm |
| 0 | 2 ± 0.2 | 4 ± 0.4 |
| 1 | 3.5 ± 0.6 | 7 ± 1.2 |
| 2 | 10.6 ± 2.1 | 21 ± 4.1 |
| 3 | 25 ± 4 | 50 ± 8 |
Activation of Ras/cAMP Pathway Does Not Modify Cellular Respiratory State and Decreases Cellular Phosphate Potential
When yeast cells are grown on a non-fermentable substrate (such as lactate), growth is respiratory-obligatory, and energy transduction occurs within the mitochondria. In other words, the mitochondrial compartment is the main ATP production site. In order to determine whether the activation of the Ras/cAMP pathway alters in any way the functioning of the mitochondrial compartment, we assessed the cellular respiratory state. Briefly, the assay used determines the contribution of ATP synthesis to the oxygen consumption rate. In other words, it quantifies the degree of coupling between electron flux through the mitochondrial respiratory chain and ATP generation. This is assayed by sequentially quantifying the effect of triethyltin bromide (TET),4 a lipophilic inhibitor of the mitochondrial ATPase (28), and carbonyl cyanide m-chlorophenylhydrazone (CCCP), a well known uncoupling agent, on the oxygen consumption rate. The CCCP treatment activates oxygen consumption by dissipating the mitochondrial membrane potential. An in vivo respiratory state value (RSV) (see scheme 1) can then be calculated using the formula,
When cells were treated with increasing concentrations of cAMP, a concomitant increase in the cellular spontaneous respiratory rate occurred (Table 2). The non-phosphorylating respiratory rate is also increased concomitantly with increasing cAMP concentration. Furthermore, the CCCP (uncoupled) respiration is increased in a comparable extent. These increases in any (spontaneous, non-phosphorylating, uncoupled) respiratory rate led to a cellular respiratory state that is maintained whatever the cAMP concentration. These results show that the activation of the Ras/cAMP pathway does not affect the RSV. Consequently, the increase in cellular spontaneous respiratory rate is not due to a mitochondrial uncoupling.
TABLE 2.
Respiratory rates during growth in a cAMP-responsive strain
Cells were grown aerobically in medium containing 2% lactate. Respiratory rate was determined as described under “Experimental Procedures.” When applicable, TET was added at 0.2 mm and CCCP at 10 μm. Values are means ± S.D. of at least three measurements performed on three independent cell cultures. Respiratory state is defined in Equation 1.
| cAMP | Respiratory rates |
|||
|---|---|---|---|---|
| Spontaneous | TET | CCCP | RSV | |
| mm | natO/min/mg dry weight | |||
| 0 | 120 ± 9 | 56 ± 3 | 255 ± 20 | 32 |
| 1 | 151 ± 13 | 70 ± 5 | 319 ± 18 | 33 |
| 2 | 199 ± 14 | 98 ± 9 | 428 ± 21 | 31 |
| 3 | 269 ± 18 | 143 ± 7 | 529 ± 30 | 33 |
SCHEME 1.
Evolution of respiratory state values when the mitochondrial phosphorylating steady state changes (A) or does not change (B). If the in situ steady state gets closer to a non-phosphorylating state (state 4), the RSV decreases, whereas if the in situ steady state gets closer to a phosphorylating steady state, the RSV increases (A; amount of mitochondria constant). The “no changes” condition in the in situ mitochondrial steady state is associated with no changes in RSV (B; increase in the amount of mitochondria).
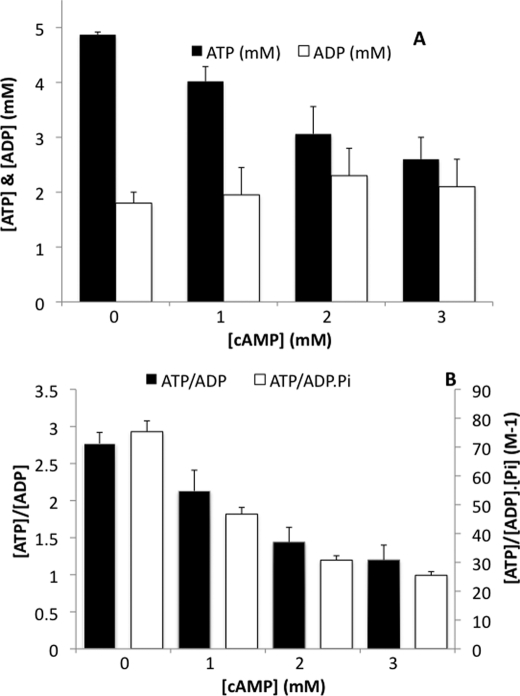
We investigated the influence of these various cAMP concentrations on the cellular phosphate potential (ΔG = ΔG0 + RTln(ATP/ADP·Pi)), which is a quantitative measurement of the free energy available in ATP hydrolysis. This potential is a critical parameter for cell growth and energy metabolism. The addition of cAMP (from 1 to 3 mm) to yeast cells induced a decrease in cellular ATP concentration associated with an increase in ADP concentration (Fig. 1A), showing a net hydrolysis of ATP. This induced a decrease in the cellular ATP/ADP ratio (Fig. 1B). We also assessed intracellular Pi concentration and determined the variations in ATP/ADP·Pi ratio in our experimental conditions. This ratio that reflects the phosphate potential was decreased, and this decrease was comparable with the ATP/ADP ratio decrease upon cAMP stimulation (Fig. 1B). Altogether, these data show that cAMP induces a decrease in phosphate potential that is dependent on cAMP concentration.
FIGURE 1.
A, adenine nucleotide variations induced by cAMP. Adenine nucleotides were measured as described under “Experimental Procedures.” Results are means of at least three separate experiments ± S.D. (error bars). B, ATP/ADP and ATP/ADP·Pi ratio variations induced by cAMP. Pi was measured as described under “Experimental Procedures.” Results are means of at least three separate experiments ± S.D.
As stated above (see Introduction), a modification in the cellular respiratory rate can be due either to a kinetic regulation of the respiratory chain activity or a modulation in the amount of mitochondria within a cell. Consequently, we assessed the mitochondrial amount in the cAMP-responsive cells that present a decrease in the cellular phosphate potential.
Decreasing Cellular Phosphate Potential Led to Increase in Mitochondria within Cell
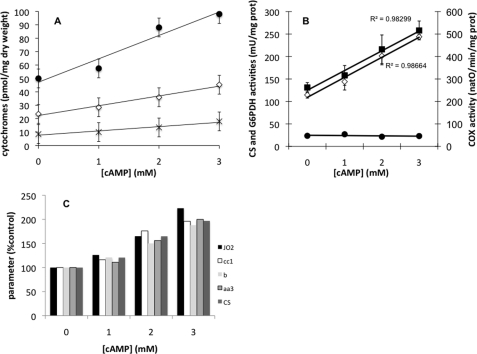
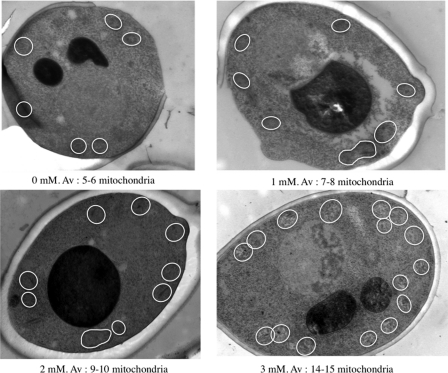
The amount of mitochondria within a cell can be assessed through the cellular content in mitochondrial cytochromes (2). This parameter was shown to be the most relevant one to determine the cellular content in oxidative phosphorylation complexes (1, 10, 15, 29). Mitochondrial cytochromes were measured in cells upon cellular treatment with increasing concentrations of cAMP that led to a decrease in the cellular phosphate potential. When increasing cAMP concentration, mitochondrial cytochromes concomitantly increased (Fig. 2A). Furthermore, all mitochondrial cytochromes exhibited a proportional increase, pointing to a possible overall regulation of the mitochondrial compartment. This was further confirmed by assessing two mitochondrial activities: mitochondrial citrate synthase, which is well recognized as a marker of the mitochondrial amount within a cell, and cytochrome c oxidase. Both enzymes exhibited an increase in their activities that is comparable with the increase in the cellular cytochrome amounts (Fig. 2B). Furthermore, the observed increase in cellular mitochondrial content upon increasing cAMP/decreasing the cellular phosphate potential was indeed specific to the mitochondrial compartment as shown by the activity of a cytosolic enzyme (glucose-6-phosphate dehydrogenase (G6PDH)) whose activity is not affected at all (Fig. 2B). Last, when all of the mitochondrial activities/contents were plotted as a percentage of the control cells (i.e. without cAMP), they all exhibited a comparable increase (Fig. 2C). This strongly suggests that an activation of the Ras/cAMP pathway and a decrease in the cellular phosphate potential induce an increase in the cellular amount of the mitochondrial compartment as a whole. Moreover, electron micrographs of the cells that exhibit an increase in cytochrome content upon increasing cAMP concentration in the medium were performed. These micrographs show that the increase in cytochrome contents is associated with an increase of the cellular mitochondrial population (highlighted in white; Fig. 3). These results show that an activation of the Ras/cAMP pathway led to an increase in mitochondria within the cell without any kinetic regulation of the respiratory chain (see RSV in Table 2).
FIGURE 2.
A, cellular cytochrome content variations induced by cAMP. Cytochrome content was determined as described under “Experimental Procedures.” Results are mean ± S.D. (error bars) of at least three measurements performed on three independent cell cultures. ●, cytochrome cc1; ♢, cytochrome b; ×, cytochrome aa3. B, mitochondrial enzymatic activities variations induced by cAMP. Enzymatic activities (i.e. citrate synthase (CS), cytochrome oxidase (COX), and glucose-6-phosphate dehydrogenase (G6PDH)) were measured as described under “Experimental Procedures.” Results are mean ± S.D. of at least three measurements performed on three independent cell cultures. ■, citrate synthase; ♢, cytochrome oxidase; ●, glucose-6-phosphate dehydrogenase. C, cellular cytochrome content, respiratory rates, and enzymatic activities in the presence of increasing concentrations of cAMP. Cytochromes, respiratory rates (JO2), and enzymatic activities were measured on yeast cells as described under “Experimental Procedures.”
FIGURE 3.
Electron micrographs of cells upon cAMP treatment. Ultrastructural studies were performed as described under “Experimental Procedures.” The cells shown are representative of the average cell in the considered conditions. cAMP concentration (mm) is shown. Mitochondria are highlighted in white. Av, average number of mitochondria (assessed in about 20 cells/experimental condition).
Decrease in Cellular Phosphate Potential Induced Mitochondrial Biogenesis
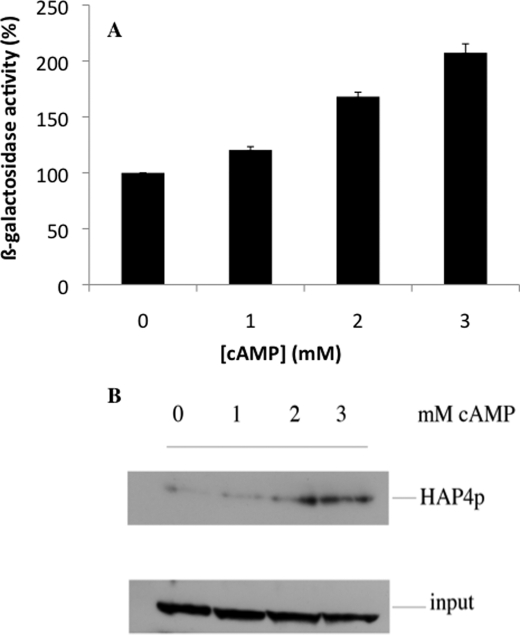
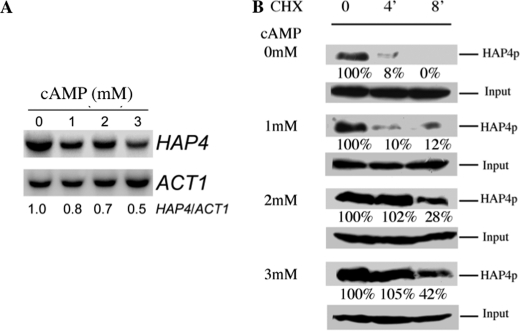
The amount of mitochondria within a cell is controlled by its turnover (i.e. the respective rates of mitochondrial biogenesis and mitochondrial degradation). The HAP complex has been shown to be involved in the specific induction of genes involved in gluconeogenesis, metabolism of alternate carbon sources, respiration, and mitochondrial development. Indeed, the disruption of any subunits of this complex renders the cells unable to grow on non-fermentable carbon sources (6, 8, 30, 31). Moreover, many genes involved in energy metabolism have been shown to be regulated by this complex (9, 32, 33). In order to determine whether the biogenesis of the mitochondrial compartment was affected by a cAMP increase and a concomitant decrease in cellular phosphate potential, we assessed the activity of the HAP complex with a widely used reporter gene, pCYC1-lacZ (pLG669Z) (34). We indeed observed an increase in the activity of the transcription factor HAP in our experimental conditions (Fig. 4A). Furthermore, the master regulator of the activity of this multicomplex is the subunit Hap4p, whose expression was increased upon cAMP addition (Fig. 4A). Last, the increased activity of this transcription factor complex was similar to the increase in mitochondrial amount, which pointed to an overall increase in mitochondrial biogenesis (see Figs. 2C and 4B). In order to determine the origin of the increase in Hap4p in our experimental conditions, both HAP4 mRNA and Hap4p turnover were assessed. Whereas the transcript levels for Hap4p decreased upon cAMP treatment, Hap4p stability significantly increased upon cAMP exposure. Fig. 5 thus shows that the observed increase in Hap4p levels is due to an increase in the protein stability (i.e. decrease in its turnover).
FIGURE 4.
A, activity of the transcription factors HAP2/3/4/5. The activity of the transcription factors HAP2/3/4/5 was assessed with a widely used reporter gene, pCYC1-lacZ(pLG669Z), as described under “Experimental Procedures.” Results are mean ± S.D. (error bars) of at least three measurements performed on three independent cell cultures. B, the amount of the co-activator Hap4p upon cAMP treatment. Western blot was performed as described under “Experimental Procedures.” The result is representative of at least four blots. Input was assessed using a commercial antibody directed against phosphoglycerate kinase (PGK1; Invitrogen).
FIGURE 5.
Origin of HAP4p increase upon cAMP treatment. A, HAP4 mRNA was assessed as described under “Experimental Procedures.” The result is representative of three such experiments B, HAP4p turnover was assessed in the presence of cycloheximide (CHX) (0.4 mg/ml) for the indicated times (4 and 8 min). A residual amount of Hap4p is expressed as a percentage of the non-cycloheximide-treated condition (t = 0 min). Western blot was performed as described under “Experimental Procedures.” The result is representative of at least four blots. Input was assessed using a commercial antibody directed against phosphoglycerate kinase (PGK; Invitrogen).
Mitochondrial Biogenesis Was Controlled by Glutathione Redox State
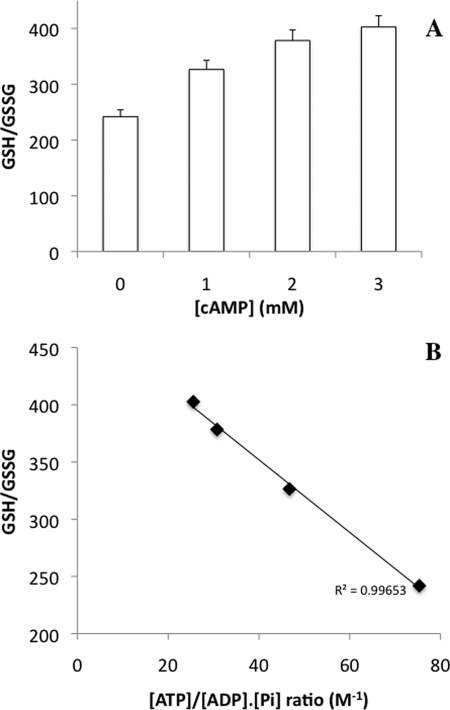
The question then arose as of the origin of this increase in mitochondrial biogenesis upon decreasing the cellular phosphate potential. We have previously shown that Hap4p amount is sensitive to oxidative stress (10). Moreover, it has been shown that a decrease in cellular phosphate potential relieves the redox pressure on the respiratory chain (35). If such a situation holds true in our experimental conditions, the cellular redox state should be increased (i.e. more reduced). Because one of the best indicators of this redox state is the glutathione (36), we assessed the cellular glutathione redox state in our experimental conditions. We observed an increase in glutathione redox state upon cAMP treatment of the cells (Fig. 6A). Furthermore, there was a linear relationship between the cellular ATP/ADP·Pi ratio and the glutathione redox state, which strengthens our hypothesis of a decrease in the redox pressure on the respiratory chain when the cellular phosphate potential decreases (Fig. 6B).
FIGURE 6.
A, glutathione redox state variations induced by cAMP. GSH and GSSG were measured as described under “Experimental Procedures.” Results are means of at least three separate experiments ± S.D. (error bars). B, relationship between the glutathione redox state and the cellular phosphate potential. Values for the cellular phosphate potential are from Fig. 1B.
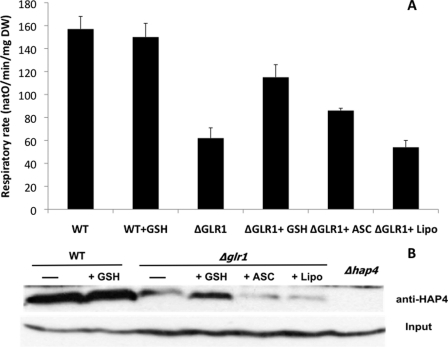
The glutathione redox state is mostly maintained within the cell thanks to the glutathione reductase (GLR1), which reduces back the oxidized form (GSSG). Consequently, the glutathione redox state is decreased (i.e. more oxidized) in the null mutant for this enzyme. Although this mutant is sensitive to oxidative stress (37), it is perfectly viable, and the glutathione redox state can be increased in the mutant by the addition of exogenous reduced glutathione to the culture medium (38). We have previously shown that when cells are grown on non-fermentable substrate, where growth is respiratory-obligatory, a linear relationship exists between cellular respiratory and growth rates, both parameters being related to the amount of mitochondria within the cell (2). Consequently, we assessed both the respiratory and growth rates in a wild type strain and in the Δglr1 strain in the presence or absence of reduced glutathione and the antioxidants ascorbate and lipoate. The cellular respiratory rate was highly decreased in the Δglr1 strain compared with the wild type strain (Fig. 7A), and this decrease was partly reversed by the addition of reduced glutathione to the culture medium, whereas the antioxidant ascorbate had very little effect and lipoate had no effect at all. The growth rates of these strains in the presence or absence of reduced glutathione varied according to the respiratory rate (data not shown). Moreover, the amount of transcription co-activator Hap4p was decreased in the Δglr1 strain when compared with the wild type strain, and its amount increased back when reduced glutathione was added, whereas ascorbate and lipoate had no effect on Hap4p amount either in the wild type cells (not shown) or in the Δglr1 cells (Fig. 7B). This further supports a specific role of the glutathione redox state in the control of the biogenesis of the mitochondrial compartment through Hap4p.
FIGURE 7.
A, respiratory rates in the wild type and Δglr1 strains. Cells were grown as described under “Experimental Procedures,” and respiratory rates were assessed in the absence or presence of 5 mm GSH, 5 mm ascorbate (ASC), and 5 μm lipoate (lipo). Error bars, S.D. B, the amount of the co-activator Hap4p in the wild type and Δglr1 strains. Western blot was performed as described under “Experimental Procedures.” The result is representative of at least four blots. Input was assessed using a commercial antibody directed against phosphoglycerate kinase (Pgk1p; Invitrogen).
Last, to determine whether the response of Hap4p amount to the cellular redox state was downstream of the cellular phosphate potential variations, the kinetics of Hap4p amount reversion in the Δglr1 strain was assessed. Upon the addition of GSH to the Δglr1 cells, Hap4p amount increased in 10 min (Fig. 8), whereas in that time scale, there was no significant variation of the cellular phosphate potential (data not shown). This shows that the control of mitochondrial biogenesis through the transcriptional co-activator Hap4p is tightly linked to the glutathione redox state, which acts downstream of the cellular phosphate potential.
FIGURE 8.
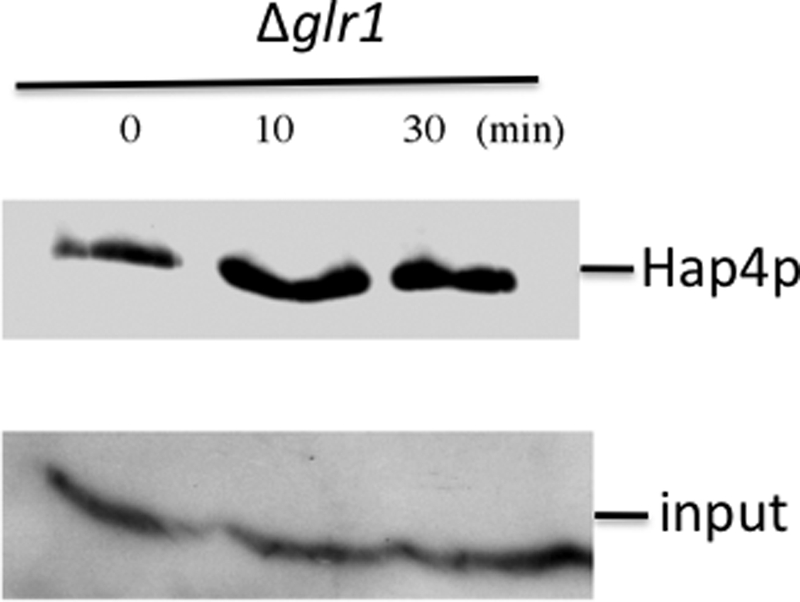
Kinetics of Hap4p decrease reversion by reduced glutathione in the Δglr1 strain. Western blot was performed as described under “Experimental Procedures.” The blot is representative of three such experiments. Cells were grown as described under “Experimental Procedures.” When added, reduced glutathione was 5 mm. Input was assessed using a commercial antibody directed against phosphoglycerate kinase (Pgk1p; Invitrogen).
DISCUSSION
In aerobic living systems, the oxidative phosphorylation activity can vary widely to adequately match ATP synthesis to energy demand according to physiological or pathological conditions. Here, we studied cellular chronic adaptation to an increase in ATP utilization induced by cAMP and evidenced by a decrease in ATP/ADP·Pi ratio. Altogether, our results show that the cellular adaptation to a chronic decrease in ATP/ADP·Pi ratio consists in an induction of mitochondrial biogenesis, as evidenced by the overall increase in mitochondrial mass within the cell and an increased activity of the HAP complex driven by a regulation in the amount of the master regulator of this complex: Hap4p. We show that this increase in Hap4p amount originates in an increase in the protein stability. Such a process allows an increase in ATP synthesis flux within the cell without any change in the cellular respiratory state (RSV). Further investigation of the molecular mechanisms involved in this process showed that a chronic decrease in ATP/ADP·Pi ratio induced an increase in the intracellular glutathione redox state. Cellular mechanisms that maintain redox homeostasis are crucial, because they provide a buffer against conditions that may perturb the redox environment of cells and/or induce oxidative stress (36, 39, 40). The abundance of glutathione (1–10 mm) in cells and its low redox potential (−240 mV) make the glutathione system a major intracellular redox buffer in most cells (36, 41, 42). Moreover, the post-translational consequences of cellular redox perturbation (e.g. thiol residue status) are most likely the main regulatory processes besides phosphorylation (36). Evidence is now cumulating that cell fate and proliferation depend on its redox status (43–46). Our study pinpoints a crucial intermediate in the process of redox control of mitochondrial biogenesis and cell growth that is the glutathione redox state. We show that the transcriptional complex in charge of mitochondrial biogenesis, the HAP complex, is a key component of this system. It is noteworthy that recent analysis of the cellular consequences of glutathione depletion demonstrated a down-regulation of genes that encode mitochondrial proteins and are regulated by the HAP complex (47). Using the Δglr1 strain, we determined that the glutathione redox state regulates mitochondrial biogenesis. In this strain, which has a highly oxidized redox status, mitochondrial biogenesis is highly impaired, and this can be reversed by the addition of reduced glutathione to the cells. Furthermore, short term kinetics assessment of the amount of the master regulator Hap4p clearly shows that it is rapidly up-regulated by the addition of reduced glutathione to Δglr1 cells.
Altogether, our results show that the long term cellular adjustment to an increase in energy demand (i.e. decrease in cellular phosphate potential) is a proportional increase in mitochondrial biogenesis. A crucial intermediate in this process is the glutathione redox state that controls the amount of Hap4p, the master regulator of mitochondrial biogenesis.
Acknowledgments
We thank B. Salin, F. Beaumatin, and A. Mougeolle for technical assistance. We thank Dr. Pattenden for the gift of GST-HAP4(330–554).
This work was supported in part by Agence Nationale de la Recherche Grant NT05-2_42268 and the Conseil Régional d'Aquitaine.
- TET
- triethyltin bromide
- CCCP
- carbonyl cyanide m-chlorophenylhydrazone
- RSV
- respiratory state value.
REFERENCES
- 1. Devin A., Rigoulet M. (2004) Regulation of mitochondrial biogenesis in eukaryotic cells. Toxicol. Mech. Methods 14, 271–279 [DOI] [PubMed] [Google Scholar]
- 2. Devin A., Dejean L., Beauvoit B., Chevtzoff C., Avéret N., Bunoust O., Rigoulet M. (2006) Growth yield homeostasis in respiring yeast is due to a strict mitochondrial content adjustment. J. Biol. Chem. 281, 26779–26784 [DOI] [PubMed] [Google Scholar]
- 3. Devin A., Rigoulet M. (2007) Mechanisms of mitochondrial response to variations in energy demand in eukaryotic cells. Am. J. Physiol. Cell Physiol. 292, C52–C58 [DOI] [PubMed] [Google Scholar]
- 4. Pfeiffer T., Schuster S., Bonhoeffer S. (2001) Cooperation and competition in the evolution of ATP-producing pathways. Science 292, 504–507 [DOI] [PubMed] [Google Scholar]
- 5. Forsburg S. L., Guarente L. (1989) Communication between mitochondria and the nucleus in regulation of cytochrome genes in the yeast Saccharomyces cerevisiae. Annu. Rev. Cell Biol. 5, 153–180 [DOI] [PubMed] [Google Scholar]
- 6. Hahn S., Pinkham J., Wei R., Miller R., Guarente L. (1988) The HAP3 regulatory locus of Saccharomyces cerevisiae encodes divergent overlapping transcripts. Mol. Cell. Biol. 8, 655–663 [DOI] [PMC free article] [PubMed] [Google Scholar]
- 7. Lascaris R., Bussemaker H. J., Boorsma A., Piper M., van der Spek H., Grivell L., Blom J. (2003) Hap4p overexpression in glucose-grown Saccharomyces cerevisiae induces cells to enter a novel metabolic state. Genome Biol. 4, R3. [DOI] [PMC free article] [PubMed] [Google Scholar]
- 8. McNabb D. S., Xing Y., Guarente L. (1995) Cloning of yeast HAP5. A novel subunit of a heterotrimeric complex required for CCAAT binding. Genes Dev. 9, 47–58 [DOI] [PubMed] [Google Scholar]
- 9. Buschlen S., Amillet J. M., Guiard B., Fournier A., Marcireau C., Bolotin-Fukuhara M. (2003) The S. cerevisiae HAP complex, a key regulator of mitochondrial function, coordinates nuclear and mitochondrial gene expression. Comp. Funct. Genomics 4, 37–46 [DOI] [PMC free article] [PubMed] [Google Scholar]
- 10. Chevtzoff C., Yoboue E. D., Galinier A., Casteilla L., Daignan-Fornier B., Rigoulet M., Devin A. (2010) Reactive oxygen species-mediated regulation of mitochondrial biogenesis in the yeast Saccharomyces cerevisiae. J. Biol. Chem. 285, 1733–1742 [DOI] [PMC free article] [PubMed] [Google Scholar]
- 11. Bogacka I., Ukropcova B., McNeil M., Gimble J. M., Smith S. R. (2005) Structural and functional consequences of mitochondrial biogenesis in human adipocytes in vitro. J. Clin. Endocrinol. Metab. 90, 6650–6656 [DOI] [PubMed] [Google Scholar]
- 12. Defer N., Best-Belpomme M., Hanoune J. (2000) Tissue specificity and physiological relevance of various isoforms of adenylyl cyclase. Am. J. Physiol. Renal Physiol. 279, F400–F416 [DOI] [PubMed] [Google Scholar]
- 13. Toda T., Uno I., Ishikawa T., Powers S., Kataoka T., Broek D., Cameron S., Broach J., Matsumoto K., Wigler M. (1985) In yeast, RAS proteins are controlling elements of adenylate cyclase. Cell 40, 27–36 [DOI] [PubMed] [Google Scholar]
- 14. Dejean L., Beauvoit B., Alonso A. P., Bunoust O., Guérin B., Rigoulet M. (2002) cAMP-induced modulation of the growth yield of Saccharomyces cerevisiae during respiratory and respiro-fermentative metabolism. Biochim. Biophys. Acta 1554, 159–169 [DOI] [PubMed] [Google Scholar]
- 15. Dejean L., Beauvoit B., Bunoust O., Guérin B., Rigoulet M. (2002) Activation of Ras cascade increases the mitochondrial enzyme content of respiratory competent yeast. Biochem. Biophys. Res. Commun. 293, 1383–1388 [DOI] [PubMed] [Google Scholar]
- 16. Wilson R. B., Renault G., Jacquet M., Tatchell K. (1993) The pde2 gene of Saccharomyces cerevisiae is allelic to rca1 and encodes a phosphodiesterase which protects the cell from extracellular cAMP. FEBS Lett. 325, 191–195 [DOI] [PubMed] [Google Scholar]
- 17. Kumar A., John L., Alam M. M., Gupta A., Sharma G., Pillai B., Sengupta S. (2006) Homocysteine- and cysteine-mediated growth defect is not associated with induction of oxidative stress response genes in yeast. Biochem. J. 396, 61–69 [DOI] [PMC free article] [PubMed] [Google Scholar]
- 18. Beauvoit B., Rigoulet M., Bunoust O., Raffard G., Canioni P., Guérin B. (1993) Interactions between glucose metabolism and oxidative phosphorylations on respiratory-competent Saccharomyces cerevisiae cells. Eur. J. Biochem. 214, 163–172 [DOI] [PubMed] [Google Scholar]
- 19. Dejean L., Beauvoit B., Guérin B., Rigoulet M. (2000) Growth of the yeast Saccharomyces cerevisiae on a non-fermentable substrate. Control of energetic yield by the amount of mitochondria. Biochim. Biophys. Acta 1457, 45–56 [DOI] [PubMed] [Google Scholar]
- 20. Kippert F. (1995) A rapid permeabilization procedure for accurate quantitative determination of β-galactosidase activity in yeast cells. FEMS Microbiol. Lett. 128, 201–206 [DOI] [PubMed] [Google Scholar]
- 21. Melnyk S., Pogribna M., Pogribny I., Hine R. J., James S. J. (1999) A new HPLC method for the simultaneous determination of oxidized and reduced plasma aminothiols using coulometric electrochemical detection. J. Nutr. Biochem. 10, 490–497 [DOI] [PubMed] [Google Scholar]
- 22. Loret M. O., Pedersen L., François J. (2007) Revised procedures for yeast metabolites extraction. Application to a glucose pulse to carbon-limited yeast cultures, which reveals a transient activation of the purine salvage pathway. Yeast 24, 47–60 [DOI] [PubMed] [Google Scholar]
- 23. Sumner J. B. (1944) A method for the colorimetric determination of phosphorus. Science 100, 413–414 [DOI] [PubMed] [Google Scholar]
- 24. Pinson B., Merle M., Franconi J. M., Daignan-Fornier B. (2004) Low affinity orthophosphate carriers regulate PHO gene expression independently of internal orthophosphate concentration in Saccharomyces cerevisiae. J. Biol. Chem. 279, 35273–35280 [DOI] [PubMed] [Google Scholar]
- 25. Denis V., Boucherie H., Monribot C., Daignan-Fornier B. (1998) Role of the myb-like protein bas1p in Saccharomyces cerevisiae. A proteome analysis. Mol. Microbiol. 30, 557–566 [DOI] [PubMed] [Google Scholar]
- 26. Noubhani A., Bunoust O., Bonini B. M., Thevelein J. M., Devin A., Rigoulet M. (2009) The trehalose pathway regulates mitochondrial respiratory chain content through hexokinase 2 and cAMP in Saccharomyces cerevisiae. J. Biol. Chem. 284, 27229–27234 [DOI] [PMC free article] [PubMed] [Google Scholar]
- 27. Thevelein J. M., Beullens M., Honshoven F., Hoebeeck G., Detremerie K., Griewel B., den Hollander J. A., Jans A. W. (1987) Regulation of the cAMP level in the yeast Saccharomyces cerevisiae. The glucose-induced cAMP signal is not mediated by a transient drop in the intracellular pH. J. Gen. Microbiol. 133, 2197–2205 [DOI] [PubMed] [Google Scholar]
- 28. Cain K., Griffiths D. E. (1977) Studies of energy-linked reactions. Localization of the site of action of trialkyltin in yeast mitochondria. Biochem. J. 162, 575–580 [DOI] [PMC free article] [PubMed] [Google Scholar]
- 29. Chevtzoff C., Vallortigara J., Avéret N., Rigoulet M., Devin A. (2005) The yeast cAMP protein kinase Tpk3p is involved in the regulation of mitochondrial enzymatic content during growth. Biochim. Biophys. Acta 1706, 117–125 [DOI] [PubMed] [Google Scholar]
- 30. Forsburg S. L., Guarente L. (1988) Mutational analysis of upstream activation sequence 2 of the CYC1 gene of Saccharomyces cerevisiae. A HAP2-HAP3-responsive site. Mol. Cell. Biol. 8, 647–654 [DOI] [PMC free article] [PubMed] [Google Scholar]
- 31. Olesen J., Hahn S., Guarente L. (1987) Yeast HAP2 and HAP3 activators both bind to the CYC1 upstream activation site, UAS2, in an interdependent manner. Cell 51, 953–961 [DOI] [PubMed] [Google Scholar]
- 32. Dang V. D., Valens M., Bolotin-Fukuhara M., Daignan-Fornier B. (1994) A genetic screen to isolate genes regulated by the yeast CCAAT-box binding protein Hap2p. Yeast 10, 1273–1283 [DOI] [PubMed] [Google Scholar]
- 33. Fondrat C., Kalogeropoulos A. (1996) Approaching the function of new genes by detection of their potential upstream activation sequences in Saccharomyces cerevisiae. Application to chromosome III. Comput. Appl. Biosci. 12, 363–374 [DOI] [PubMed] [Google Scholar]
- 34. Guarente L., Ptashne M. (1981) Fusion of Escherichia coli lacZ to the cytochrome c gene of Saccharomyces cerevisiae. Proc. Natl. Acad. Sci. U.S.A. 78, 2199–2203 [DOI] [PMC free article] [PubMed] [Google Scholar]
- 35. Leverve X., Sibille B., Devin A., Piquet M. A., Espié P., Rigoulet M. (1998) Oxidative phosphorylation in intact hepatocytes. Quantitative characterization of the mechanisms of change in efficiency and cellular consequences. Mol. Cell Biochem. 184, 53–65 [PubMed] [Google Scholar]
- 36. Schafer F. Q., Buettner G. R. (2001) Redox environment of the cell as viewed through the redox state of the glutathione disulfide/glutathione couple. Free Radic. Biol. Med. 30, 1191–1212 [DOI] [PubMed] [Google Scholar]
- 37. Grant C. M., Collinson L. P., Roe J. H., Dawes I. W. (1996) Yeast glutathione reductase is required for protection against oxidative stress and is a target gene for yAP-1 transcriptional regulation. Mol. Microbiol. 21, 171–179 [DOI] [PubMed] [Google Scholar]
- 38. Østergaard H., Tachibana C., Winther J. R. (2004) Monitoring disulfide bond formation in the eukaryotic cytosol. J. Cell Biol. 166, 337–345 [DOI] [PMC free article] [PubMed] [Google Scholar]
- 39. Perrone G. G., Tan S. X., Dawes I. W. (2008) Reactive oxygen species and yeast apoptosis. Biochim. Biophys. Acta 1783, 1354–1368 [DOI] [PubMed] [Google Scholar]
- 40. Delaunay A., Pflieger D., Barrault M. B., Vinh J., Toledano M. B. (2002) A thiol peroxidase is an H2O2 receptor and redox transducer in gene activation. Cell 111, 471–481 [DOI] [PubMed] [Google Scholar]
- 41. Meister A., Anderson M. E. (1983) Glutathione. Annu. Rev. Biochem. 52, 711–760 [DOI] [PubMed] [Google Scholar]
- 42. Hwang C., Sinskey A. J., Lodish H. F. (1992) Oxidized redox state of glutathione in the endoplasmic reticulum. Science 257, 1496–1502 [DOI] [PubMed] [Google Scholar]
- 43. Kirlin W. G., Cai J., Thompson S. A., Diaz D., Kavanagh T. J., Jones D. P. (1999) Glutathione redox potential in response to differentiation and enzyme inducers. Free Radic. Biol. Med. 27, 1208–1218 [DOI] [PubMed] [Google Scholar]
- 44. Hutter D. E., Till B. G., Greene J. J. (1997) Redox state changes in density-dependent regulation of proliferation. Exp. Cell Res. 232, 435–438 [DOI] [PubMed] [Google Scholar]
- 45. Atzori L., Dypbukt J. M., Sundqvist K., Cotgreave I., Edman C. C., Moldéus P., Grafström R. C. (1990) Growth-associated modifications of low molecular weight thiols and protein sulfhydryls in human bronchial fibroblasts. J. Cell. Physiol. 143, 165–171 [DOI] [PubMed] [Google Scholar]
- 46. Rigoulet M., Yoboue E. D., Devin A. (2011) Mitochondrial ROS generation and its regulation. Mechanisms involved in H2O2 signaling. Antioxid. Redox Signal. 14, 459–468 [DOI] [PubMed] [Google Scholar]
- 47. Ayer A., Tan S. X., Grant C. M., Meyer A. J., Dawes I. W., Perrone G. G. (2010) The critical role of glutathione in maintenance of the mitochondrial genome. Free Radic. Biol. Med. 49, 1956–1968 [DOI] [PubMed] [Google Scholar]


