Abstract
BACKGROUND
Field cancerization denotes the occurrence of molecular alterations in histologically normal tissues adjacent to tumors. In prostate cancer, identification of field cancerization has several potential clinical applications. However, prostate field cancerization remains ill defined. Our previous work has shown up-regulated mRNA of the transcription factor early growth response 1 (EGR-1) and the lipogenic enzyme fatty acid synthase (FAS) in tissues adjacent to prostate cancer.
METHODS
Immunofluorescence data were analyzed quantitatively by spectral imaging and linear unmixing to determine the protein expression levels of EGR-1 and FAS in human cancerous, histologically normal adjacent, and disease-free prostate tissues.
RESULTS
EGR-1 expression was elevated in both structurally intact tumor adjacent (1.6× on average) and in tumor (3.0× on average) tissues compared to disease-free tissues. In addition, the ratio of cytoplasmic versus nuclear EGR-1 expression was elevated in both tumor adjacent and tumor tissues. Similarly, FAS expression was elevated in both tumor adjacent (2.7× on average) and in tumor (2.5× on average) compared to disease-free tissues.
CONCLUSIONS
EGR-1 and FAS expression is similarly deregulated in tumor and structurally intact adjacent prostate tissues and defines field cancerization. In cases with high suspicion of prostate cancer but negative biopsy, identification of field cancerization could help clinicians target areas for repeat biopsy. Field cancerization at surgical margins on prostatectomy specimen should also be looked at as a predictor of cancer recurrence. EGR-1 and FAS could also serve as molecular targets for chemoprevention.
Keywords: prostate cancer, early growth response 1, fatty acid synthase, tumor adjacent, field cancerization
INTRODUCTION
Prostate cancer is a heterogeneous disease as evidenced by numerous molecular genome-wide studies related to genetic, epigenetic, and expressional analyses [1]. This heterogeneity is further reflected in the histology of prostate cancer with multifocal inter- and intra-lesional variations [2]. Accordingly, invasive adenocarcinoma is often accompanied by histologically identifiable low or high grade prostatic intraepithelial neoplasia (PIN), which has been widely accepted as a possible precursor of the former [3]. An additional and prominent histologic feature is proliferative inflammatory athrophy (PIA), which has been identified as a possible link between inflammatory processes and the malignant transformation of prostatic tissues [4]. The elucidation of these processes has the potential to provide detailed insights into the etiology of prostate cancer. The latter is important for two reasons: First, mechanistic insight into how prostate cancer develops yields molecular targets that are much needed for realizing successful chemopreventive strategies [5]. Second, the identification of prostate cancer mediators provides biomarkers of disease and indicators of progression [6].
With respect to these important problems, the concept of “field cancerization” or “field effect” holds the potential to provide important solutions. Field cancerization refers to the presence of structurally intact yet molecularly aberrant cells located in histologically normal tissues adjacent to primary tumors [7]. There is growing acceptance for the existence of field cancerization in the prostate, which encompasses genetic, epigenetic, expressional, and cytomorphologic parameters [8,9]. Reported aberrant expressional changes in field cancerized prostatic tissues include both RNA/cDNA and protein signatures identified by highly parallel technologies such as genomics and proteomics, as well as alterations of distinct proteins with different cellular function, including proliferation and anti-apoptosis (Ki67, Akt, androgen receptor), metabolism (alpha-methylacyl-CoA-racemase), and inflammation (cyclooxygenase 2) ([8,9] and references therein). Our own research into the molecular characterization of prostatic field cancerization has included genetic [10–12] and RNA expressional [13] investigations. These studies have revealed the up-regulation of potential new indicators and/or mediators of field cancerization in prostate glands containing adenocarcinoma. These novel factors reflect a variety of cellular processes including proliferation, inflammation, and metabolism, as represented for example by early growth response 1 (EGR-1), tumor protein D52 (TPD52), macrophage inhibitory cytokine 1 (MIC-1), and fatty acid synthase (FAS) [13].
In the present report, we applied a spectrum specific quantitative immunofluorescence (qIF) approach to clinically relevant human tissues to extend our initial findings by validating aberrant protein expression and localization of the nuclear transcription factor, EGR-1, and the metabolic enzyme, FAS, in histologically normal human tissues adjacent to prostatic adenocarcinomas in comparison to matched overt cancerous and truly normal prostatic tissues from disease-free individuals.
MATERIALS AND METHODS
Cell Culture
Human tumorigenic LNCaP and PC-3 prostate cancer cells (purchased from the American Type Culture Collection, Manassas, VA) and non-cancerous BPH-1 cells (kind gift from Dr. Chien-An Hu, Department of Biochemistry and Molecular Biology, University of New Mexico Health Sciences Center, Albuquerque, NM) were cultured in DMEM containing 4,500 mg/L glucose supplemented with 20% F12 nutrient mixture, 5 μg/ml insulin, 25 μg/ml adenine hydrochloride, 10 μg/ml transferrin, 0.25 μg/ml biotin, 15 pg/ml trijodothyronine, 100 U/ml penicillin/streptomycin), and heat-inactivated 10% fetal bovine serum at 37°C in a humidified 5% CO2 atmosphere. Trypsin-EDTA at 0.25% was used to detach the cells for splitting and re-culturing. All reagents were from Sigma (St. Louis, MO).
Patient Specimens
Fifteen de-identified cases of prostate adenocarcinoma and matched adjacent tissues were obtained from the Cooperative Human Tissue Network (CHTN; Western Division, Nashville, TN; two cases) and from the Department of Surgery, Urology Division at the University of New Mexico Hospital (UNMH) in Albuquerque, NM (13 cases) in agreement with all University, State, and Federal laws, and as approved by the Institutional Review Board of the University of New Mexico Health Sciences Center. Nine de-identified and entirely disease-free prostate specimens from autopsy cases from individuals who died due to conditions unrelated to cancer were obtained from the CHTN. Human prostate tissue microarrays featuring nine histologically normal tissues matched to their corresponding tumors (catalog # IMH-303) were purchased from Imgenex (San Diego, CA). The median age of the patient cohort with adenocarcinoma (from both UNMH and the tissue microarrays) was 62.5 years with a range of 44–70 years. These specimens featured Gleason scores from 6 to 10 and pathological tumor node metastasis (TNM) stages (according to the American Joint Committee on Cancer) from T2c to T3b. For some adjacent tissues, the corresponding tumors could not be released from the pathology laboratory due to small size. The median known age of the disease-free prostate specimens from autopsy cases was 45.5 years with a range of 26–79 years. All tissues were histologically reviewed by our collaborating surgical pathologist (E.G Fischer). All individual demographic and pathological data are given in Table I.
TABLE I.
Demographics and Clinical Parameters of Prostate Tissues, and Number of Images Analyzed
| Prostate tissues | Age | TNMa | Gleason | Number of images analyzed
|
|
|---|---|---|---|---|---|
| EGR-1 | FAS | ||||
| Disease-free (CHTN) | |||||
| 1 | 26 | — | — | 3 | 3 |
| 2 | 43 | — | — | 3 | 3 |
| 3 | 46 | — | — | 3 | 4 |
| 4 | 79 | — | — | 3 | 0 |
| 5 | 43 | — | — | 3 | 4 |
| 6 | 55 | — | — | 3 | 4 |
| 7 | 55 | — | — | 3 | 3 |
| 8 | 45 | — | — | 3 | 3 |
| 9 | n/ab | — | — | 3 | —c |
| Total = 27 | Total = 25 | ||||
| Age | TNMa | Gleason | Tumor | Adjacent | Tumor | Adjacent | |
|---|---|---|---|---|---|---|---|
| Tumor and adjacent (UNMH/CHTN) | |||||||
| 1 | 59 | T3b | 9 (4 + 5) | 3 | 3 | 3 | 3 |
| 2 | 69 | T2c | 7 (4 + 3) | 3 | 6 | 3 | 3 |
| 3 | 68 | T3b | 8 (5 + 3) | 3 | 3 | 3 | 3 |
| 4 | 55 | T2c | 8 (3 + 5) | 3 | 6 | —c | —c |
| 5 | 57 | T3a | 7 (4 + 3) | 3 | 3 | 3 | 3 |
| 6 | 55 | T2c | 8 (3 + 5) | 3 | 6 | 3 | 9 |
| 7 | 54 | T2–T3 | 6 (3 + 3) | —c | 6 | 3 | 6 |
| 8 | 54 | T2c | 6 (3 + 3) | —c | 9 | —c | 9 |
| 9 | 64 | T3b | 6 (3 + 3) | 3 | 9 | —c | —c |
| 10 | 62 | T2c | 6 (3 + 3) | —c | 9 | —c | 16 |
| 11 | 62 | T3b | 7 (4 + 3) | 3 | 6 | 4 | 9 |
| 12 | 44 | T2c | 6 (3 + 3) | 3 | 5 | 4 | 6 |
| 13 | 58 | T2c | 9 (4 + 5) | —c | 9 | —c | 10 |
| 14 | 69 | T2c | 6 (3 + 3) | —c | 9 | —c | 12 |
| 15 | 68 | T3a | 7 (3 + 4) | 3 | 3 | 4 | 4 |
| Total = 30 | Total = 92 | Total = 30 | Total = 93 | ||||
| Age | TNMa | Gleason | Tumor | Adjacent | Tumor | Adjacent | |
|---|---|---|---|---|---|---|---|
| Tumor and adjacent (tissue microarrays) | |||||||
| 1 | 69 | T2c | 7 | 1 | —c | 2 | —c |
| 2 | 62 | T2c | 7 | 2 | 2 | 2 | 2 |
| 3 | 66 | T3a | 7 | 2 | 2 | 2 | 1 |
| 4 | 65 | T3b | 9 | 2 | 1 | 2 | 2 |
| 5 | 69 | T3a | 7 | 2 | 2 | 2 | 2 |
| 6 | 70 | T3a | 7 | 2 | 2 | 2 | 2 |
| 7 | 70 | T2c | 7 | 2 | —c | 2 | —c |
| 8 | 63 | T3b | 10 | 2 | 1 | 2 | 2 |
| 9 | 44 | T3b | 7 | 2 | 2 | —c | 2 |
| Total = 17 | Total = 12 | Total = 16 | Total = 13 | ||||
Twenty adenocarcinomas, 22 tumor adjacent (18 matched), and 9 disease-free tissues were used. In total, 355 images were queried (numbers for each case and marker are indicated). Specimens were collected at the University of New Mexico Hospital (UNMH, Albuquerque NM), obtained from the Cooperative Human Tissue Network (CHTN; Nashville TN), or featured on tissue microarrays from Imgenex (San Diego CA).
Tumor Nodes Metastasis (TNM) pathological stage was assigned using criteria published by the American Joint Committee on Cancer (http://www.cancerstaging.org/index.html).
n/a, not available.
—, not analyzable.
qIF and Immunohistochemistry (IHC)
LNCaP, PC-3, and BPH-1 cells were fixed in 4% paraformaldehyde and washed in Tris buffered saline (TBS; 50 mM Tris, 150 mM NaCl, pH 7.6 by HCl) containing 0.025% Triton X-100 (TBST). Paraffin-embedded prostate tissue sections were deparaffinized with xylene and rehydrated with decreasing concentrations of ethanol. Antigen retrieval was performed in boiling 10 mM Tris, 1 mM EDTA, 0.05% Tween 20, pH 9.0 (by HCl) for 20 min, washed briefly in tap water, followed by gentle agitation in TBST. Cells and tissues were blocked in 10% normal goat serum (sc-2040, Santa Cruz Biotechnology, Santa Cruz, CA) in TBS containing 1% bovine serum antigen (BSA) for 2 hr at room temperature, then incubated with primary antibodies in TBS containing 1% BSA at 4°C overnight. EGR-1 was detected with 3 μg/ml mouse monoclonal antibody ab54966 from Abcam (Cambridge, MA); normal mouse IgG (GC270, Millipore, Billerica, MA) was used as negative control to ensure specificity. FAS was detected with 8 μg/ml rabbit polyclonal antibody sc20140 (H-300) from Santa Cruz Biotechnology; normal rabbit IgG (10500C, Invitrogen, Carlsbad, CA) was used as negative control to ensure specificity. Cells and sections were washed in TBST and incubated for 1 hr at room temperature with Alexa Fluor 633 goat anti-mouse IgG (for EGR-1) or with Alexa Fluor 633 goat anti-rabbit IgG (for FAS)(both antibodies from Invitrogen; A21052 and A21070, respectively) in TBS containing 1% BSA and as per manufacturer’s instructions. After washing in TBS, cells and sections were counter-stained for nuclei with diamidino-2-phenylindole (DAPI) for 2 min at room temperature. After washing with TBS, cells and sections were mounted in GVA Aqueous Mounting medium (Genemed Biotechnologies, San Francisco, CA).
Spectral image acquisition and linear unmixing was performed at the University of New Mexico Health Sciences Center Fluorescence Microscopy Shared Resource Core Facility using a Zeiss LSM510 META confocal microscope with a Plan-Apochromat 63x oil 1.4 NA objective, and using lambda mode of the Zen software (Carl Zeiss MicroImaging LLC, Thornwood, NY). Four hundred and five and 633 nm lasers were used to excite DAPI and Alexa Fluor 633, respectively, and an emission range of 433 to 690 nm was used to acquire lambda stacks and to capture the spectral information of the fluorophores. Control slides with only DAPI, or only secondary antibody, as well as unstained tissues were imaged to acquire separate lambda stacks of each fluorescent component, i.e., DAPI, Alexa Fluor 633, and autofluorescence. Representative pixels from each of these images were selected, creating the emission spectra of each component. These spectra were then used to linearly unmix the images using the same setting in the Zen software, a process that was equally applied to all spectral images to ensure the validity of intra- and inter-tissue comparisons. Spectrally unmixed confocal images were then imported into SlideBook digital microscopy imaging software (SlideBook, Denver, CO) for quantification. Two methods of quantification were used: (A) Whole slide analysis (WSA): Alexa Fluor 633 signals (total pixel count) were measured over the entire tissue section. To define nuclear immunostaining, Alexa Fluor 633 signals were quantified in areas defined by DAPI. To define cytoplasmic immunostaining, all Alexa Fluor 633 signals outside of the nuclei (DAPI) were quantified. (B) Regions of interest (ROI) analysis: Three representative ROI (defined as areas with robust immunostaining) per slide were chosen and the cumulative signals (total pixel count) specific for Alexa Fluor 633 was determined. The size of ROI was identical from image to image (~100 μm2 each) and they were chosen by a person blinded to the nature of the tissue (V. Severns) to avoid bias.
IHC for EGR-1 using mouse monoclonal sc-110 (Santa Cruz Biotechnology) and peroxidase-conjugated goat anti-rabbit secondary antibody (A6154; Sigma, St. Louis, MO) was performed in a similar manner with the addition of blocking endogenous peroxidase with hydrogen peroxide, 3-diaminobenzidine (DAB) as chromagen substrate, and Hematoxylin counter-stain (reagents from Dako, Carpinteria, CA and Sigma, St. Louis, MO). The specificity of the anti-EGR-1 antibody was controlled with normal rabbit IgG (sc-2027) and blocking peptide (sc-110 P) from Santa Cruz Biotechnology. Images were taken with a Zeiss Axioskop microscope equipped with Axiovision imaging software (Carl Zeiss MicroImaging LLC).
Statistics
Differences in expression of EGR-1 and FAS between groups were analyzed by the Wilcoxon rank sums test in the JumpIn analysis software package (JumpIn Software, Cary, NC). Differences in the intra-tissue heterogeneity between groups (expressed as coefficient of percent variation) and associations with clinical parameters were analyzed using the Student’s t-test. Statistical significance was defined at P ≤ 0.05. Potential correlations between signal intensities representing expression levels (EGR-1 and FAS; tumor and tumor adjacent) were analyzed using the chi-square (χ2) and the correlation coefficient (R2) tests.
RESULTS
EGR-1 and FAS Expression in Human Prostate Epithelial Cells
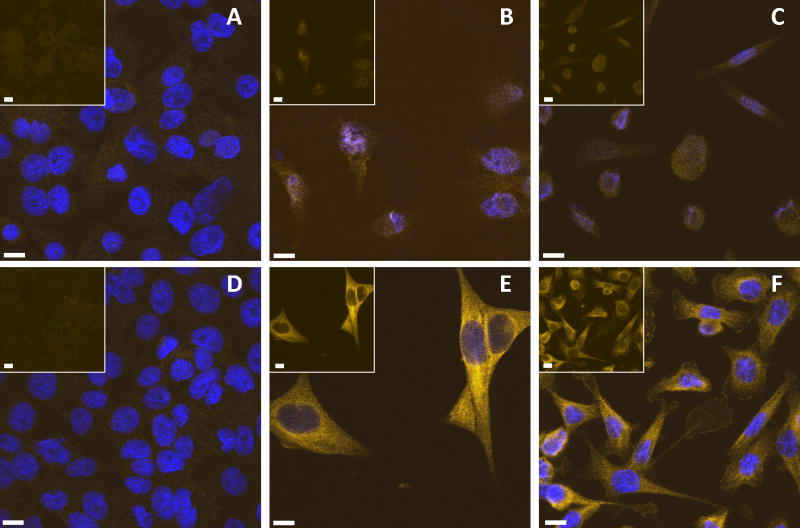
In preparation for the immunostaining in human prostate tissues, we validated the antibodies specific for EGR-1 and FAS by immunofluorescence (IF) in two cancerous (LNCaP and PC-3) and one non-cancerous (BPH-1) human prostate epithelial cell lines. In accordance with the previously reported expression in cell lines and human tissues [14–17], EGR-1 expression is increased in cancerous versus non-cancerous prostate epithelial cells (Fig. 1A–C). Similarly, FAS expression was greatly elevated in cancerous LNCaP and PC-3 compared to non-cancerous BPH-1 (Fig. 1D–F), consistent with its previously reported up-regulation in human prostate cancer tissues [18,19]. We concluded from these results that the antibodies used for the subsequent tissue studies were representative of EGR-1 and FAS expression in human cells.
Fig. 1.
EGR-1 (A–C) and FAS (D–F) immunostaining in BPH-1 (A and D), LNCaP (B and E), and PC-3 (C and F) cells by immunofluorescence; pictures represent overlays of nuclear staining by DAPI (blue) and Alexa Fluor 633 immunostaining (yellow/white); the insets in A and B are Alexa Fluor 633 immunostaining only; white bars in A–F represent 10 μM.
Detection of EGR-1 and FAS in Human Prostate Tissues by Immunofluorescence
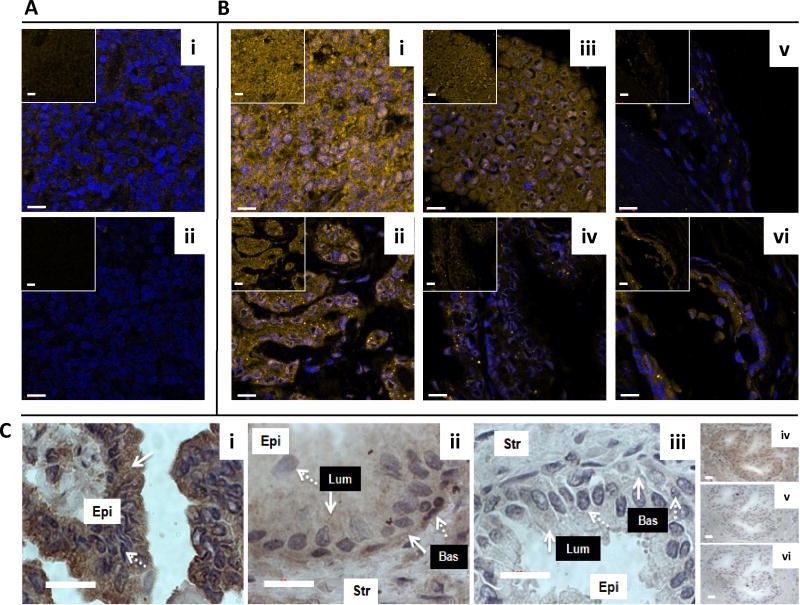
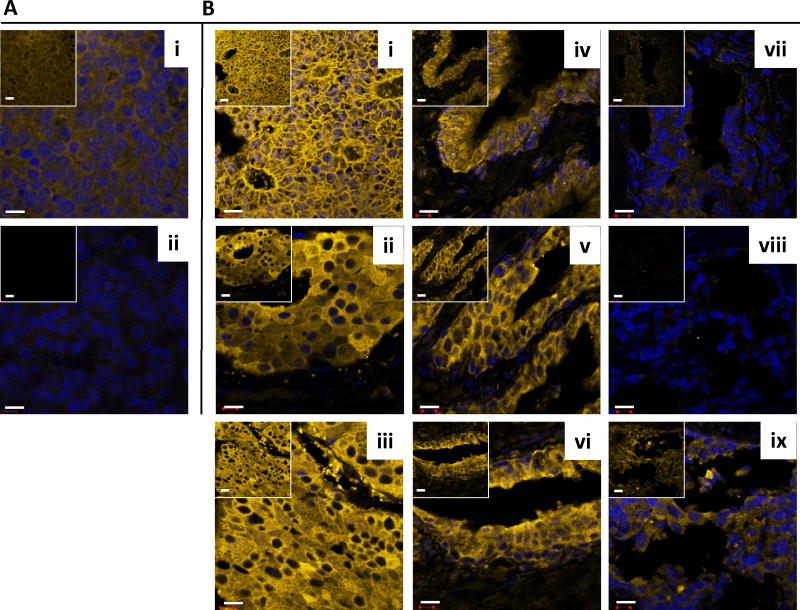
To further validate the antibodies used to detect and quantitatively measure EGR-1 and FAS by IF in human prostate tissues, we used a number of antibody concentrations and reaction conditions on training sets of human prostate tissues to determine optimal settings for the specific detection (not shown). In these immunostainings, the reactivity of the anti-EGR-1 and anti-FAS antibodies was compared with that of non-specific mouse and rabbit IgG in human prostate tissues. As shown in Figure 2Ai–ii and Figure 3Ai–ii using tissues of relatively low EGR-1 and FAS expression, both antibodies against EGR-1 and FAS were reactive above the background reactivity observed with the non-specific mouse and rabbit IgGs, ensuring specificity of detection.
Fig. 2.
EGR-1 detection in human prostate tissues. Immunofluorescence with anti-EGR-1 antibody (A i) and with unspecific mouse IgG (A ii) in a tumor tissue of low EGR-1 expression; two cases of prostate tumors (B i,ii) and matched adjacent tissues (B iii,iv), as well as two cases of disease-free control tissues unrelated to cancer (B v–vi) are shown; pictures represent overlays of nuclear staining by DAPI (blue) and Alexa Fluor 633 immunostaining (yellow/white); the insets in A and B are Alexa Fluor 633 immunostaining only; white bars in A and B represent 10 μM. C: Chromagen immunohistochemistry for EGR-1 in tumor (C i), matched adjacent (C ii), and disease-free unrelated to cancer (C iii) prostate tissue; solid and dashed white arrows indicate cytoplasmic and nuclear staining areas, respectively; white boxes denote epithelial (Epi) and stromal (Str) compartments; black boxes denote luminal (Lum) and basal (Bas) cell layers within the epithelial compartments; (C iv–vi) Antibody controls in an adjacent tissue: Anti-EGR-1 antibody (C iv) compared to unspecific IgG (C v) compared to anti-EGR-1 antibody pre-absorbed with matching peptide (Cvi); white bars in C represent 20 μM.
Fig. 3.
FAS detection in human prostate tissues. Immunofluorescence with anti-FAS antibody (A i) and with unspecific rabbit IgG (A ii) in a tumor tissue of low FAS expression; three cases of prostate tumors (B i–iii) and matched adjacent tissues (B iv–vi), as well as three cases of disease-free control tissues unrelated to cancer (B vii–ix) are shown; pictures represent overlays of nuclear staining by DAPI (blue) and Alexa Fluor 633 immunostaining (yellow/white); the insets are Alexa Fluor 633 immunostaining only; white bars represent 10 μM.
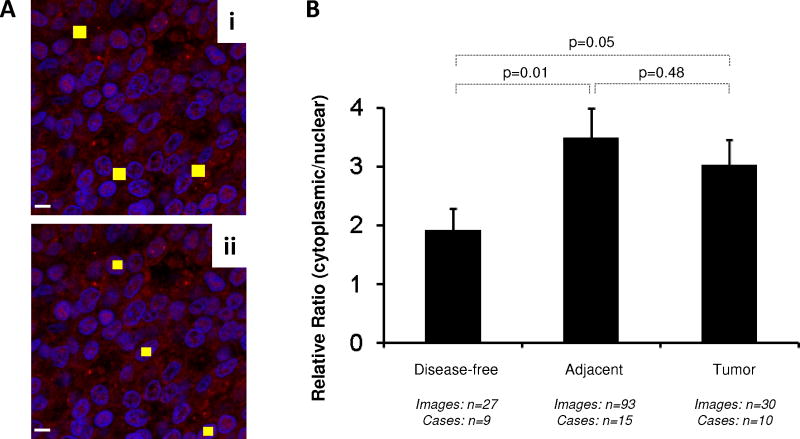
Using optimized settings for the two markers, we probed all tissue sections under identical conditions. Representative images for EGR-1 are shown in Figure 2B. Typically, EGR-1 immunostaining was similar in tumor and adjacent tissues (Fig. 2Bi–iv), and elevated over disease-free prostate tissues from individuals without cancer (Fig. 2Bv–vi). However, a high level of heterogeneity for EGR-1 expression was typically observed in all tissue categories, including in disease-free tissues (compare panel v with vi in Fig. 2B). In addition, our data indicate that EGR-1 cellular localization differs between cancerous and non-cancerous tissues, in accordance with previous reports in cell lines [14]. This finding was corroborated by chromagen IHC. Typically, stronger cytoplasmic and weaker nuclear EGR-1 immunostaining was observed in epithelial cells of tumor tissues (Fig. 2Ci). EGR-1 expression in structurally intact matched adjacent tissue was specific for the epithelial compartment, where immunostaining was observed in both the luminal and basal epithelial cells with some cells showing both nuclear and cytoplasmic EGR-1 in the basal cells (Fig. 2Cii). Very little, if any, EGR-1 immunostaining was observed in both the epithelial and stromal compartments of disease-free prostate tissues from autopsies (Fig. 2Ciii). Antibody specificity for these immunostainings was shown in controls using unspecific IgG and matching peptide pre-absorbed anti-EGR-1 antibodies (Fig. 2Civ–vi). We further tested this observation by the ROI analysis, in which the ratio of nuclear to cytoplasmic EGR-1expression was compared in cancerous, adjacent, and disease-free prostate tissues. This analysis revealed a significant increase in cytoplasmic localization of EGR-1 not only in cancerous (P = 0.05) but also in structurally intact tumor adjacent (P = 0.01) compared to disease-free prostate tissues (Fig. 4A,B).
Fig. 4.
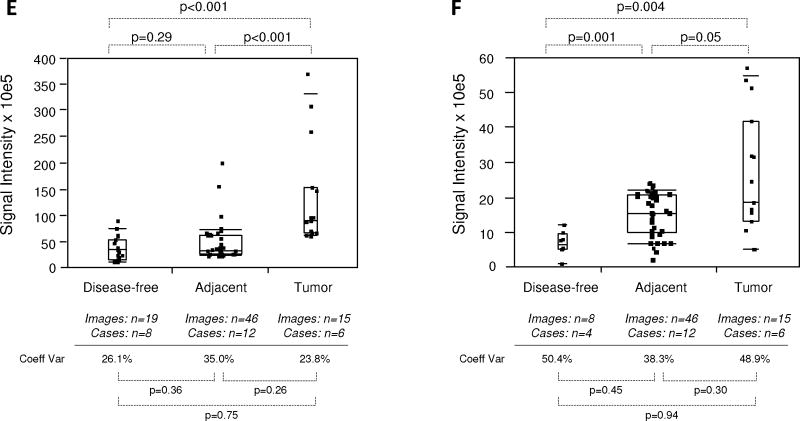
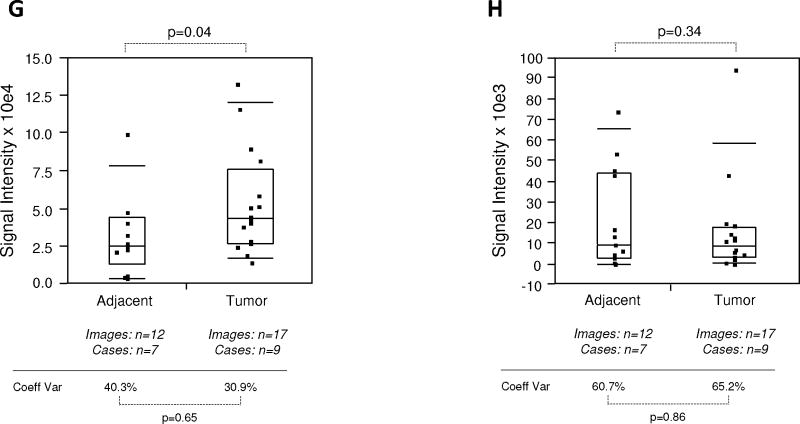
Quantitative immunofluorescence of EGR-1 in human prostate tissues. A: Representative example of regions of interest (ROI) placement (yellow boxes) in a tumor tissue of low EGR-1 expression to quantify cytoplasmic (A i) and nuclear (A ii) EGR-1 expression (red); white bars represent 10 μM. B: Relative cytoplasmic/nuclear expression ratios in disease-free, tumor adjacent, and tumor tissues; bars indicate the mean ± standard error for the number of images and cases indicated; P-values indicate the level of statistical significance for the differences between groups (Student’s t-test).C–H: EGR-1expression levels (indicated as signal intensities (pixel count)) in disease-free, tumor adjacent, and tumor tissues; the types of analysis were the following (as per Materials and Methods): (C and D) Whole slide analysis (WSA) for cytoplasmic expression above and below the median for the cohort from UNMH/CHTN, respectively; (E and F) WSA for nuclear expression above and below the median for the cohort from UNMH/CHTN, respectively; (G and H) WSA for cytoplasmic and nuclear expression in the tissue microarray (TMA), respectively; individual data points are shown as small black squares (partially overlapping); the boxes represent group medians (line across middle) and quartiles (25th and 75th percentiles) at its ends; lines above and below boxes indicate 10th and 90th percentiles, respectively; the width of the boxes relates to the number of data points; for each analysis, the number of images and cases is indicated; P-values above the panels denote the level of statistical significance for the differences between groups, as calculated by the Wilcoxon rank sums test; intra-tissue heterogeneity is indicated below the panels by the coefficient of variation in % (Coeff Var); the level of statistical significance for the differences between groups is indicated by the P-values(Student’s t-test).
Like for EGR-1, immunostaining for FAS was similar in tumor and adjacent tissues (Fig. 3Ei–vi), and typically much elevated over disease-free prostate tissues (Fig. 3Evii–ix). In agreement with its function, FAS immunostaining was entirely cytoplasmic.
Quantification of EGR-1 and FAS Expression in Human Prostate Tissues
The intrinsic autofluorescence of human prostate tissue observed in fluorescence microscopy is substantial, especially in the green spectral range. When compounded by relatively low expression levels, visualization by confocal microscopy can be challenging. We thus employed antibodies conjugated with far-red fluorophores and used spectral imaging and linear unmixing to separate autofluorescence from specific detection of EGR-1 and FAS (described in detail in Materials and Methods section). A total of 355 images stemming from 20 adenocarcinomas and 22 adjacent tissues (18 matched, 4 unmatched), as well as 9 disease-free tissues (see Table I) were queried.
Due to the differential localization of EGR-1 within the cell, i.e., cytoplasmic and nuclear (as shown by Mora et al. [14] and by our own data in Fig. 2), EGR-1 was analyzed separately for cytoplasmic and nuclear expression by the whole slide analysis (WSA; see Materials and Methods section). Further, because the level of inter-tissue heterogeneity was particularly high for EGR-1 immunostaining, the data were grouped and analyzed above and below the median (Fig. 4C–F). Both cytoplasmic and nuclear expression levels above the median were significantly different between tumor and disease-free, and between tumor and adjacent tissues (P < 0.001 for all analyses; mean values were 2.9–3.4× and 2.2–2.8× elevated in tumor and tumor adjacent, respectively, compared to disease-free tissues). However, they did not significantly differ between adjacent and disease-free tissues (P = 0.35 and P = 0.29 for cytoplasmic and nuclear expression, respectively; mean values were 1.2–1.3× elevated for cytoplasmic and nuclear expression, respectively) (Fig. 4C,E). Similarly, both cytoplasmic and nuclear expression levels below the median were significantly different between tumor and disease-free (P ≤ 0.001–0.004; mean values were 2.2–3.7× elevated), and between tumor and adjacent tissues (P < 0.001–0.05 for all analyses; mean values were 1.7–3.8× elevated). However, in contrast to the data above the median, expression levels below the median in tumor adjacent tissues were significantly elevated compared to disease-free tissues (P < 0.001 and P = 0.001 for cytoplasmic and nuclear expression, respectively; mean values were 1.8–2.1× elevated for cytoplasmic and nuclear expression, respectively) (Fig. 4D,F). Because of the more limited number of adjacent tissues and images available from the tissue microarray, all data points around the median were analyzed in a combined manner. While there was a significant difference in cytoplasmic EGR-1 expression between tumor and matched adjacent tissues (P = 0.04; Fig. 4G), this difference was absent for nuclear EGR-1 expression (P = 0.34; Fig. 4H). The level of intra-tissue heterogeneity was estimated by determining the average of the coefficients of variation for all images analyzed for the sections of all individual cases. As shown in Figure 4C–H, this measure remained high in all groups, ranging from 17.5 to 65.2% (average of 43.2%) and was not significantly different in any of the data cohorts (all P-values >0.05). Together, these data suggest that despite the high levels of inter- and intra-tissue heterogeneity, both cytoplasmic and nuclear EGR-1 expression in structurally intact and histologically normal tissues adjacent to prostate adenocarcinomas is elevated compared to disease-free prostate tissues, and that it resembles cancerous tissue, especially at lower levels. This is in support of the concept of field cancerization.
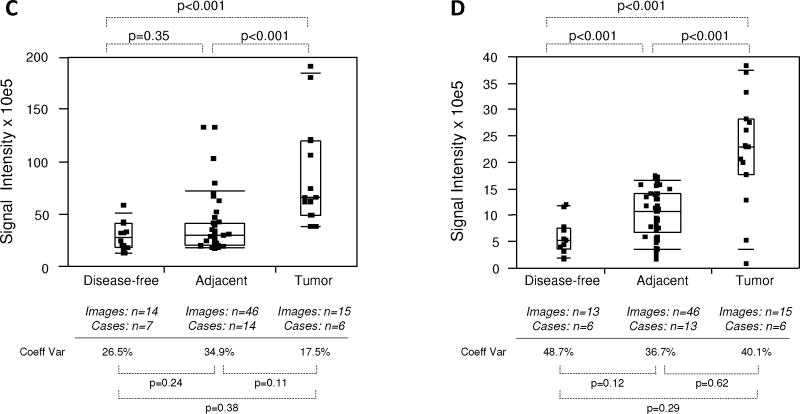
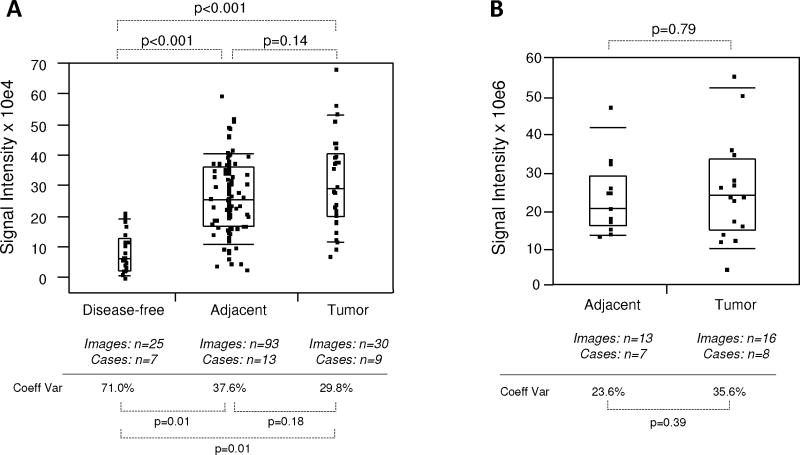
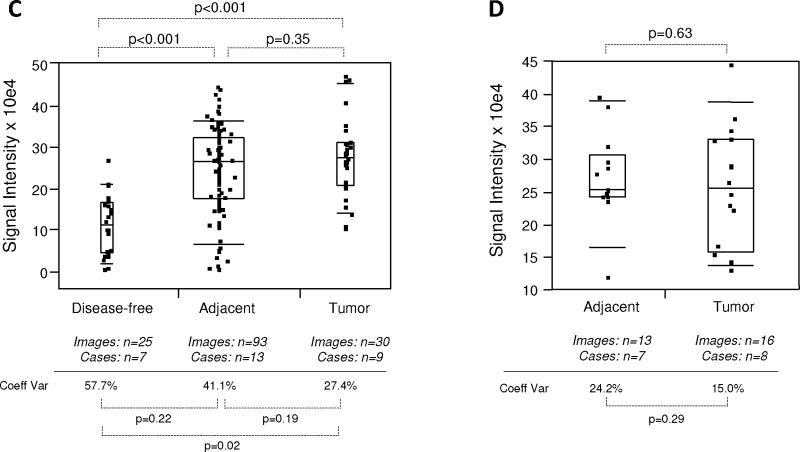
Expression of FAS was first analyzed by the WSA method. In this analysis, FAS expression in tumor and tumor adjacent prostate tissues was significantly elevated (P < 0.001; mean values were 3.2–3.8× higher) compared to disease-free tissues. However, FAS expression in tumor adjacent tissues was similar (P = 0.14; mean value 0.9× lower) to cancerous tissue (Fig. 5A). Similarly, FAS expression was indistinguishable (P = 0.79) between tumor and matched adjacent tissues queried on the tissue microarray (Fig. 5B). Next, we analyzed FAS expression in both cohorts by the ROI method. This approach confirmed the previous analysis in that FAS expression in tumor and tumor adjacent prostate tissues was significantly elevated (P < 0.001; mean values were 1.1–2.2× higher) compared to disease-free tissues, while expression in tumor adjacent was similar (P = 0.35; although with a 0.4× lower mean) to cancerous tissue (Fig. 5C). Similarly, the ROI analysis confirmed the data obtained by WSA showing that FAS expression was the same (P = 0.63) in tumor and matched adjacent tissues queried on the tissue microarray (Fig. 5D). The level of intra-tissue heterogeneity ranged from 15.0 to 71.0% with a lower average of 36.3% than for EGR-1 (Fig. 5A–D), and with a trend toward significant differences (P < 0.05) between tumor or adjacent and disease-free tissues (Fig. 5A,C). As for EGR-1, the FAS data support the concept of field cancerization despite relatively high levels of inter- and intra-tissue heterogeneity.
Fig. 5.
Quantitative immunofluorescence of FAS in human prostate tissues. A–D: FAS expression levels (indicated as signal intensities (pixel count)) in disease-free, tumor adjacent, and tumor tissues; the types of analysis were the following (as per Materials and Methods section and Table I): (A and B) Whole slide analysis (WSA) for the cohort from UNMH/CHTN and from the tissue microarray, respectively; (C and D) regions of interest (ROI) analysis for the cohort from UNMH/CHTN and from the tissue microarray, respectively; individual data points are shown as small black squares (partially overlapping); the boxes represent group medians (line across middle) and quartiles (25th and 75th percentiles) at its ends; lines above and below boxes indicate 10th and 90th percentiles, respectively; the width of the boxes relates to the number of data points; for each analysis, the number of images and cases is indicated; P-values above the panels denote the level of statistical significance for the differences between groups, as calculated by the Wilcoxon rank sums test; intra-tissue heterogeneity is indicated below the panels by the coefficient of variation in % (Coeff Var); the level of statistical significance for the differences between groups is indicated by the P-values (Student’s t-test).
DISCUSSION
The recently revised definition of field cancerization, i.e., the occurrence of molecular alterations in structurally intact cells residing in histologically normal tissue adjacent to cancer lesions, is increasingly accepted by scholars interested in the histological assessment of prostatic pathologies [7–9]. Because detailed knowledge about the molecular pathways underlying field cancerization in the prostate remains elusive, it is important to characterize this phenomenon by further describing its potential markers, which could also be mediators and targets for intervention. The present study contributes to this effort by determining the expression levels of two proteins that we have previously identified as significantly up-regulated at the transcriptional level in tissues adjacent to prostate adenocarcinomas and at least 1 cm distant from the tumor margins, i.e., EGR-1 and FAS [13].
EGR-1 is a pleiotropic transcription factor that in contrast to its tumor suppressing role in other cancers of epithelial origin [20,21] exerts a putatively unique and promoting action in prostate cancer, especially as a factor associated with increasing de-differentiation (grade) and androgen ablation resistance [16,22]. However, its potential role in pre-malignancy or early tumorigenesis remains ill defined. Our finding that EGR-1 protein expression can be elevated in histologically intact prostate tissues adjacent to tumors is compatible with a possible role as an early mediator of transformation. In support of this interpretation is our data showing that lower expression levels (defined as below the median within our prospective cohort) were significantly elevated in adjacent when compared to disease-free tissues. This may indicate that early and enhanced activation of EGR-1 induces the expression of secreted factors that are essential in the cell–cell communication occurring early in pre-malignant tissue remodeling. These include insulin-like growth factor 2 (IGF-2), platelet derived growth factors (PDGF), and fibroblast growth factors (FGF), which are important factors in cell–cell communication and proven downstream targets of EGR-1 transcriptional activity [23–25]. An additional new preliminary finding in this study is the somewhat differential nuclear expression of EGR-1 in basal versus luminal epithelial cells in tumor adjacent tissues. A similar observation was made by Mora et al. [14] in benign prostate epithelia lines. This observation is difficult to interpret in the light of the fact that the epithelial compartment of cancerous tissues does not typically feature a basal cell layer. Nevertheless, since cancer cells seem to be defined by an increasingly cytoplasmic EGR-1 expression, and since basal cells give rise to luminal cells by progressive differentiation, this observation is supportive of our hypothesis that field cancerized tissue adjacent to prostate carcinomas represent early (i.e., pre-malignant) stages of cell transformation.
FAS is a key enzyme that catalyzes the condensation of malonyl-CoA and acetyl-CoA to palmitate and plays a central role in the metabolism of prostate cancer cells by converting excess carbon intake into fatty acids for the generation of membranes and energy [26,27]. Further, through the synthesis and homeostasis of lipids, FAS affects additional cellular processes, including intrinsic and mitochondrial signal transduction pathways associated with apoptosis and survival, endoplasmic reticulum stress, and Wnt palmitoylation mediated cytoplasmic stabilization of β-catenin, which in turn affects cell motility and transcriptional activity [27–30]. In this capacity, it is conceivable that FAS could promote several processes involved in the early steps of pre-malignant cell transformation, a scenario that is supported by our data showing an elevated expression of FAS in tumor adjacent prostate tissues, which in turn is in agreement with the concept of field cancerization.
While it cannot be entirely excluded that the elevated expression of EGR-1 and FAS in the tumor adjacent prostate tissues was due to single cryptic cancer cells or clusters typical for multifocal malignancies such as prostate cancer [2], we emphasize here the carefully conducted histological assessment of these tissues. Furthermore, it is unlikely that relatively few cells in histologically normal tissues would cause levels of expression of these proteins similar to that observed in the cancerous tissues. The levels of expression for both EGR-1 and FAS were also not associated for matched cases of tumors and adjacent tissues (0.0–0.5 by χ2 and correlation coefficient R2 tests), arguing against an influence on expression in the field by the tumor. In contrast, our observational study cannot rule out the possibility that EGR-1 and FAS expression is induced in the field as a reaction to the tumor itself. For example, this possibility would be in agreement with the long recognized role of EGR-1 as a stress responder [21]. In addition, EGR-1 expression is regulated via the induction of classical mitogen activated protein kinase (MAPK) signaling pathways by growth factors that may be released from nearby tumor cells as autocrine stimulators, such as e.g., epidermal growth factor (EGF) [20,31]. Similarly, FAS expression in tumor adjacent tissues could be regulated by factors released by the tumor itself, including intra-tumorally synthesized dihydro-testosterone [32–35] and hypoxia induced vascular endothelial growth factor (VEGF) [27,36]. Interestingly, we have previously found the latter to be up-regulated in tumor adjacent prostate tissue itself [13]. Ultimately, these possibilities need to be tested in functional studies, preferably in animal models. Further, there is no direct link between EGR-1 and FAS function, although it is conceivable that EGR-1 may affect FAS expression via the androgen receptor. In fact, EGR-1 has been shown to modulate androgen activity in prostate cancer cells [37] and FAS is under androgenic control via activation of sterol regulatory element binding proteins (SREBP) [33,35]. However, neither the χ2 test nor the correlation coefficient R2 test indicated an association between EGR-1 and FAS in all cohorts investigated (0.0–0.3), suggesting an independent expression of these two factors.
Finally, although the present study was not designed nor powered enough to reliably determine the association with EGR-1 and FAS with clinical parameters, EGR-1 expression levels in both tumor and tumor adjacent tissues tended to differentiate between Gleason grade 6 and >6 (P < 0.01 and P = 0.09, respectively), and between pathological stage T2 and T3 (P = 0.10 and P = 0.15, respectively). No associations (P > 0.15) were observed for FAS expression levels in any cohort analyzed. These findings are not in complete agreement with our previous study on telomere DNA content (TC), a proxy for telomere length and a marker of genomic instability, which we found to be reduced in histologically normal tissues adjacent to prostate adenocarcinomas, indicating field cancerization [10,11]. Of note, we used TC in biopsies to predict early rise in prostate specific antigen (PSA; biochemical recurrence) after prostatectomy [12]. A possible reason for this discrepancy, apart from sample size, is the higher inter- and intra-tissue heterogeneity (coefficients of variation up to 71% for the latter) determined for EGR-1 and FAS expression in all cohorts investigated herein.
CONCLUSIONS
Using a sophisticated fluorescence microscopy method based on spectral imaging and linear unmixing to specifically quantify the expression of proteins in human prostate tissues, this study provides evidence for the first time that the transcription factor EGR-1 and the lipogenic enzyme FAS may contribute to the phenomenon of field cancerization. While this notion was convincing for FAS, it was less reliable for EGR-1, where a significant difference in expression was observed between tumor and adjacent tissues. Nevertheless, our results generated with both institutionally procured as well as commercially available tissues support the notion that tissues adjacent to tumors do not necessarily represent ideal controls for molecular studies [38].
Our findings have potential to help clinicians in several ways. In patients with high suspicion of prostate cancer but initial negative biopsy, identification of areas of field cancerization could provide a target for repeat prostate biopsy. In this way, it might avoid the need for rebiopsy of the entire gland and thereby minimize potential side effects like hematuria and hematospermia [39]. Field cancerization may also help predict which patients will experience disease recurrence. Clinical studies are needed to determine whether field cancerization and EGR-1/FAS expression at the inked margin on prostatectomy specimens has any relationship to biochemical recurrence. It is conceivable that the definition of a negative surgical margin at prostatectomy might in the future be expanded to include the absence of field cancerization at the inked margin. Lastly, identification of field cancerization via EGR-1/FAS expression could help identify men at higher than normal risk for developing subsequent prostate cancer. Selective chemoprevention in these men might prove more cost-effective than treating larger populations of men [40].
Acknowledgments
The authors would like to thank Myra Zucker, Cathy Martinez, and Kari Rigg in the Department of Pathology at the University of New Mexico Health Sciences Center for skillfully grossing radical prostatectomy specimens. They are grateful to Kerry Wiles from the Cooperative Human Tissue Network (CHTN; Western Division, Nashville TN) for the successful procurement of prostate tissues and annotated reports. Images were generated in the University of New Mexico & Cancer Center Fluorescence Microscopy Shared Resource, funded as detailed on: http://hsc.unm.edu/crtc/microscopy/Facility.html. They also thank Facility Manager Dr. Rebecca Lee for her excellent technical input and help with spectral imaging and linear unmixing. This work is supported by National Institutes of Health (NIH) Grant RR0164880 (to M. Bisoffi and J.K. Griffith), NIH Grant R03CA136030-02 (to M. Bisoffi), and University of New Mexico Cancer Center Support Grant NIH/NCI P30CA118110. The Departmental office of the UNM Biochemistry and Molecular Biology Department is greatly acknowledged for administrative support.
Grant sponsor: National Institutes of Health (NIH); Grant numbers: RR0164880; R03CA136030-02; Grant sponsor: University of New Mexico Cancer Center Support Grant NIH/NCI; Grant number: P30CA118110.
Abbreviations
- EGR-1
early growth response 1
- FAS
fatty acid synthase
- IHC
immunohistochemistry
- qIF
quantitative immunofluorescence
- ROI
regions of interest
- WSA
whole slide analysis
References
- 1.Mackinnon AC, Yan BC, Joseph LJ, Al-Ahmadie HA. Molecular biology underlying the clinical heterogeneity of prostate cancer: An update. Arch Pathol Lab Med. 2009;133(7):1033–1040. doi: 10.5858/133.7.1033. [DOI] [PubMed] [Google Scholar]
- 2.Andreoiu M, Cheng L. Multifocal prostate cancer: Biologic, prognostic, and therapeutic implications. Hum Pathol. 2010;41(6):781–793. doi: 10.1016/j.humpath.2010.02.011. [DOI] [PubMed] [Google Scholar]
- 3.Epstein JI. Mimickers of prostatic intraepithelial neoplasia. Int J Surg Pathol. 2010;18(3 Suppl):142S–148S. doi: 10.1177/1066896910370616. [DOI] [PubMed] [Google Scholar]
- 4.De Marzo AM, Platz EA, Sutcliffe S, Xu J, Gronberg H, Drake CG, Nakai Y, Isaacs WB, Nelson WG. Inflammation in prostate carcinogenesis. Nat Rev Cancer. 2007;7(4):256–269. doi: 10.1038/nrc2090. [DOI] [PMC free article] [PubMed] [Google Scholar]
- 5.Sarkar FH, Li Y, Wang Z, Kong D. Novel targets for prostate cancer chemoprevention. Endocr Relat Cancer. 2010;17(3):R195–212. doi: 10.1677/ERC-10-0074. [DOI] [PMC free article] [PubMed] [Google Scholar]
- 6.Donovan MJ, Costa J, Cordon-Cardo C. Systems pathology: A paradigm shift in the practice of diagnostic and predictive pathology. Cancer. 2009;115(13 Suppl):3078–3084. doi: 10.1002/cncr.24353. [DOI] [PubMed] [Google Scholar]
- 7.Dakubo GD, Jakupciak JP, Birch-Machin MA, Parr RL. Clinical implications and utility of field cancerization. Cancer Cell Int. 2007;7:2. doi: 10.1186/1475-2867-7-2. [DOI] [PMC free article] [PubMed] [Google Scholar]
- 8.Nonn L, Ananthanarayanan V, Gann PH. Evidence for field cancerization of the prostate. Prostate. 2009;69(13):1470–1479. doi: 10.1002/pros.20983. [DOI] [PMC free article] [PubMed] [Google Scholar]
- 9.Halin S, Hammarsten P, Adamo H, Wilkstrom P, Bergh A. Tumor indicating normal tissue could be a new source of diagnostic and prognostic markers for prostate cancer. Expert Opin Med Diagn. 2011;5(1):37–47. doi: 10.1517/17530059.2011.540009. [DOI] [PubMed] [Google Scholar]
- 10.Fordyce CA, Heaphy CM, Joste NE, Smith AY, Hunt WC, Griffith JK. Association between cancer-free survival and telomere DNA content in prostate tumors. J Urol. 2005;173(2):610–614. doi: 10.1097/01.ju.0000143195.49685.ce. [DOI] [PubMed] [Google Scholar]
- 11.Heaphy CM, Fleet TM, Treat EG, Lee SJ, Smith AY, Davis MS, Griffith JK, Fischer EG, Bisoffi M. Organ-wide telomeric status in diseased and disease-free prostatic tissues. Prostate. 2010;70(13):1471–1479. doi: 10.1002/pros.21182. [DOI] [PMC free article] [PubMed] [Google Scholar]
- 12.Treat EG, Heaphy CM, Massie LW, Bisoffi M, Smith AY, Davis MS, Griffith JK. Telomere DNA content in prostate biopsies predicts early rise in prostate-specific antigen after radical prostatectomy for prostate cancer. Urology. 2010;75(3):724–729. doi: 10.1016/j.urology.2009.04.032. [DOI] [PMC free article] [PubMed] [Google Scholar]
- 13.Haaland CM, Heaphy CM, Butler KS, Fischer EG, Griffith JK, Bisoffi M. Differential gene expression in tumor adjacent histologically normal prostatic tissue indicates field cancerization. Int J Oncol. 2009;35(3):537–546. doi: 10.3892/ijo_00000365. [DOI] [PubMed] [Google Scholar]
- 14.Mora GR, Olivier KR, Cheville JC, Mitchell RF, Jr, Lingle WL, Tindall DJ. The cytoskeleton differentially localizes the early growth response gene-1 protein in cancer and benign cells of the prostate. Mol Cancer Res. 2004;2(2):115–128. [PubMed] [Google Scholar]
- 15.Mora GR, Olivier KR, Mitchell RF, Jr, Jenkins RB, Tindall DJ. Regulation of expression of the early growth response gene-1 (EGR-1) in malignant and benign cells of the prostate. Prostate. 2005;63(2):198–207. doi: 10.1002/pros.20153. [DOI] [PubMed] [Google Scholar]
- 16.Eid MA, Kumar MV, Iczkowski KA, Bostwick DG, Tindall DJ. Expression of early growth response genes in human prostate cancer. Cancer Res. 1998;58(11):2461–2468. [PubMed] [Google Scholar]
- 17.Salah Z, Maoz M, Pizov G, Bar-Shavit R. Transcriptional regulation of human protease-activated receptor 1: A role for the early growth response-1 protein in prostate cancer. Cancer Res. 2007;67(20):9835–9843. doi: 10.1158/0008-5472.CAN-07-1886. [DOI] [PubMed] [Google Scholar]
- 18.Rossi S, Graner E, Febbo P, Weinstein L, Bhattacharya N, Onody T, Bubley G, Balk S, Loda M. Fatty acid synthase expression defines distinct molecular signatures in prostate cancer. Mol Cancer Res. 2003;1(10):707–715. [PubMed] [Google Scholar]
- 19.Shah US, Dhir R, Gollin SM, Chandran UR, Lewis D, Acquafondata M, Pflug BR. Fatty acid synthase gene overexpression and copy number gain in prostate adenocarcinoma. Hum Pathol. 2006;37(4):401–409. doi: 10.1016/j.humpath.2005.11.022. [DOI] [PubMed] [Google Scholar]
- 20.Gitenay D, Baron VT. Is EGR1 a potential target for prostate cancer therapy? Future Oncol. 2009;5(7):993–1003. doi: 10.2217/fon.09.67. [DOI] [PMC free article] [PubMed] [Google Scholar]
- 21.Thiel G, Cibelli G. Regulation of life and death by the zinc finger transcription factor Egr-1. J Cell Physiol. 2002;193(3):287–292. doi: 10.1002/jcp.10178. [DOI] [PubMed] [Google Scholar]
- 22.Yang SZ, Eltoum IA, Abdulkadir SA. Enhanced EGR1 activity promotes the growth of prostate cancer cells in an androgen-depleted environment. J Cell Biochem. 2006;97(6):1292–1299. doi: 10.1002/jcb.20736. [DOI] [PubMed] [Google Scholar]
- 23.Adamson E, de Belle I, Mittal S, Wang Y, Hayakawa J, Korkmaz K, O’Hagan D, McClelland M, Mercola D. Egr1 signaling in prostate cancer. Cancer Biol Ther. 2003;2(6):617–622. [PubMed] [Google Scholar]
- 24.Adamson ED, Mercola D. Egr1 transcription factor: Multiple roles in prostate tumor cell growth and survival. Tumour Biol. 2002;23(2):93–102. doi: 10.1159/000059711. [DOI] [PubMed] [Google Scholar]
- 25.Svaren J, Ehrig T, Abdulkadir SA, Ehrengruber MU, Watson MA, Milbrandt J. EGR1 target genes in prostate carcinoma cells identified by microarray analysis. J Biol Chem. 2000;275(49):38524–38531. doi: 10.1074/jbc.M005220200. [DOI] [PubMed] [Google Scholar]
- 26.Baron A, Migita T, Tang D, Loda M. Fatty acid synthase: A metabolic oncogene in prostate cancer? J Cell Biochem. 2004;91(1):47–53. doi: 10.1002/jcb.10708. [DOI] [PubMed] [Google Scholar]
- 27.Flavin R, Zadra G, Loda M. Metabolic alterations and targeted therapies in prostate cancer. J Pathol. 2011;223(2):283–294. doi: 10.1002/path.2809. [DOI] [PMC free article] [PubMed] [Google Scholar]
- 28.Fiorentino M, Zadra G, Palescandolo E, Fedele G, Bailey D, Fiore C, Nguyen PL, Migita T, Zamponi R, Di Vizio D, Priolo C, Sharma C, Xie W, Hemler ME, Mucci L, Giovannucci E, Finn S, Loda M. Overexpression of fatty acid synthase is associated with palmitoylation of Wnt1 and cytoplasmic stabilization of beta-catenin in prostate cancer. Lab Invest. 2008;88(12):1340–1348. doi: 10.1038/labinvest.2008.97. [DOI] [PMC free article] [PubMed] [Google Scholar]
- 29.Little JL, Wheeler FB, Fels DR, Koumenis C, Kridel SJ. Inhibition of fatty acid synthase induces endoplasmic reticulum stress in tumor cells. Cancer Res. 2007;67(3):1262–1269. doi: 10.1158/0008-5472.CAN-06-1794. [DOI] [PubMed] [Google Scholar]
- 30.Migita T, Ruiz S, Fornari A, Fiorentino M, Priolo C, Zadra G, Inazuka F, Grisanzio C, Palescandolo E, Shin E, Fiore C, Xie W, Kung AL, Febbo PG, Subramanian A, Mucci L, Ma J, Signoretti S, Stampfer M, Hahn WC, Finn S, Loda M. Fatty acid synthase: A metabolic enzyme and candidate oncogene in prostate cancer. J Natl Cancer Inst. 2009;101(7):519–532. doi: 10.1093/jnci/djp030. [DOI] [PMC free article] [PubMed] [Google Scholar]
- 31.Sauer L, Gitenay D, Vo C, Baron VT. Mutant p53 initiates a feedback loop that involves Egr-1/EGF receptor/ERK in prostate cancer cells. Oncogene. 2010;29(18):2628–2637. doi: 10.1038/onc.2010.24. [DOI] [PMC free article] [PubMed] [Google Scholar]
- 32.Chang KH, Li R, Papari-Zareei M, Watumull L, Zhao YD, Auchus RJ, Sharifi N. Dihydrotestosterone synthesis bypasses testosterone to drive castration-resistant prostate cancer. Proc Natl Acad Sci USA. 2011;108(33):13728–13733. doi: 10.1073/pnas.1107898108. [DOI] [PMC free article] [PubMed] [Google Scholar]
- 33.Swinnen JV, Heemers H, van de Sande T, de Schrijver E, Brusselmans K, Heyns W, Verhoeven G. Androgens, lipogenesis and prostate cancer. J Steroid Biochem Mol Biol. 2004;92(4):273–279. doi: 10.1016/j.jsbmb.2004.10.013. [DOI] [PubMed] [Google Scholar]
- 34.Swinnen JV, Van Veldhoven PP, Esquenet M, Heyns W, Verhoeven G. Androgens markedly stimulate the accumulation of neutral lipids in the human prostatic adenocarcinoma cell line LNCaP. Endocrinology. 1996;137(10):4468–4474. doi: 10.1210/endo.137.10.8828509. [DOI] [PubMed] [Google Scholar]
- 35.Swinnen JV, Esquenet M, Goossens K, Heyns W, Verhoeven G. Androgens stimulate fatty acid synthase in the human prostate cancer cell line LNCaP. Cancer Res. 1997;57(6):1086–1090. [PubMed] [Google Scholar]
- 36.Furuta E, Pai SK, Zhan R, Bandyopadhyay S, Watabe M, Mo YY, Hirota S, Hosobe S, Tsukada T, Miura K, Kamada S, Saito K, Iiizumi M, Liu W, Ericsson J, Watabe K. Fatty acid synthase gene is up-regulated by hypoxia via activation of Akt and sterol regulatory element binding protein-1. Cancer Res. 2008;68(4):1003–1011. doi: 10.1158/0008-5472.CAN-07-2489. [DOI] [PubMed] [Google Scholar]
- 37.Yang SZ, Abdulkadir SA. Early growth response gene 1 modulates androgen receptor signaling in prostate carcinoma cells. J Biol Chem. 2003;278(41):39906–39911. doi: 10.1074/jbc.M307250200. [DOI] [PubMed] [Google Scholar]
- 38.Braakhuis BJ, Leemans CR, Brakenhoff RH. Using tissue adjacent to carcinoma as a normal control: An obvious but questionable practice. J Pathol. 2004;203(2):620–621. doi: 10.1002/path.1549. [DOI] [PubMed] [Google Scholar]
- 39.Peyromaure M, Ravery V, Messas A, Toublanc M, Boccon-Gibod L. Pain and morbidity of an extensive prostate 10-biopsy protocol: A prospective study in 289 patients. J Urol. 2002;167(1):218–221. [PubMed] [Google Scholar]
- 40.Svatek RS, Lee JJ, Roehrborn CG, Lippman SM, Lotan Y. Cost-effectiveness of prostate cancer chemoprevention: A quality of life-years analysis. Cancer. 2008;112(5):1058–1065. doi: 10.1002/cncr.23276. [DOI] [PubMed] [Google Scholar]


