

Abstract
We describe a stochastic accumulator model demonstrating that visual search performance can be understood as a gated feedforward cascade from a salience map to multiple competing accumulators. The model quantitatively accounts for behavior and predicts neural dynamics of macaque monkeys performing visual search for a target stimulus among different numbers of distractors. The salience accumulated in the model is equated with the spike trains recorded from visually responsive neurons in the frontal eye field. Accumulated variability in the firing rates of these neurons explains choice probabilities and the distributions of correct and error response times with search arrays of different set sizes if the accumulators are mutually inhibitory. The dynamics of the stochastic accumulators quantitatively predict the activity of presaccadic movement neurons that initiate eye movements if gating inhibition prevents accumulation before the representation of stimulus salience emerges. Adjustments in the level of gating inhibition can control trade-offs in speed and accuracy that optimize visual search performance.
Introduction
Many models of visual search and attention assume a map that combines bottom-up and top-down salience (also referred to as “priority”) to guide shifts of attention and eye movements (Treisman and Gormican, 1988; Duncan and Humphreys, 1989; Bundesen et al., 2005; Navalpakkam and Itti, 2007; Wolfe, 2007). Visually responsive neurons in the frontal eye field (FEF), superior colliculus (SC), and posterior parietal cortex modulate their firing rate according to both physical conspicuity (bottom-up salience) and behavioral relevance (top-down salience) (Schall and Hanes, 1993; Gottlieb et al., 1998; Bichot and Schall, 1999; Findlay and Walker, 1999; Constantinidis and Steinmetz, 2005; Ipata et al., 2006; Thomas and Paré, 2007; Balan et al., 2008; Cohen et al., 2009; White and Munoz, 2011). However, it is poorly understood how neurons that encode salience are read out to guide saccades. Furthermore, no current model of visual search accounts for full response time (RT) distributions of error and correct responses (Wolfe et al., 2010; Palmer et al., 2011). Predicting full RT distributions can help to distinguish alternative models that may predict mean correct RTs equally well, but make very different predictions about underlying mechanisms (Ratcliff and Smith, 2004).
Stochastic accumulator models of perceptual decision making explain how a single stimulus guides selection of one response among alternative responses (Usher et al., 2002; McMillen and Holmes, 2006; Beck et al., 2008; Churchland et al., 2008; Furman and Wang, 2008; Ditterich, 2010; Leite and Ratcliff, 2010), but the natural world consists of many stimuli. FEF and SC movement neurons project to oculomotor brainstem nuclei and initiate a saccade when a fixed firing threshold is reached (Hanes and Schall, 1996; Hanes et al., 1998; Paré and Hanes, 2003). The firing rate dynamics of movement neurons are well explained by stochastic accumulator models (Boucher et al., 2007; Ratcliff et al., 2007), but the source of inputs driving movement neurons to threshold is not known. Furthermore, neurally plausible implementations of these models have never been generalized to decisions among multiple stimuli, as in visual search.
We present the first neural model of visual search formulated as a multiple-accumulator decision process. We significantly extend a novel modeling technique that defines the source of inputs driving accumulators with the observed discharge rates from FEF visually responsive neurons (Purcell et al., 2010). Our new work assumes that this dynamically modulated representation of stimulus salience drives a network of multiple competing accumulators associated with alternative stimuli in a visual search display. The transformation from salience to saccades is controlled by a tonic gating inhibition. Unlike our earlier work developing and validating this modeling technique, our new model incorporates multiple accumulators and explains choice probabilities and full correct and error response time distributions as a function of set size during visual search. We identify the accumulators with FEF movement neurons that select and initiate saccades when threshold is reached. Accumulator dynamics correspond quantitatively to movement neuron dynamics. We show that gating and lateral inhibition are necessary by ruling out alternative models that do not include these mechanisms. We also show how the gating inhibition provides a novel mechanism to control trade-offs in speed and accuracy.
Materials and Methods
Behavior and physiology
Behavioral and neurophysiological data were collected from two adult male macaques (Macaca radiata) trained to perform a visual search task in which the number of items in the display (set size) varied randomly across trials (Fig. 1A, inset). Basic behavioral and physiological analyses of these data have been published previously (Woodman et al., 2008; Cohen et al., 2009; Heitz et al., 2010). Briefly, after fixating a central stimulus for ∼600 ms, a stimulus array appeared containing a target (T or L) among one, three, or seven distractors (random 90° orientations of the other letter). The eccentricity of the array was always 10°. When the array contained two objects, they were always presented at opposite locations. When the array contained four items, they were always separated by an unfilled location. Thus, stimuli were spaced ∼7.7°, 14°, 19°, or 20° apart in the visual field. Target identity was varied across sessions. Monkeys were rewarded for making a single saccade to the location of the target within 2000 ms and fixating it for 1000 ms. Search performance was qualitatively similar across monkeys. Therefore, we pooled data across monkeys in addition to fitting data to individual monkeys.
Figure 1.
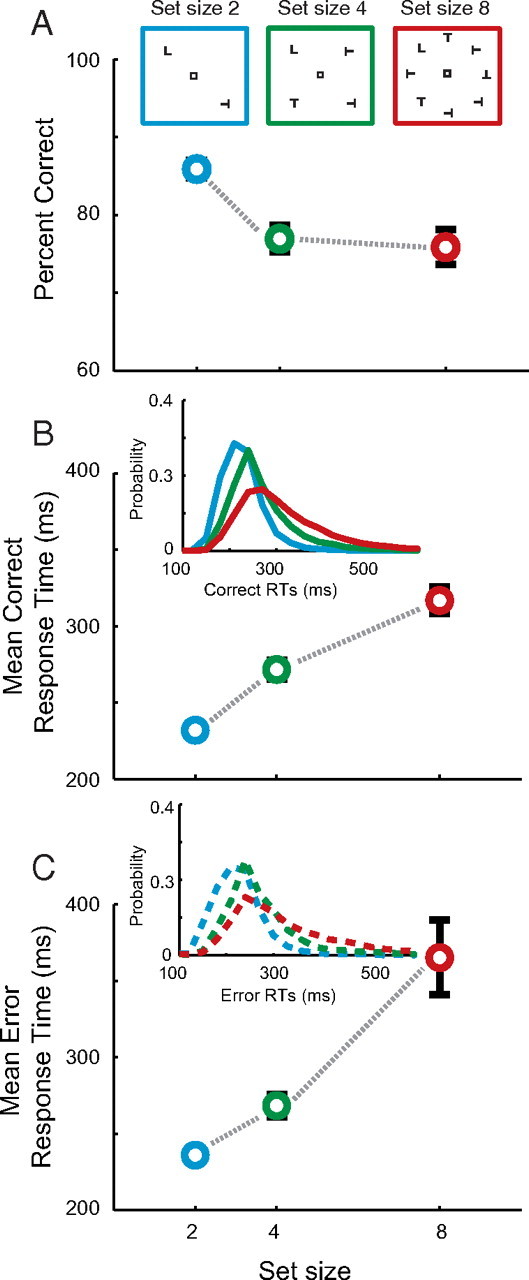
Visual search task and behavior. After fixating for a variable delay, an array of stimuli was presented, one of which (L) was the target and the rest (T) were distractors of random 90° orientations. Monkeys were required to make a single saccade to the target for reward. When the array contained two objects, they were always presented at opposite locations. When the array contained four items, each was separated by an unfilled location. All stimuli were presented at 10° eccentricity. Target identity varied across sessions. Set size varied randomly across trials. A–C, Mean ± SE percentage correct (A), correct (B), and error (C) response times for set size 2 (blue), 4 (green), and 8 (red). Insets show search array illustration (A), correct (B), and error (C) response time distributions. Data are pooled across subjects. See Figure 5 for individual subject data.
Neurons were classified using a memory-guided saccade task. A single target (filled gray disk) was presented in isolation for 100 ms. Monkeys were trained to maintain fixation for 400–800 ms after target onset. When the fixation spot disappeared, the monkey was rewarded for making a saccade to the remembered location of the target. Neurons with a consistent visual response <100 ms following target onset and persistent firing during the delay period were classified as visually responsive neurons (59 neurons; monkey Q, 40 neurons; monkey S, 19 neurons) and were used to derive input to the stochastic accumulators in the model. This included both visual neurons with no presaccadic discharge and visuomovement neurons with both visual and presaccadic discharge. We included both pure visual and visuomovement neurons as input to the model because previous work has shown that visuomovement neurons, like pure visual neurons, represent the salience of objects in their receptive field (RF) (Thompson et al., 1996; Cohen et al., 2009), but do not have activity sufficient to directly control saccade initiation (Ray et al., 2009). Neurons with a brisk presaccadic discharge, but little or no visual response, were classified as movement neurons (22 neurons; monkey Q, 15 neurons; monkey S, 7 neurons) and were compared qualitatively and quantitatively to model accumulator dynamics.
Simulation methodology
Neurophysiologically derived representation of visual salience.
Our model assumes that output from pools of visually responsive neurons encoding stimulus salience converge on movement neurons that initiate saccades. Observed spike trains of visually responsive neurons define the model input to stochastic accumulators identified with movement neurons. Here we describe how those observed spike trains are converted into model input on each simulated trial. In the next section, we describe the architecture of the network of accumulators that integrate that model input over time to generate a saccade to a particular stimulus in the visual search array at a particular time. Predicted proportions of error and correct responses and their associated response time distributions are generated by simulating thousands of trials.
Model input was derived directly from the spike trains recorded from visually responsive neurons following previously described methods (Fig. 2) (Purcell et al., 2010). For each simulated trial, we randomly sampled, with replacement, N spike trains from individual trials and generated a spike density function for each trial by convolving the spike trains with a function of the form as follows:
 |
which mimics the postsynaptic influence of each spike (Thompson et al., 1996). The growth constant, τg, is 1 ms, and the decay constant, τd, is 20 ms. The pool size, N, was varied to identify the value that optimally predicted behavior (Table 1). Each single-trial spike density function in the sample was normalized to the maximum firing rate of the neuron and summed. The resulting input function is mathematically similar to a Poisson shot noise process (Smith, 2010).
Figure 2.

A, Gated competitive accumulator model architecture. Spike trains generated by visually responsive neurons during visual search (left) were pooled to generate a dynamic input function to each accumulator unit (vi). Input from visually responsive neurons is integrated by eight accumulator units (mi) to a fixed threshold. Parameters that determine θ, k, g, and βd were optimized to fit performance. Only two of seven distractor units are illustrated. Leakage is illustrated for only the target unit, but was of equal value for all units. Lateral inhibition varied by distance, d, where d denotes the approximate degrees of visual angle between two stimuli (top), but was symmetrical between all units. B, Example simulated trial. The distribution of visual inputs when the target (thick, vT) or a distractor (thin, vD) were in the receptive field of the neuron varies dynamically over time as determined by visually response neuron physiology (top). Sampled visual inputs (middle) drive accumulator units (bottom) that initiate saccades to the location of the target (thick, mT) or a distractor (thin, mD). Inputs for this example were generated from spike trains recorded during set size 8. Only one of seven distractor units is shown. Predicted RT is the time when the threshold, θ (gray), is reached plus 15 ms for the eyes to move. The level of gating inhibition, g (magenta), was fit to performance. Accumulation begins only after the gate is exceeded and target salience exceeds distractor salience (i.e., target selection time).
Table 1.
Best fitting parameter values and fit statistics (χ2 and A/C) for all model architectures and datasets
| Dataset/architecture | χ2 | AIC | N | θ | k | g | β7.7 | β14 | β19 | β20 | u7.7 | u14 | u19 | u20 |
|---|---|---|---|---|---|---|---|---|---|---|---|---|---|---|
| Pooled | ||||||||||||||
| Gated race | 623 | 6583 | 130 | 1.337 | 0.430 | 0.427 | – | – | – | – | – | – | – | – |
| Gated diffusion-like | 265 | 6398 | 40 | 2.658 | 0.001 | 0.511 | – | – | – | – | 0.039 | 0.050 | 0.041 | 0.050 |
| Gated competitive | 123 | 6199 | 108 | 11.605 | 0.017 | 0.330 | 0.048 | 0.038 | 0.024 | 0.024 | – | – | – | – |
| Nongated, nonleaky | 234 | 6583 | 550 | 60.302 | – | – | 0.003 | 0.004 | 0.003 | 0.002 | – | – | – | – |
| Nongated, leaky | 165 | 6237 | 80 | 17.707 | 0.022 | – | 0.004 | 0.022 | 0.006 | 0.013 | – | – | – | – |
| Monkey Q | ||||||||||||||
| Gated race | 403 | 6543 | 66 | 3.373 | 0.018 | 0.599 | – | – | – | – | – | – | – | – |
| Gated diffusion-like | 244 | 6624 | 66 | 3.298 | 0.001 | 0.520 | 0.048 | 0.028 | 0.041 | 0.047 | ||||
| Gated competitive | 106 | 6497 | 134 | 13.607 | 0.014 | 0.330 | 0.050 | 0.034 | 0.018 | 0.021 | – | – | – | – |
| Nongated, nonleaky | 331 | 6917 | 450 | 60.238 | – | – | 0.004 | 0.004 | 0.004 | 0.004 | – | – | – | – |
| Nongated, leaky | 159 | 6434 | 100 | 17.573 | 0.027 | – | 0.031 | 0.027 | 0.014 | 0.012 | – | – | – | – |
| Monkey S | ||||||||||||||
| Gated race | 631 | 6193 | 50 | 1.095 | 0.519 | 0.500 | – | – | – | – | – | – | – | – |
| Gated diffusion-like | 351 | 6120 | 45 | 1.001 | 0.424 | 0.377 | – | – | – | – | 0.040 | 0.050 | 0.007 | 0.050 |
| Gated competitive | 157 | 6006 | 70 | 9.816 | 0.028 | 0.269 | 0.004 | 0.047 | 0.000 | 0.025 | – | – | – | – |
| Nongated, nonleaky | 324 | 6411 | 500 | 55.363 | – | – | 0.003 | 0.005 | 0.003 | 0.004 | – | – | – | – |
| Nongated, leaky | 181 | 6021 | 70 | 14.018 | 0.027 | – | 0.008 | 0.030 | 0.008 | 0.020 | – | – | – | – |
N: number of spike trains sampled from visually-responsive neurons to generate salience input for all conditions. θ, threshold; k, leakage constant; g, gate constant; βd, lateral inhibition weights between two units spaced i degrees of visual angle apart; ud, feed-forward inhibition weights between two units spaced i degrees of visual angle apart. Bold values indicate the best fitting model (minimum χ2). Dashes indicate the parameters were fixed to zero for a given architecture.
Spike trains from all neurons were sorted according to the set size (2, 4, or 8) presented and response (correct or error) made when they were recorded. Trials in which the animal prematurely broke fixation were excluded (<1%). Spike trains recorded from a particular set size condition were used to generate behavioral and neural predictions for that set size. The observed choice probabilities for the set size being simulated determined the proportion of simulations that used spike trains sampled from correct or error trials. Thus, the spike trains that drive the model represent the responses of visually responsive neurons recorded under the exact conditions being simulated. Simulations that used input from trials in which the animal erroneously looked to a distractor most often predicted erroneous responses due to the form of sampled input (Heitz et al., 2010), but this was not always the case. Indeed, we present examples of models that fail to adequately predict error probabilities.
Postsaccadic spikes cannot contribute to the saccade choice and must be excluded. However, simply eliminating those spikes would artificially increase noise as the simulation progressed because different trials terminate with different RTs. Instead, we extended each trial with firing rates generated according to a Poisson process with a mean rate determined by the spike rate 10–20 ms before the saccade. This proved to be a practical way to prevent the parameter optimization routine from failing when certain parameter values could not produce any RT or choice. Ultimately, these extrapolated spikes contributed very little to simulations of well fitting models because simulated trials ended within the observed RT range.
The use of trial-by-trial spike trains recorded while animals performed the visual search task distinguishes our modeling approach from other stochastic accumulator models in several important ways. First, simulations began well before the presentation of the stimulus array and proceeded until the response was initiated (Fig. 2B). Afferent delays were determined by visually responsive neuron physiology and efferent delays were short and well established quantities (Scudder et al., 2002), so no “nondecision time” parameter was necessary. Second, this approach takes into account the heterogeneous nature of neuronal response properties. Whereas many models assume highly simplified, prototypical, or idealized neural response function, our model is subject to the heterogeneity inherent in neuronal populations. Third, most models make specific assumptions about the mathematical form of the input to stochastic accumulators (Churchland et al., 2008; Furman and Wang, 2008; Smith and Ratcliff, 2009). Here, we make no a priori assumptions about the form, timing, and variability of inputs within and across trials and conditions. Instead, the form, timing, and variability are given by the pattern of activity of visually responsive neurons representing visual salience. Although this approach does not speak to the mechanisms that generate salience (Tsotsos et al., 1995; Itti and Koch, 2001), it provides strong constraints on the mechanism by which salience is used to generate a saccade. We see this as a crucial first step to constrain new models that explain how the neural representation of salience is generated.
Stochastic accumulation of visual salience.
The physiologically defined inputs are pooled and integrated by a network of leaky, competing accumulators (Fig. 2A). Trials in which a target was in the RF of a visually responsive neuron were used as input to the accumulator unit encoding the location of the target. Trials in which distractors were in the RF of a visually responsive neuron were used as input to units encoding the locations of distractors. Trials in which the target appeared near the RF edge were excluded.
The network always consisted of eight accumulator units regardless of the set size being simulated. For set sizes 2 and 4, input to an accumulator representing a location without a stimulus was defined by visually responsive neuron firing rates on trials in which no stimulus appeared in the cell's RF. Thus, the model requires no reconfiguration across set size conditions and can generalize naturally to situations with more than eight stimuli. We simulated neural activity from 300 ms before stimulus presentation until the initiation of the saccade. A simulated choice was made to the location represented by the first accumulator unit to reach a constant threshold (Fig. 2B, bottom). Simulated saccade RT was defined as the time when the threshold was crossed plus a fixed ballistic time of 15 ms, which accounts for the time necessary for brainstem processes that shift gaze (Scudder et al., 2002).
Model parameters define for all accumulators the threshold (θ), leakage (k), gating inhibition (g), feedforward inhibition (ud), and lateral inhibition (βd). Lateral inhibition varied as a function of distance between locations, but was symmetrical between any two locations. Critically, no parameters varied across set size or with the choice of saccade target or distractor. Therefore, variability in search performance was directly determined by variability in the visually responsive neuron representation of salience and how that representation affects the dynamics of the stochastic accumulator network. Thus, the model assumes that set size effects can be understood as a consequence of changes in the salience representation integrated by stochastic accumulators. It is possible that models assuming architectural or parametric differences across set size could also predict the observed behavior, but such models would provide a less parsimonious account of the data.
Each accumulator was governed by the following stochastic differential equation:
 |
where mi is the mean activity of the accumulator unit representing location i and vi is the input from visually responsive neurons representing the same location. As with other neural stochastic accumulator models (Usher and McClelland, 2001), we rectified mi to be >0 because firing rates cannot be negative. Interactions between units were determined by symmetrical feedforward, ud, and lateral, βd, inhibition weights (Usher and McClelland, 2001), where d indexes the distance between two stimuli in the array (Fig. 2A, inset; 4 total values corresponding to approximately d = 7.7°, 14°, 19°, and 20° of visual angle separating the two stimuli). k is the leakage constant, g is the gating constant, and + denotes rectification above zero. All simulations used an integration time step of dt = 5 ms. All models included a modest amount of Gaussian noise intrinsic to the accumulator, ξ, with mean, μ = 0, and SD, σ = 0.05; this variability is quite small relative to variability in the visual inputs. Initial model exploration showed that models explain search performance with σ = 0, but we include some intrinsic variability to allow for tonic neuronal drive when salience input falls below the level of the gate. We also found that models that assume tonic excitation (μ > 0) in addition to salience inputs can predict elevated baseline firing rates as observed in our movement neuron sample. Note, however, that movement neurons with little or no tonic firing rate are commonly observed (Paré and Hanes, 2003).
Gating inhibition.
Effective visual search performance requires that saccades be withheld until visually responsive neurons have processed stimulus salience. The model solves this problem with a combination of gating and lateral inhibition. Computationally, g is a tonic inhibition applied to the salience input, which is rectified to be >0 after the inhibition is applied (Eq. 2). Functionally, gating imposes a firing rate that must be exceeded before the inputs from visually responsive neurons begin to influence the accumulators. All models assumed that gating is independent of set size and stimulus strength. We assumed a tonic inhibition for computational simplicity and because it could be easily implemented by neurons (see Discussion, Neurophysiological implications). The precise form of nonlinearity mediating the transformation from visually responsive neurons to accumulator units is probably not critical, so long as accumulator units have little or no response until the inputs exceed some critical level. Alternative nonlinearities, such as sigmoid or power functions, may also work if the slope or acceleration is sufficiently steep (Simen et al., 2006; Simen and Cohen, 2009).
Figure 2B illustrates how gating inhibition and lateral inhibition mediate the transformation of salience into response accumulator dynamics. Drive from visually responsive neurons exists even before the search array appears, but no accumulation takes place because baseline input firing rates are below the gate. By 100 ms after array presentation, visually responsive neuron firing rates exceed the gate, but top-down salience has not yet emerged. Salience for targets and distractors is equal and balanced; lateral competition holds the system at a temporary equilibrium. After 150 ms, salience for the target exceeds salience for distractors, which triggers a rise in the accumulator unit encoding the target location. Thus, gating and lateral inhibition explain how the selection of salient saccade targets by visually responsive neurons is transformed into a competition for saccade execution in movement neurons.
Alternative model architectures.
We evaluated several different model architectures by fixing various subsets of the parameters in Equation 2 to zero and varying others to fit search performance. Different model architectures instantiate competing hypotheses about the processes that lead to the observed response. We compared models on their quality of fit to search performance (see below, Fits to visual search performance) and their ability to predict the time course of movement neuron activity (see below, Measures of movement neuron and accumulator dynamics). Models that failed to fit the observed pattern of behavior, that fit significantly worse than alternative model architectures, or that failed to predict movement neuron dynamics were rejected. This application of strong inference (Platt, 1964) enabled us systematically to eliminate several plausible neural architectures for using salience to make saccades.
The best-performing model architecture across all of our criteria was the gated competitive model (see Figs. 4–7, 12). This model was defined by setting ud = 0 (no feedforward inhibition) and included gating inhibition, leakage, and lateral inhibitory connections between units (8 free parameters). The term “gated accumulator model” refers to this particular architecture unless otherwise specified.
Figure 4.

Gated competitive accumulator model fits to pooled search performance. A, Mean observed (circles) and predicted (lines) correct (solid) and error (dashed) response times for set size 2 (blue), 4 (green), and 8 (red). B, Mean observed and predicted percent correct. C, D, Observed cumulative response time distribution quantiles (circles) and predicted response time distributions (lines) for correct (C) and error (D) responses.
Figure 5.

Gated competitive accumulator model fits to individual monkey search performance. A, B, Observed correct response time quantiles and predicted response time distributions for monkey Q (A) and monkey S (B). Insets show observed and predicted percent correct. C, D, Observed error response time quantiles and predicted response time distributions for monkey Q (C) and monkey S (D). Conventions as in Figure 4.
Figure 6.

Movement neuron and gated accumulator dynamics. A–C, Spike density functions for FEF movement neurons conditionalized on set size (A, 2; B, 4; C, 8) and response time (dark, fast; intermediate, medium; light, slow). Fast, medium, and slow spike density functions were generated from 10 trials sampled at the 20th, 40th, and 80th RT percentile, respectively, to avoid averaging distortions. D–F, Simulated neural dynamics from the best fitting parameters of the gated accumulator model to the pooled dataset (Table 1).
Figure 7.
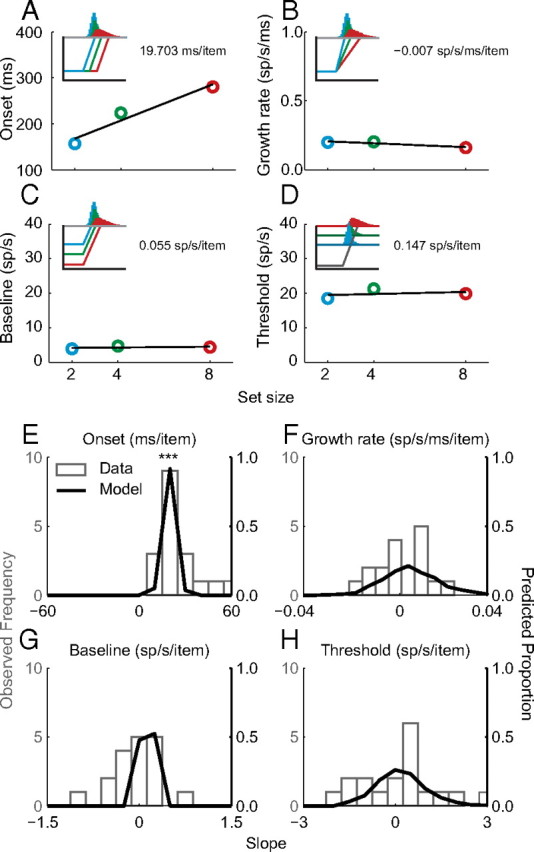
Quantification of movement neuron and gated competitive accumulator model dynamics across set size. A--D, Onset of the presaccadic burst (A), growth rate of firing rate rise to threshold (B), baseline firing rate (C), and presaccadic firing rate threshold (D) as a function of set size for a representative neuron (see Materials and Methods). Black line illustrates the slope of each measure of neural dynamics as a function of set. The insets illustrate the idealized expected dynamics if a given measure accounts for variability in set size. E–H, Population of slopes of each measure of neural dynamics as a function of set size for FEF movement neurons (open gray bars; 22 neurons) and simulated model dynamics (black lines, 500 simulations). Asterisks denote cases where the distribution of movement neuron slopes is significantly different from zero (Wilcoxon rank sum test, ***p < 0.001).
We evaluated two alternative model architectures that did not assume competitive interactions. The gated race model (see Fig. 9A) was defined by setting ud = 0 and βd = 0; this model included gating inhibition and leakage, but no competition (4 total free parameters). The gated diffusion-like model (see Fig. 9B) was defined by setting βd = 0; this model included gating inhibition, leakage, and feedforward, but not lateral, inhibitory connections (8 total free parameters). We also evaluated a model with both diffusion-like and competitive interactions (12 total free parameters), but the fit was not significantly improved relative to the gated competitive model.
Figure 9.
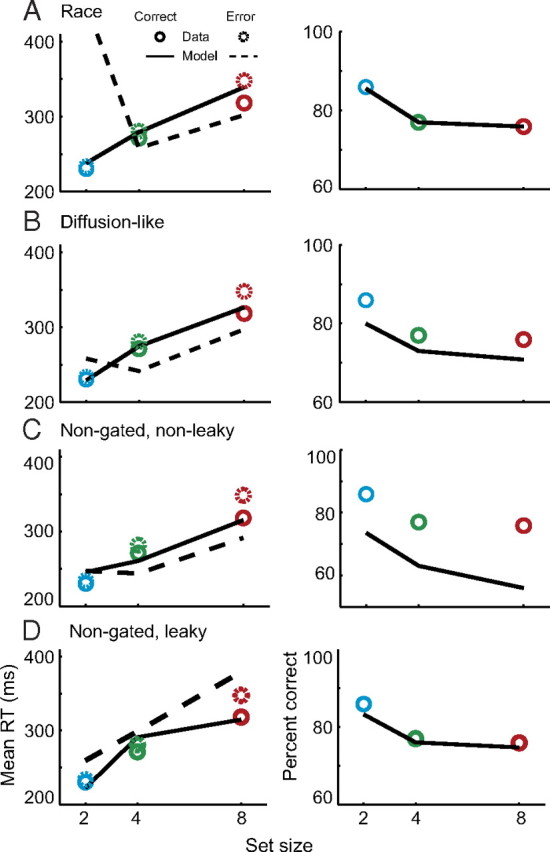
Rejection of alternatives to gated competitive accumulation. A–D, Mean correct and error response times (left) and percent correct (right) for observed data and model predictions from alternative architectures. Poor performance of a gated independent race architecture (A, βd = 0, ud = 0); gated diffusion-like architecture (B, βd = 0, ud is fit); nongated, nonleaky architecture (C, k = 0, g = 0); and nongated, leaky architecture (D, g = 0). Conventions as in Figure 4.
We evaluated two other model architectures without gating inhibition. The nongated, nonleaky model (see Fig. 9C) was defined by setting ud = 0, k = 0, and g = 0; this model included lateral inhibition, but integration of the salience occurred without loss (6 total free parameters). The nongated, leaky model (see Figs. 9D, 10) was defined by setting ud = 0 and g = 0, and included leaky integration and lateral inhibition, but no gating inhibition (7 total free parameters).
Figure 10.
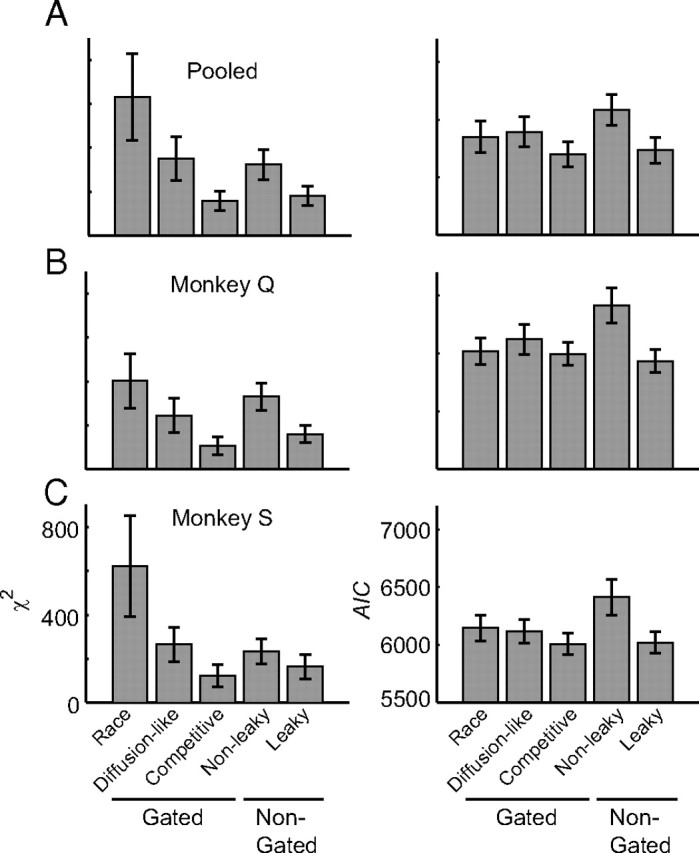
A–C, Fit summary for alternative model architectures fit to pooled (A), monkey Q (B), and monkey S (C) search performance data. Values are median χ2 (left) or AIC (right) ± 95% confidence interval (nonparametric bootstrap; 5000 simulations).
Fits to visual search performance.
We identified parameter values that best fit search performance. We simulated 5000 trials to generate RT distributions and response probabilities for each set size. All models were fit to behavioral data using a custom combination of a genetic algorithm (Goldberg, 1989) with a Simplex routine (Nelder and Mead, 1965) implemented in MATLAB (The MathWorks). Parameters were optimized to fit both pooled and individual monkey performance (Table 1). We used a Pearson χ2 statistic to quantify the discrepancies between the frequency of observed and predicted RTs falling within time bins defined by the 10th, 30th, 50th, 70th, and 90th percentiles (Van Zandt, 2000; Ratcliff and Tuerlinckx, 2002). The χ2 statistic was summed across each set size condition and choice as follows:
 |
The summation over i indexes response time bins defined by the quantiles of the observed response time distribution corresponding to the cumulative probabilities of 0.1, 0.3, 0.5, 0.7, and 0.9. Oi represents the observed proportion of response times, and Pi represents the predicted proportion of response times within the bins. With these quantiles, the six Oi values are 0.1, 0.2, 0.2, 0.2, 0.2, and 0.1, respectively. Pi values are the predicted proportion of response times falling within each bin. The probabilities are converted to frequencies by multiplying by the observed number of data points, n. The summation over r indexes responses (correct, error), and the summation over s indexes set size (2, 4, 8). We count the number of predicted responses falling within each response time distribution; therefore, minimizing this statistic simultaneously fits both the observed response probabilities and the response time distribution (Van Zandt, 2000).
We used a second statistic, the Akaike information criterion (AIC), a penalized maximum likelihood statistic, to test whether improvements in fit can be explained by increases in the number of free parameters (Bozdogan, 2000). The formula for this statistic is as follows:
 |
where Oi and Pi are the same as described above. M is the number of free parameters in the model.
We used nonparametric bootstrapping to compare goodness of fit and gauge the reliability with which optimally fitting parameters could be estimated (Efron and Tibshirani, 1993; Wichmann and Hill, 2001). We randomly sampled, with replacement, sets of responses (correct or error) and response times equivalent to the average number of trials in a session (2137 trials). We fit each model to sampled data 5000 times using different initial states and pseudorandom number generator seeds to account for noise in the fit statistic and parameter estimates. SE and confidence intervals were determined directly from the resulting distributions of fit statistics and estimated parameters. Simulations were run in parallel on a high-performance computing cluster supported by the Vanderbilt Advanced Center for Computing for Research and Education.
Measures of movement neuron and accumulator dynamics.
Following Woodman et al. (2008), we analyzed four changes in movement neuron dynamics related to changes in RT across and within set size: (1) baseline firing rate before search array presentation; (2) onset of presaccadic firing rate increase; (3) growth rate of this increase to threshold; and (4) the presaccadic firing rate threshold immediately before a saccade. Trials in which a saccade was made to the neuron's movement field were sorted by RT and binned into groups of 10 to analyze the relationship of movement neuron dynamics to RT. A bin size of 10 was selected because averaging eliminates some noise, but RT variability within a bin is small enough to avoid distortions due to averaging across trials with very different RTs. Only neurons recorded for at least 30 trials (3 bins) were included for a particular set size, which precluded an analysis of error trials.
To calculate the onset of activation, we used a sliding-window algorithm (±20 ms) that moved backward in 1 ms increments beginning 15 ms before the mean time of saccade initiation for the bin being analyzed. The onset of activation was determined to be the time when the following three criteria were met: (1) activity no longer increased according to a Spearman correlation (α = 0.05) within the window around the current time; (2) activity at that time was lower than activity during the 20 ms preceding saccade onset; and (3), as the window was moved backward in time, the correlation remained nonsignificant for 20 ms. Results were qualitatively similar when the onset was computed as the time point when activity first exceeded two SDs above baseline. The growth rate was the slope coefficient of a least-squares regression line fit to the activity from 100 to 15 ms presaccade. Baseline was computed as the average firing rate in the 200 ms before the appearance of the search array. Threshold was computed as the average firing rate between 10 and 20 ms before saccade (Hanes and Schall, 1996).
To allow commensurate statistical comparisons of models and neurophysiology, model dynamics were analyzed in the following way: (1) we simulated gated accumulator model trajectories using the best fitting parameters to search performance from the pooled dataset; (2) we normalized and rescaled the model trajectories by the threshold firing rate observed in recorded movement neurons; (3) we generated one spike train for each trial according to a time inhomogeneous Poisson process with the rate given by the model activation trajectory for that trial; and (4) we binned the simulated spike trains into groups of 10 trials according to the predicted RT and generated a spike density function from the predicted spikes exactly as was done for the actual spikes. This transformed a model prediction in terms of spikes per second into a single predicted spike train. These steps were repeated 500 times using numbers of simulated trials matched to actual numbers of trials recorded from individual movement neurons.
We analyzed how each measurement accounted for variation in RT across and within set size. To determine how changes in each measure accounted for variation in RT across set size, we averaged each measure across bins and computed the slope of the average measure as a function of set size. To determine how changes in each measure accounted for variation in RT within each set size, we computed the correlation coefficient between each measurement and the mean RT for all bins of trials. We report median measures of neural dynamics ±SE of the median, which was obtained using a statistical bootstrap approach (1000 samples).
It is critical to emphasize that all predicted accumulator dynamics were generated using parameters first optimized to fit search performance. No parameters were hand-tuned to match neural dynamics. Thus, the simulated model dynamics are true predictions and not optimized fits to physiology. As predictions, we focus on the general changes in response dynamics across and within conditions, as opposed to specific details likely to be idiosyncratic to particular neurons.
Receiver operating characteristic analysis.
We assessed how reliably FEF neurons signaled the target location by computing the area under the receiver operating characteristic (ROC) curve from the distribution of trials in which the target appeared inside the receptive field of the neuron and trials in which the target appeared outside the receptive field (Thompson et al. 1996). The ROC was computed by incrementing a criterion from 0 spikes/s to the maximum firing rate observed across all trials in steps of 1 spike/s. For this analysis we measured the average area under the ROC curve from 100 to 200 ms after array presentation.
Speed–accuracy trade-off simulations.
We explored how the gated competitive accumulator model could accomplish speed–accuracy trade-offs by systematically varying two key parameters of the model. We computed the mean RT, percentage correct, and expected reward rate while varying the gate or threshold parameters and fixing all other parameters at the values fitted to pooled performance data. Each simulation consisted of 700 trials of each set size corresponding approximately to the average number of trials in an actual recording session. Reward rate is defined by r = P/T, where P is the average proportion of correct choices across all set size conditions and T is the average trial duration (Gold and Shadlen, 2002; Lo and Wang, 2006). T was defined by the following equation:
 |
where p is the response proportion and RT is the average RT for each set size, s (2, 4, or 8), and response, r (correct or error). The intertrial interval, ITI, was 1 s as in the experiment protocol. Confidence intervals were computed from the distribution of reward rates obtained by simulating expected reward rate 1000 times for each set of parameters with randomly sampled inputs.
Results
Visual search behavior and neurophysiology
We modeled behavior and neurophysiology observed from macaque monkeys trained to perform an attentionally demanding visual search task (Fig. 1A), details of which have been previously published (Cohen et al., 2009; Heitz et al., 2010). Monkey behavior exhibited hallmarks of inefficient search as observed in humans. The percentage correct declined (Fig. 1A) and mean RTs increased (Fig. 1B,C) with increasing set size (Cohen et al., 2009). Monkeys also exhibited substantial variability in RTs within each set size (Fig. 1B,C, insets). The variance of the distribution increased with set size and there was a systematic lengthening of the upper tail of the distribution, which is also observed in human search performance (Ward and McClelland, 1989; Palmer et al., 2011). No current model of search explains full response time distributions (Wolfe et al., 2010) or the neural source of this variability. Our new model explains both the systematic and random variability in RTs using single-unit physiology recorded during visual search.
The first observation guiding our modeling is that visually responsive neurons in FEF, SC, and lateral intraparietal area (LIP) appear to encode the salience of potential saccade targets. All single-unit data in the present report were collected in FEF, but we note that neurons with very similar response properties are observed in other sensorimotor areas. Thus, although we used the discharge rate of visually responsive FEF neurons as the model input, we believe that similar results would be observed using discharge rates from visually responsive SC or LIP neurons. During the visual search task, the firing rates of visually responsive neurons increase following the onset of the search array and are maintained at a higher level when the target is within the cell's RF (Fig. 3A). The average time of target selection increases with set size and the average firing rate decreases with set size (Cohen et al., 2009). Decreases in the average firing rate with set size have also been reported in LIP (Balan et al., 2008). In addition, we found that visually responsive neurons signaled the location of the target less reliably as set size increased, as indicated by a decline in the average (±SE) area under the ROC curve (set size 2, 0.63 ± 0.05; set size 4, 0.55 ± 0.03; set size 8, 0.54 ± 0.03). All differences were significant (paired t test, all p < 0.05). These changes may reflect the limited capacity of the visual system to simultaneously analyze all stimuli in the visual field, although we cannot make strong claims about the specific mechanisms responsible for this limitation. Importantly, the decrease in firing rate with set size is consistent with the identification of these neurons as encoding visual salience. A model that explains how salience is translated into a saccade command must explain how these firing rate dynamics are read out to initiate a saccade.
Figure 3.

Frontal eye field physiology during visual search. A, B, Normalized population firing rates for FEF visual (A) and movement (B) neurons during visual search with set size 2 (blue), 4 (green), and 8 (red). Spike density functions were generated from trials in which the target (thick) or a distractor (thin) was inside the RF of the neuron. Spike density functions are aligned on the stimulus array presentation (left) and saccade (right). Stimulus-aligned spike density functions end at the median RT.
The second observation guiding our modeling is that movement neurons in FEF and SC initiate saccades at a fixed firing rate threshold. Note that LIP has very few movement neurons without visual responses (Gottlieb and Goldberg, 1999) and LIP neurons do not project directly to oculomotor brainstem nuclei. Therefore, we do not identify our model accumulator with LIP neurons. Figure 3B illustrates the population response of FEF movement neurons during the T/L search task. In contrast to the firing rates in the visual neuron population, the firing rates of these neurons converge at a fixed firing rate threshold immediately before the saccade regardless of the set size and RT. This adds to converging evidence that presaccadic movement neurons initiate a saccade when a fixed firing rate threshold is reached (Hanes and Schall, 1996; Hanes et al., 1998; Paré and Hanes, 2003). A model that explains how stimulus salience is translated into a saccade command must also explain how presaccadic movement neurons are driven to threshold.
Gated competitive accumulation explains search performance
The gated accumulator model quantitatively accounts for all aspects of visual search performance. We optimized parameters to simultaneously fit the observed choice probabilities and RT distributions for both correct saccades to the target and error saccades to distractors (Table 1). Figure 4 compares observed search performance with simulated performance of the network. The model accounts for the increase in mean RT with set size (Fig. 4A) because the average firing rate of visually responsive neurons declines with set size (Fig. 3A) and because neurons encoding competing locations are increasingly active due to the presence of distractors in their RF. In other words, as set size increases, more locations become activated on the salience map. The model accounts for the decrease in percent correct with set size because increased activation at competing locations decreases the reliability with which the target can be discriminated and because visually responsive neurons select distractors when the monkey makes an error (Thompson et al., 2005a; Heitz et al., 2011). Predicted errors are slow relative to correct responses because firing rates are lower, on average, on error trials. Thus, the properties of visually responsive neurons coupled to a network of stochastic accumulators have exactly the properties necessary to explain the basic properties of search performance. Although we only manipulated set size here, we note past results showing that visually responsive neuron firing rates decrease with target–distractor similarity as expected of a salience representation (Bichot and Schall, 1999; Ipata et al., 2006; White and Munoz, 2011). This is exactly the pattern of modulation that would be required for our model to predict the observed decreases in performance with increased target–distractor similarity, as we have demonstrated previously (Purcell et al., 2010).
The model explains the basic changes in mean RT and accuracy during inefficient visual search, which must be true for any viable model of search, but a more rigorous evaluation of model performance would determine whether the model can predict full RT distributions. Figure 4 plots the observed and predicted RT distributions for correct (Fig. 4C) and error (Fig. 4D) trials for each set size condition. The model captures the increasing spread and the systematic lengthening of the upper tail of the distribution, which is characteristic of inefficient visual search in humans and our monkeys (Wolfe et al., 2010; Palmer et al., 2011). We verified that this was also true for individual monkeys (Fig. 5). These results demonstrate that nearly all of the variability in search performance can be explained by a gated accumulation of the neural representation of stimulus salience.
Gated competitive accumulation predicts dynamics of presaccadic movement activity
We identify model accumulator units with movement neurons in FEF and SC. If this mapping is correct, then accumulator dynamics should correspond to movement neuron dynamics observed during visual search. Figure 6A–C plots observed movement neuron spiking dynamics for slow, intermediate, and fast responses within each set size condition. The onset of neuronal modulations is later, on average, when the monkey responds slower whether within or across set size conditions (Woodman et al., 2008), but there is little change in the rate of growth across set size when aligned on saccade initiation. The apparent differences in rate of growth when aligned on array onset are merely a consequence of averaging across trials with different RTs. Consistent with a fixed response threshold, the presaccadic firing rate remains constant regardless of task difficulty or response speed. The onset of activation also increases within each set size condition and there is a slight decline in the rate of growth to threshold.
Figure 6D–F plots the average simulated trajectories sorted according to the same procedure as the movement neuron data. We simulated each set size condition 5000 times and generated spike trains according to a Poisson process with a nonhomogenous rate given by the simulated model trajectories (see Materials and Methods). The model qualitatively captures key physiological observations in the movement neurons. The time when the accumulated activation first modulates above baseline increases across and within set size. When aligned on saccade initiation, there is little or no change in the rate of growth across set size and only marginal change in the rate of growth within set size. Finally, the model reaches a fixed threshold before the response by design.
Following Woodman et al. (2008), we quantified four measures of neural dynamics to verify the correspondence between accumulators and movement neurons: delays in the onset of the presaccadic rise (onset), the average rate of rise (growth rate), the starting point (baseline), and the firing level at the time of saccade (threshold; see Materials and Methods). All simulations used parameters fitted to search performance (Table 1). Critically, no parameters were adjusted to generate predicted model dynamics.
First, for the across set size assessment, we computed the average of each measure across RT groups and computed the least-squares regression slope of that measure as a function of set size. Figure 7A–D shows the resulting slopes for a representative movement neuron. Only the onset of accumulation increases significantly with set size. Figure 7E–H shows the resulting slopes for the population of all movement neurons (bar histogram) and simulations of the gated competitive accumulator model (line histogram). Across the movement neuron population, the median slope of onset as a function of set size is significantly >0 (14.4 ± 2.5 ms/item; Wilcoxon rank sum test, p < 0.001), but does not differ significantly from the median slope of model predictions (14.9 ms/item, p = 0.47). No other slope distribution was statistically different from zero or from model predictions (all p ≥ 0.05). Thus, the model predicts changes in neural dynamics with changes in set size comparable to observed movement neuron dynamics.
Next, for the within set size assessment, we computed the correlation between each measure of neural dynamics and RT within each set size independently. Figure 8A–D illustrates the correlation between each measure of neural dynamics and RT bins from a representative neuron recorded during set size 4 trials. Only the onset of the presaccadic burst correlates significantly with response time (Fig. 8A), although there is a small, but nonsignificant, decrease in the rate of growth (Fig. 8B). Figure 8E–H plots the median observed correlation between each measure of neural dynamics and RT across the population of movement neurons for all set sizes. The median correlation is significantly >0 for the onset of the presaccadic burst (Fig. 8E; Wilcoxon rank sum test, set size 2, 0.67 ± 0.12; set size 4: 0.81 ± 0.05; set size 8, 0.93 ± 0.02; all p < 0.01). We also observed a weak correlation between baseline and RT in set size 2 that was marginally significant (Fig. 8G; set size 2, −0.24 ± 0.07, p = 0.04), but no other measures of neural dynamics correlated significantly with RT (all p > 0.05). Importantly, the strength of correlation with RT was statistically indistinguishable between movement neurons and model predictions for most measures of neural dynamics (all p > 0.05). The only exceptions were the median correlation between baseline and RT for set size 4 (data, 0.03; model, −0.29; p = 0.02) and between threshold and RT for set size 4 (data, 0.12; model, −0.17; p = 0.03), which differed slightly, but significantly, from the data. However, the lack of a systematic relationship with set size suggests that this deviation can be attributed to noise. Thus, the model predicts the essential quantities seen in the neural dynamics using the same parameters that were optimized to fit search performance.
Figure 8.
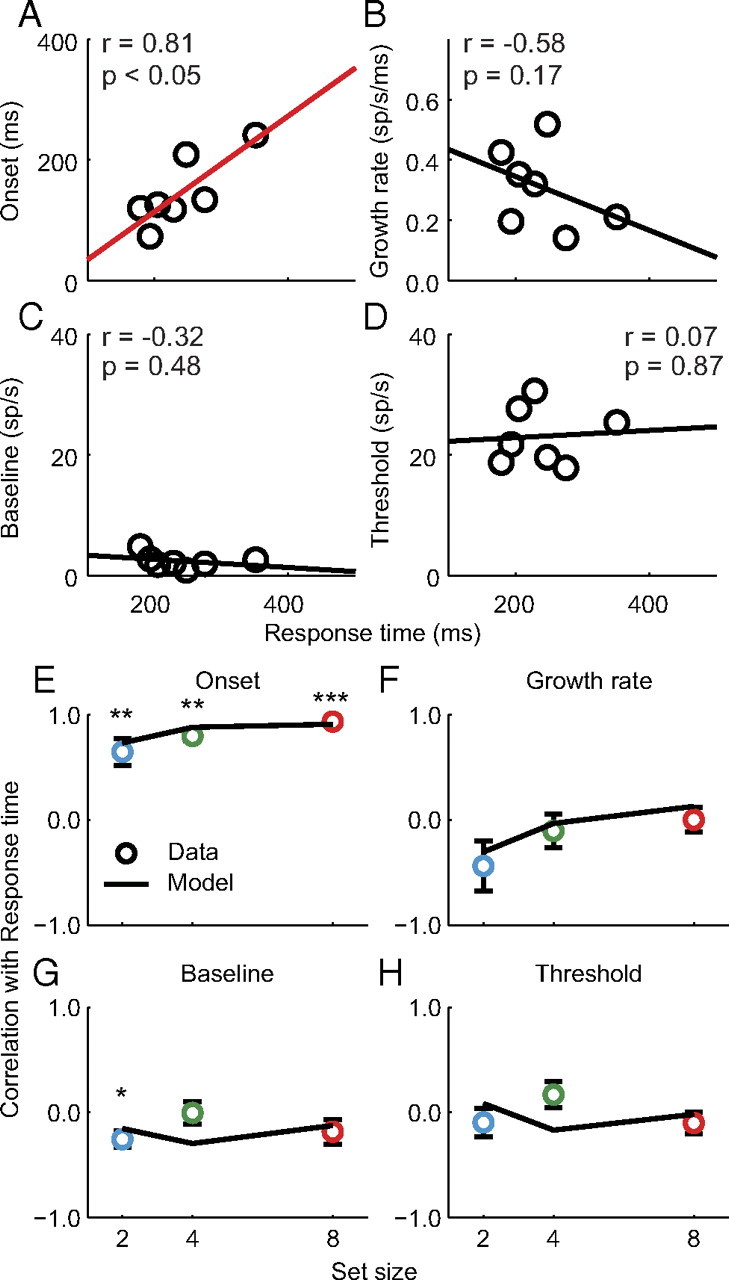
Quantification of movement neuron and gated competitive accumulator model dynamics across response time bins within each set size. A–D, Onset of the presaccadic burst (A), growth rate of firing rate rise to threshold (B), baseline firing rate (C), and presaccadic firing rate threshold (D) as a function of RT bins for a representative neuron (see Materials and Methods). For simplicity, only set size 4 is shown. Lines illustrate the least-squares regression line fit to the data. Red lines indicate significant Pearson correlation coefficients (p < 0.05). E–H, Median correlation between each measure of neural dynamics and response time for observed movement neurons (circles) and simulated model dynamics (lines). Error bars indicate SE of the median for observed data (bootstrap; 1000 samples). Asterisks indicate median correlations that significantly differed from zero (Wilcoxon rank sum test, *p < 0.05; **p < 0.01; ***p < 0.001).
Gating inhibition and lateral competition are necessary
Using the logic of nested model testing, we determined which model elements are necessary to account for visual search performance and replicate movement neuron physiology. First, we explored a gated race model architecture without competitive interactions (all βd = 0). This architecture qualitatively failed to predict the ordering of mean error RTs (Fig. 9A). This architecture failed because it has no mechanism to suppress the initial visual responses that drive saccades to distractors. Quantitatively, this produced significantly elevated χ2 relative to the gated competitive model for both individual and pooled monkey data (p < 0.05, nonparametric bootstrap, 5000 simulations; Fig. 10). The difference was not statistically significant using AIC (all p > 0.05), but there are several reasons to believe that this additional complexity is warranted. First, the gated race model cannot predict the correct ordering of error RTs and therefore qualitatively fails to predict a key component of visual search performance. Second, the need for competition is supported by studies demonstrating that microstimulation of FEF can suppress firing rates in the opposite hemisphere (Schlag et al., 1998) and that the presentation of a visual distractor in the ipsilateral visual field reduces the firing rate of SC movement neurons (Dorris et al., 2007). Last, existing theoretical work has demonstrated some form of competitive interaction is necessary to optimize the rate of reward for a set amount of sensory evidence (Bogacz et al., 2006). Thus, some form of competitive interaction appears to be necessary.
We next explored a diffusion-like gated accumulator model with feedforward inhibition between model inputs but no competition between model units (all ud were allowed to vary, but all βd = 0). This architecture failed to predict both the ordering of error RTs and the observed percentages of correct responses (Fig. 9B). We observed a significantly worse fit for this model than the gated competitive model for all datasets whether or not model complexity is taken into account (all p < 0.05; Fig. 10). This model fails because some mechanism must suppress the initial visual responses to distractor locations, but feedforward inhibition must necessarily be weak when the number of interacting accumulators is >2. If feedforward inhibition is strong, then the inhibition from distractors will overwhelm excitation to the target location, resulting in excessively long RTs (Usher and McClelland, 2001). These results appear to challenge the generality of a large class of drift diffusion models that require feedforward inhibition for their neurophysiological implementation (Gold and Shadlen, 2001; Bogacz et al., 2006; Ratcliff et al., 2007; Churchland et al., 2008; Ditterich, 2010; Purcell et al., 2010).
To investigate the necessity of gating inhibition and leakage, we explored a nongated, nonleaky model architecture with lateral inhibition but no gate or leak. This architecture failed to quantitatively predict both correct and error RTs as well as the percentage of correct responses (Fig. 9C). The fit was significantly worse than that of the gated competitive model even when taking into account differences in model complexity (Fig. 10). It fails because tonic activity of visually responsive neurons propagates directly to accumulators that initiate saccades before salience can be computed. Thus, some mechanism is needed to limit the rate of integration until an informative salience signal can be generated. Leakage, gating, or both leakage and gating are each viable mechanisms for limiting the rate of integration.
To investigate the necessity of gating inhibition, we explored a nongated, leaky architecture with lateral inhibition and leakage, but no gating inhibition. This architecture accounted qualitatively for the basic pattern of search performance (Fig. 9D). Although the fit appears qualitatively worse than that of the gated competitive model architecture, this difference was not statistically significant for both fit statistics and all datasets (Fig. 10). We previously found the same result using a simplified two-accumulator model framework (Purcell et al., 2010). Thus, leaky and gated models cannot be discriminated by behavioral data alone even in this more complex network that explains richer behavioral data. However, gated accumulation is necessary for the accumulators to replicate movement neuron dynamics. Models that do not include gating predict a strong negative correlation between the baseline and RT that is not observed in the data. Figure 11 shows that this result replicates in a multiple-accumulator framework. Thus, gating inhibition is necessary to explain movement neuron physiology during visual search.
Figure 11.
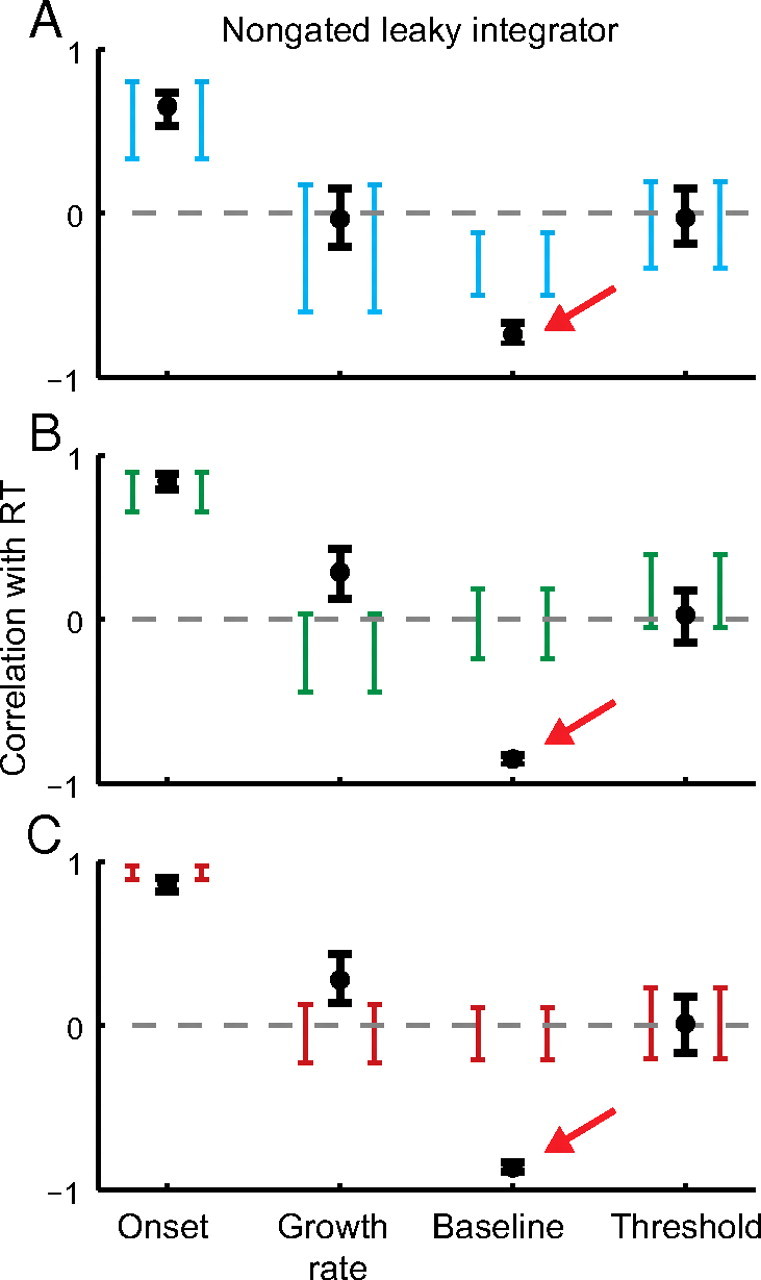
Models with no gate fail to predict observed movement neuron dynamics. A–C, Observed (brackets) and predicted (points) median correlation between response time and four measures of neural dynamics for set size 2 (A), 4 (B), and 8 (C). Brackets and error bars are 95% confidence intervals around the observed and predicted median correlation, respectively (bootstrap; 1000 simulations). Red arrows highlight the key difference between the predicted and observed baseline correlation with RT (Purcell et al., 2010).
Control of speed–accuracy trade-off
Most stochastic accumulator models assume that adjustments in speed and accuracy are controlled via adjustments in the height of the response threshold (Gold and Shadlen, 2002; Bogacz et al., 2006; Lo and Wang, 2006; Nakahara et al., 2006; Simen et al., 2006; Ratcliff and McKoon, 2008). However, no current study has reported changes in threshold firing rate at the level of individual neurons. In fact, recent neurophysiological evidence indicates that systematic adjustments of RT are accomplished through changes in the onset of accumulation (Pouget et al. 2011). We found that the gated accumulator model produces a speed and accuracy trade-off when either threshold or gating inhibition is varied. Rather than fit parameters to data, as in the preceding section, we manipulated the level of the threshold or the gate while fixing all other parameters at values fitted to pooled search performance. When the threshold increases, the system is more likely to correctly locate and respond to the target, but requires more time to accumulate additional salience (Fig. 12A, inset). When the gate increases, visual salience is processed to a higher resolution before it begins to drive saccade initiation (Fig. 2B), which improves accuracy but delays the start of accumulation (Fig. 12B, inset). Thus, gating inhibition provides an alternative account for trade-offs between speed and accuracy during visual search.
Figure 12.

Threshold and gating inhibition can explain speed–accuracy trade-offs. A, B, Mean expected reward rate as a function of the threshold (A) and gate (B) values when other parameters are fixed at the values that best fit the pooled search performance. Insets show simulated mean percent correct (black) and RT (gray) corresponding to the parameter values used to simulate the reward rates in A and B. Each point is calculated by a simulated session with 700 trials per set size, which approximates the average number of trials recorded per session. Error bars are 95% confidence intervals around the mean, which may be asymmetric due to skewed distributions (bootstrap; 1000 simulations). The red points show expected reward rate using parameters that best fit the animal's performance. C, D, Gated accumulator dynamics for threshold (C) and gate (D) spanning a range of reward rates. Each trajectory reflects the average of 1000 simulated trajectories for a given set of parameters. As threshold increases, the accumulation begins at the same time, but reaches progressively higher levels. As gate increases, baseline activity decreases and accumulation begins rising later.
Mechanisms that trade speed for accuracy should optimize behavior. As one measure of optimization, we computed the expected reward rate as a function of threshold and gate. Consistent with previous studies, we found that varying threshold produced a nonmonotonic change in the expected reward rate such that a range of threshold values maximized reward (Fig. 12A). However, we also found that systematically varying the level of the gate produced a nonmonotonic change in reward rate (Fig. 12B). Furthermore, the value of threshold and gate that best fit the monkey's performance fell within the range of parameter values that maximized reward rate. This suggests that after extensive practice, the circuitry of the network responsible for visual search performance adapted precisely to optimize performance.
Monkeys could strategically adjust their performance via adjustments in threshold or gating, but the alternative mechanisms are indistinguishable in terms of both maximal reward rate and robustness to parameter variation. However, the alternative mechanisms make clearly distinguishable predictions about how movement neuron dynamics should change when monkeys emphasize speed or accuracy. Increases in threshold will increase the presaccadic firing rate of neurons (Fig. 12C), whereas increases in gating will decrease the baseline and delay the beginning of accumulation of activity leading to the saccade (Fig. 12D). New data from tasks in which animals are explicitly cued to trade speed and accuracy can be incorporated into our modeling framework to discriminate these alternative mechanisms.
Discussion
We formalized and tested a model of visual search comprised of a network of gated, competing units that accumulate a dynamic salience representation. The model accounts for the probabilities and RTs of correct and error saccades and also replicates the dynamics of presaccadic movement neurons by identifying them with the process of accumulating salience. The model also provides a new perspective on the mechanism for speed–accuracy adjustments.
A neurophysiologically constrained account of visual search
Visually responsive neurons in FEF, LIP, and SC have been identified as a neurophysiological salience map (Findlay and Walker, 1999; Thompson and Bichot, 2005; Fecteau and Munoz, 2006; Gottlieb, 2007; Bisley and Goldberg, 2010) because these neurons modulate their firing rate according to both physical properties of the stimuli in the display (Bichot and Schall, 1999; Ipata et al., 2006; White and Munoz, 2011), reflecting bottom-up salience, as well as variables that determine the significance of a stimulus, such as its expected reward (Ding and Hikosaka, 2006) or stimulus history (Bichot et al., 1996; Bichot and Schall, 1999, 2002; Sato et al., 2003), reflecting top-down salience. This salience representation does not depend on response or effector (Thompson et al., 1997, 2005b; Bisley and Goldberg, 2003; Sato and Schall, 2003; Gottlieb et al., 2005; Murthy et al., 2009; White and Munoz, 2011).
We used the salience representation provided by visually responsive neurons in FEF to investigate the mechanisms that translate salience into saccades. This is the first model to explicitly link the neural representation of salience to a multiple-alternative stochastic accumulator network. Some previous search models include stochastic accumulation, but these have only been formulated conceptually (Wolfe, 2007) or are not grounded in physiology (Ward and McClelland, 1989; Thornton and Gilden, 2007). We previously modeled correct search RTs using a simple two-unit accumulator network (Purcell et al., 2010). This preliminary model accounted for systematic variation of RT with search efficiency, but the dataset was insufficient to investigate error rates or set size effects; therefore, it was not a viable model of visual search. The behavioral and neurophysiological data modeled here impose substantially greater model constraint.
We found that gating inhibition is necessary to limit the accumulator input until explicit visual salience is present. Many models assume a static salience representation (Palmer et al., 2000; Navalpakkam and Itti, 2007), but the neural representation of salience evolves dynamically over time (Fig. 3A). In our model, saccade preparation cannot begin until the visual response exceeds the gate and an informative salience signal evolves (Fig. 2B). This mechanism contrasts with all previous stochastic accumulator models that require the ad hoc assumption that accumulation is simply delayed by an arbitrary nondecision time parameter (Lo and Wang, 2006; Ratcliff et al., 2007; Churchland et al., 2008; Stanford et al., 2010). Other work has demonstrated that balanced excitation and inhibition can delay the onset of accumulation (Furman and Wang, 2008), but such a system can be susceptible to perturbations that can disrupt stability, leading to premature threshold crossings.
Extending perceptual decision tasks to multiple stimuli
Several frameworks have been proposed to explain perceptual decisions about individual stimuli. Many such frameworks include discrete or continuous networks of accumulators (Usher et al., 2002; Beck et al., 2008; Churchland et al., 2008; Furman and Wang, 2008; Ditterich, 2010; Leite and Ratcliff, 2010). Some of these models refer to how visually responsive LIP and FEF neurons integrate the firing rates of neurons encoding visual features to categorize information from a single foveal stimulus (Roitman and Shadlen, 2002; Ding and Gold, 2011). However, a general theory of perceptual decision making must explain more complex conditions involving multiple stimuli, not just multiple responses. These models identify the same visually responsive neurons that encode salience with accumulators that signal the end of stimulus categorization when discharge rates reach a fixed threshold. However, the dynamics of these neurons are markedly different during search tasks where one or more stimuli appear abruptly in the RF of the neuron and must be categorized and selected to guide response selection. The initial visual response often exceeds the presaccadic firing rate, and these neurons do not reach a fixed threshold before saccade initiation (Fig. 3A) (Hanes et al., 1998; Brown et al., 2008). Therefore, we propose a new framework to account for neural dynamics and search performance.
According to this framework, visual neurons in FEF, SC, and LIP have already integrated and reweighted sensory inputs according to task demands before being input to the accumulator network. This interpretation is consistent with cognitive models of perceptual decision making in which perceptual processing precedes the start of the accumulation process to determine the degree of support for a particular response (Nosofsky and Palmeri, 1997; Logan, 2002). This interpretation also highlights the distinct role of different populations of neurons in decision making. While the decision that a stimulus belongs to a particular category could be identified with selection of the target location by visually responsive neurons in FEF, SC, and LIP, the decision to act requires additional processing by movement-related neurons (Schall, 2001). Our model formalizes this distinction.
Strategic adjustments in speed and accuracy
Threshold adjustments seem to provide a simple and intuitive account of speed–accuracy trade-offs. However, we found that variation of gating inhibition can produce equivalent speed–accuracy trade-offs by either promoting or delaying the accumulation of salience as has been observed in another study (Pouget et al., 2011). This model predicts that changes in gating inhibition will produce a qualitatively different pattern of movement neuron dynamics than changes in threshold when tested during speed–accuracy trade-offs. This also suggests that a neuron that implements the gating inhibition will modulate its firing rate inversely with speed stress.
Other recent models have indicated that speed–accuracy trade-offs can be implemented by a time-varying multiplicative gain or “urgency” signal applied to the inputs to stochastic accumulators (Churchland et al., 2008; Cisek et al., 2009). Increasing noise and variance are intrinsic properties of our neurophysiologically derived model input (Fig. 2B). Our model predicts that this could take place via changes in the firing rates of visually responsive neurons without assuming an explicit multiplicative gain parameter. Altogether, our model makes clear predictions to discriminate alternative accounts of the neural basis of speed–accuracy trade-offs.
Neurophysiological implications
FEF, SC, and LIP neurons have anatomical connectivity to perform the functions proposed by our model. These areas receive inputs from diverse regions of extrastriate visual cortex and prefrontal areas to compute stimulus salience (Blatt et al., 1990; Lui et al., 1995; Schall et al., 1995). Neurons representing visual salience reside in both supragranular and infragranular layers of FEF (Thompson et al., 1996) and intermediate layers of SC (White and Munoz, 2011). Movement neurons reside in layer 5 of FEF and the intermediate layers of SC and project to oculomotor brainstem nuclei that control saccade initiation (Moschovakis et al., 1988; Segraves, 1992; Pouget et al. 2009). Visually responsive LIP neurons could drive SC and FEF movement neurons to threshold via known projections (Blatt et al., 1990; Paré and Wurtz, 2001). The constant presaccadic firing rate observed in FEF and SC movement neurons may correspond to the fixed degree of excitation necessary to tip the balance from gaze holding to gaze shifting via excitation of long-lead burst neurons and inhibition of omnipause neurons (Munoz et al., 2000; Scudder et al., 2002).
Our model assumes that a gating mechanism intervenes between visually responsive and movement neurons. Gating inhibition is a simple operation that can be realized through several different neural mechanisms. First, gating could be implemented by inhibitory interneurons within FEF and SC that can adjust the level of excitation necessary to initiate spiking in individual neurons (Somogyi, 1977; Markram et al., 2004). Simple neural networks that balance interneuron inhibition with self-excitation exhibit bistable dynamics that limit integration until inputs exceed a critical level (Simen and Cohen, 2009). Second, gating could be mediated by FEF and SC fixation neurons, which fire tonically during fixation but cease firing before a saccade at a time coinciding with the onset of movement neuron firing across conditions (Munoz and Wurtz, 1993; Everling et al., 1998; Hanes et al., 1998). Finally, gating inhibition could also be implemented via basal ganglia circuitry as posited by other models (Brown et al., 2004; Frank, 2006). FEF neurons project to the caudate nucleus, which sends inhibitory projections to the substantia nigra pars reticulate (SNpr) (Hikosaka et al., 2000). SNpr neurons cease firing around the time of target selection during search (Basso and Wurtz, 2002). SNpr sends direct projections to SC and to the mediodorsal (MD) and ventroanterior (VA) nuclei (Parent and Hazrati, 1995). MD and VA are thalamic nuclei with saccade-related responses (Tankaka, 2007) and reciprocal connections with FEF (Huerta et al., 1987).
Conclusions
We showed that a feedforward cascade of salience into a network of multiple competing stochastic accumulators can account for visual search performance and replicate the dynamics of neuron activity related to presaccadic movement. By forgoing the details of spike generation in exchange for the ability to relate specific network mechanisms to comprehensive behavioral data, this approach allowed us to reject plausible model architectures and identify key mechanisms necessary and sufficient to explain how the brain decides among multiple stimuli. We can further test our model's premise of a feedforward visual-to-motor cascade by using visually responsive neuron physiology recorded in the context of additional tasks as model input to our framework. Factorial manipulations of search efficiency and set size, variations in stimulus–response mapping, and tasks in which animals are cued to trade speed for accuracy will provided critical tests of the basic model assumptions.
Footnotes
This work was supported by National Institutes of Health Grants NEI RO1-EY08890, NEI P30-EY008126, P30-HD015052, NEI R01-EY21833, and T32-EY07135; National Science Foundation Grants SBE-0542013 and BCS 0957074; and by Robin and Richard Patton through the E. Bronson Ingram Chair in Neuroscience at Vanderbilt University. We thank Geoff Woodman, Jeremiah Cohen, and Richard Heitz for sharing data, and the Vanderbilt Advanced Center for Computing for Research and Education for access to the high-performance computing cluster.
The authors declare no competing financial interests.
References
- Balan PF, Oristaglio J, Schneider DM, Gottlieb J. Neuronal correlates of the set-size effect in monkey lateral intraparietal area. PLoS Biol. 2008;6:e158. doi: 10.1371/journal.pbio.0060158. [DOI] [PMC free article] [PubMed] [Google Scholar]
- Basso MA, Wurtz RH. Neuronal activity in substantia nigra pars reticulata during target selection. J Neurosci. 2002;22:1883–1894. doi: 10.1523/JNEUROSCI.22-05-01883.2002. [DOI] [PMC free article] [PubMed] [Google Scholar]
- Beck JM, Ma WJ, Kiani R, Hanks T, Churchland AK, Roitman J, Shadlen MN, Latham PE, Pouget A. Probabilistic population codes for Bayesian decision making. Neuron. 2008;60:1142–1152. doi: 10.1016/j.neuron.2008.09.021. [DOI] [PMC free article] [PubMed] [Google Scholar]
- Bichot NP, Schall JD. Effects of similarity and history on neural mechanisms of visual selection. Nat Neurosci. 1999;2:549–554. doi: 10.1038/9205. [DOI] [PubMed] [Google Scholar]
- Bichot NP, Schall JD. Priming in macaque frontal cortex during popout visual search: feature-based facilitation and location-based inhibition of return. J Neurosci. 2002;22:4675–4685. doi: 10.1523/JNEUROSCI.22-11-04675.2002. [DOI] [PMC free article] [PubMed] [Google Scholar]
- Bichot NP, Schall JD, Thompson KG. Visual feature selectivity in frontal eye fields induced by experience in mature macaques. Nature. 1996;381:697–699. doi: 10.1038/381697a0. [DOI] [PubMed] [Google Scholar]
- Bisley JW, Goldberg ME. Neuronal activity in the lateral intraparietal area and spatial attention. Science. 2003;299:81–86. doi: 10.1126/science.1077395. [DOI] [PubMed] [Google Scholar]
- Bisley JW, Goldberg ME. Attention, intention, and priority in the parietal lobe. Annu Rev Neurosci. 2010;33:1–21. doi: 10.1146/annurev-neuro-060909-152823. [DOI] [PMC free article] [PubMed] [Google Scholar]
- Blatt GJ, Andersen RA, Stoner GR. Visual receptive field organization and cortico-cortical connections of the lateral intraparietal area (area LIP) in the macaque. J Comp Neurol. 1990;299:421–445. doi: 10.1002/cne.902990404. [DOI] [PubMed] [Google Scholar]
- Bogacz R, Brown E, Moehlis J, Holmes P, Cohen JD. The physics of optimal decision making: a formal analysis of models of performance in two-alternative forced-choice tasks. Psychol Rev. 2006;113:700–765. doi: 10.1037/0033-295X.113.4.700. [DOI] [PubMed] [Google Scholar]
- Boucher L, Palmeri TJ, Logan GD, Schall JD. Inhibitory control in mind and brain: an interactive race model of countermanding saccades. Psychol Rev. 2007;114:376–397. doi: 10.1037/0033-295X.114.2.376. [DOI] [PubMed] [Google Scholar]
- Bozdogan H. Akaike's information criterion and recent developments in information complexity. J Math Psychol. 2000;44:62–91. doi: 10.1006/jmps.1999.1277. [DOI] [PubMed] [Google Scholar]
- Brown JW, Bullock D, Grossberg S. How laminar frontal cortex and basal ganglia circuits interact to control planned and reactive saccades. Neural Netw. 2004;17:471–510. doi: 10.1016/j.neunet.2003.08.006. [DOI] [PubMed] [Google Scholar]
- Brown JW, Hanes DP, Schall JD, Stuphorn V. Relation of frontal eye field activity to saccade initiation during a countermanding task. Exp Brain Res. 2008;190:135–151. doi: 10.1007/s00221-008-1455-0. [DOI] [PMC free article] [PubMed] [Google Scholar]
- Bundesen C, Habekost T, Kyllingsbaek S. A neural theory of visual attention: bridging cognition and neurophysiology. Psychol Rev. 2005;112:291–328. doi: 10.1037/0033-295X.112.2.291. [DOI] [PubMed] [Google Scholar]
- Churchland AK, Kiani R, Shadlen MN. Decision-making with multiple alternatives. Nat Neurosci. 2008;11:693–702. doi: 10.1038/nn.2123. [DOI] [PMC free article] [PubMed] [Google Scholar]
- Cisek P, Puskas GA, El-Murr S. Decisions in changing conditions: the urgency-gating model. J Neurosci. 2009;29:11560–11571. doi: 10.1523/JNEUROSCI.1844-09.2009. [DOI] [PMC free article] [PubMed] [Google Scholar]
- Cohen JY, Heitz RP, Woodman GF, Schall JD. Neural basis of the set-size effect in frontal eye field: timing of attention during visual search. J Neurophysiol. 2009;101:1699–1704. doi: 10.1152/jn.00035.2009. [DOI] [PMC free article] [PubMed] [Google Scholar]
- Constantinidis C, Steinmetz MA. Posterior parietal cortex automatically encodes the location of salient stimuli. J Neurosci. 2005;25:233–238. doi: 10.1523/JNEUROSCI.3379-04.2005. [DOI] [PMC free article] [PubMed] [Google Scholar]
- Ding L, Gold JI. Neural correlates of perceptual decision making before, during, and after decision commitment in monkey frontal eye field. Cereb Cortex. 2011 doi: 10.1093/cercor/bhr178. [DOI] [PMC free article] [PubMed] [Google Scholar]
- Ding L, Hikosaka O. Comparison of reward modulation in the frontal eye field and caudate of the macaque. J Neurosci. 2006;26:6695–6703. doi: 10.1523/JNEUROSCI.0836-06.2006. [DOI] [PMC free article] [PubMed] [Google Scholar]
- Ditterich J. A comparison between mechanisms of multialternative perceptual decision making: ability to explain human behavior, predictions for neurophysiology, and relationship with decision theory. Front Neurosci. 2010;4:184. doi: 10.3389/fnins.2010.00184. [DOI] [PMC free article] [PubMed] [Google Scholar]
- Dorris MC, Olivier E, Munoz DP. Competitive integration of visual and preparatory signals in the superior colliculus during saccadic programming. J Neurosci. 2007;27:5053–5062. doi: 10.1523/JNEUROSCI.4212-06.2007. [DOI] [PMC free article] [PubMed] [Google Scholar]
- Duncan J, Humphreys GW. Visual search and stimulus similarity. Psychol Rev. 1989;96:433–458. doi: 10.1037/0033-295x.96.3.433. [DOI] [PubMed] [Google Scholar]
- Efron B, Tibshirani R. An introduction to the bootstrap. Boca Raton, FL: Chapman and Hall/CRC; 1993. [Google Scholar]
- Everling S, Paré M, Dorris MC, Munoz DP. Comparison of the discharge characteristics of brain stem omnipause neurons and superior colliculus fixation neurons in monkey: implications for control of fixation and saccade behavior. J Neurophysiol. 1998;79:511–528. doi: 10.1152/jn.1998.79.2.511. [DOI] [PubMed] [Google Scholar]
- Fecteau JH, Munoz DP. Salience, relevance, and firing: a priority map for target selection. Trends Cogn Sci. 2006;10:382–390. doi: 10.1016/j.tics.2006.06.011. [DOI] [PubMed] [Google Scholar]
- Findlay JM, Walker R. A model of saccade generation based on parallel processing and competitive inhibition. Behav Brain Sci. 1999;22:661–674. doi: 10.1017/s0140525x99002150. [DOI] [PubMed] [Google Scholar]
- Frank MJ. Hold your horses: a dynamic computational role for the subthalamic nucleus in decision making. Neural Networks. 2006;19:1120–1136. doi: 10.1016/j.neunet.2006.03.006. [DOI] [PubMed] [Google Scholar]
- Furman M, Wang XJ. Similarity effect and optimal control of multiple-choice decision making. Neuron. 2008;60:1153–1168. doi: 10.1016/j.neuron.2008.12.003. [DOI] [PMC free article] [PubMed] [Google Scholar]
- Gold JI, Shadlen MN. Neural computations that underlie decisions about sensory stimuli. Trends Cogn Sci. 2001;5:10–16. doi: 10.1016/s1364-6613(00)01567-9. [DOI] [PubMed] [Google Scholar]
- Gold JI, Shadlen MN. Banburismus and the brain: decoding the relationship between sensory stimuli, decisions, and reward. Neuron. 2002;36:299–308. doi: 10.1016/s0896-6273(02)00971-6. [DOI] [PubMed] [Google Scholar]
- Goldberg DE. Genetic algorithms in search, optimization, and machine learning. Reading, MA: Addison-Wesley; 1989. [Google Scholar]
- Gottlieb J. From thought to action: the parietal cortex as a bridge between perception, action, and cognition. Neuron. 2007;53:9–16. doi: 10.1016/j.neuron.2006.12.009. [DOI] [PubMed] [Google Scholar]
- Gottlieb J, Goldberg ME. Activity of neurons in the lateral intraparietal area of the monkey during an antisaccade task. Nat Neurosci. 1999;2:906–912. doi: 10.1038/13209. [DOI] [PubMed] [Google Scholar]
- Gottlieb JP, Kusunoki M, Goldberg ME. The representation of visual salience in monkey parietal cortex. Nature. 1998;391:481–484. doi: 10.1038/35135. [DOI] [PubMed] [Google Scholar]
- Gottlieb J, Kusunoki M, Goldberg ME. Simultaneous representation of saccade targets and visual onsets in monkey lateral intraparietal area. Cereb Cortex. 2005;15:1198–1206. doi: 10.1093/cercor/bhi002. [DOI] [PMC free article] [PubMed] [Google Scholar]
- Hanes DP, Schall JD. Neural control of voluntary movement initiation. Science. 1996;274:427–430. doi: 10.1126/science.274.5286.427. [DOI] [PubMed] [Google Scholar]
- Hanes DP, Patterson WF, 2nd, Schall JD. Role of frontal eye fields in countermanding saccades: visual, movement, and fixation activity. J Neurophysiol. 1998;79:817–834. doi: 10.1152/jn.1998.79.2.817. [DOI] [PubMed] [Google Scholar]
- Heitz RP, Cohen JY, Woodman GF, Schall JD. Neural correlates of correct and errant attentional selection revealed through N2pc and frontal eye field activity. J Neurophysiol. 2010;104:2433–2441. doi: 10.1152/jn.00604.2010. [DOI] [PMC free article] [PubMed] [Google Scholar]
- Hikosaka O, Takikawa Y, Kawagoe R. Role of the basal ganglia in the control of purposive saccadic eye movements. Physiol Rev. 2000;80:953–978. doi: 10.1152/physrev.2000.80.3.953. [DOI] [PubMed] [Google Scholar]
- Huerta MF, Krubitzer LA, Kaas JH. Frontal eye field as defined by intracortical microstimulation in squirrel monkeys, owl monkeys, and macaque monkeys. II. Cortical connections. J Comp Neurol. 1987;265:332–361. doi: 10.1002/cne.902650304. [DOI] [PubMed] [Google Scholar]
- Ipata AE, Gee AL, Gottlieb J, Bisley JW, Goldberg ME. LIP responses to a popout stimulus are reduced if it is overtly ignored. Nat Neurosci. 2006;9:1071–1076. doi: 10.1038/nn1734. [DOI] [PMC free article] [PubMed] [Google Scholar]
- Itti L, Koch C. Computational modelling of visual attention. Nat Rev Neurosci. 2001;2:194–203. doi: 10.1038/35058500. [DOI] [PubMed] [Google Scholar]
- Leite FP, Ratcliff R. Modeling reaction time and accuracy of multiple-alternative decisions. Atten Percept Psychophys. 2010;72:246–273. doi: 10.3758/APP.72.1.246. [DOI] [PMC free article] [PubMed] [Google Scholar]
- Lo CC, Wang XJ. Cortico–basal ganglia circuit mechanism for a decision threshold in reaction time tasks. Nat Neurosci. 2006;9:956–963. doi: 10.1038/nn1722. [DOI] [PubMed] [Google Scholar]
- Logan GD. An instance theory of attention and memory. Psychol Rev. 2002;109:376–400. doi: 10.1037/0033-295x.109.2.376. [DOI] [PubMed] [Google Scholar]
- Lui F, Gregory KM, Blanks RH, Giolli RA. Projections from visual areas of the cerebral cortex to pretectal nuclear complex, terminal accessory optic nuclei, and superior colliculus in macaque monkey. J Comp Neurol. 1995;363:439–460. doi: 10.1002/cne.903630308. [DOI] [PubMed] [Google Scholar]
- Markram H, Toledo-Rodriguez M, Wang Y, Gupta A, Silberberg G, Wu C. Interneurons of the neocortical inhibitory system. Nat Rev Neurosci. 2004;5:793–807. doi: 10.1038/nrn1519. [DOI] [PubMed] [Google Scholar]
- McMillen T, Holmes P. The dynamics of choice among multiple alternatives. J Math Psychol. 2006;50:30–57. [Google Scholar]
- Moschovakis AK, Karabelas AB, Highstein SM. Structure–function relationships in the primate superior colliculus. II. Morphological identity of presaccadic neurons. J Neurophysiol. 1988;60:263–302. doi: 10.1152/jn.1988.60.1.263. [DOI] [PubMed] [Google Scholar]
- Munoz DP, Wurtz RH. Fixation cells in monkey superior colliculus. I. Characteristics of cell discharge. J Neurophysiol. 1993;70:559–575. doi: 10.1152/jn.1993.70.2.559. [DOI] [PubMed] [Google Scholar]
- Munoz DP, Dorris MC, Paré M, Everling S. On your mark, get set: brainstem circuitry underlying saccadic initiation. Can J Physiol Pharmacol. 2000;78:934–944. [PubMed] [Google Scholar]
- Murthy A, Ray S, Shorter SM, Schall JD, Thompson KG. Neural control of visual search by frontal eye field: effects of unexpected target displacement on visual selection and saccade preparation. J Neurophysiol. 2009;101:2485–2506. doi: 10.1152/jn.90824.2008. [DOI] [PMC free article] [PubMed] [Google Scholar]
- Nakahara H, Nakamura K, Hikosaka O. Extended LATER model can account for trial-by-trial variability of both pre- and post-processes. Neural Networks. 2006;19:1027–1046. doi: 10.1016/j.neunet.2006.07.001. [DOI] [PubMed] [Google Scholar]
- Navalpakkam V, Itti L. Search goal tunes visual features optimally. Neuron. 2007;53:605–617. doi: 10.1016/j.neuron.2007.01.018. [DOI] [PubMed] [Google Scholar]
- Nelder JA, Mead R. A simplex method for function minimization. Comput J. 1965;7:308–313. [Google Scholar]
- Nosofsky RM, Palmeri TJ. An exemplar-based random walk model of speeded classification. Psychol Rev. 1997;104:266–300. doi: 10.1037/0033-295x.104.2.266. [DOI] [PubMed] [Google Scholar]
- Palmer EM, Horowitz TS, Torralba A, Wolfe JM. What are the shapes of response time distributions in visual search? J Exp Psychol Hum Percept Perform. 2011;37:58–71. doi: 10.1037/a0020747. [DOI] [PMC free article] [PubMed] [Google Scholar]
- Palmer J, Verghese P, Pavel M. The psychophysics of visual search. Vision Res. 2000;40:1227–1268. doi: 10.1016/s0042-6989(99)00244-8. [DOI] [PubMed] [Google Scholar]
- Paré M, Hanes DP. Controlled movement processing: superior colliculus activity associated with countermanded saccades. J Neurosci. 2003;23:6480–6489. doi: 10.1523/JNEUROSCI.23-16-06480.2003. [DOI] [PMC free article] [PubMed] [Google Scholar]
- Paré M, Wurtz RH. Progression in neuronal processing for saccadic eye movements from parietal cortex area lip to superior colliculus. J Neurophysiol. 2001;85:2545–2562. doi: 10.1152/jn.2001.85.6.2545. [DOI] [PubMed] [Google Scholar]
- Parent A, Hazrati LN. Functional anatomy of the basal ganglia. I. The cortico-basal ganglia-thalamo-cortical loop. Brain Res Rev. 1995;20:91–127. doi: 10.1016/0165-0173(94)00007-c. [DOI] [PubMed] [Google Scholar]
- Platt JR. Strong inference. Science. 1964;146:347–353. doi: 10.1126/science.146.3642.347. [DOI] [PubMed] [Google Scholar]
- Pouget P, Stepniewska I, Crowder EA, Leslie MW, Emeric EE, Nelson MJ, Schall JD. Visual and motor connectivity and the distribution of calcium-binding proteins in macaque frontal eye field: implications for saccade target selection. Front Neuroanat. 2009;3:2. doi: 10.3389/neuro.05.002.2009. [DOI] [PMC free article] [PubMed] [Google Scholar]
- Pouget P, Logan GD, Palmeri TJ, Boucher L, Paré M, Schall JD. Neural basis of adaptive response time adjustment during saccade countermanding. J Neurosci. 2011;31:12604–12612. doi: 10.1523/JNEUROSCI.1868-11.2011. [DOI] [PMC free article] [PubMed] [Google Scholar]
- Purcell BA, Heitz RP, Cohen JY, Schall JD, Logan GD, Palmeri TJ. Neurally constrained modeling of perceptual decision making. Psychol Rev. 2010;117:1113–1143. doi: 10.1037/a0020311. [DOI] [PMC free article] [PubMed] [Google Scholar]
- Ratcliff R, McKoon G. The diffusion decision model: theory and data for two-choice decision tasks. Neural Comput. 2008;20:873–922. doi: 10.1162/neco.2008.12-06-420. [DOI] [PMC free article] [PubMed] [Google Scholar]
- Ratcliff R, Smith PL. A comparison of sequential sampling models for two-choice reaction time. Psychol Rev. 2004;111:333–367. doi: 10.1037/0033-295X.111.2.333. [DOI] [PMC free article] [PubMed] [Google Scholar]
- Ratcliff R, Tuerlinckx F. Estimating parameters of the diffusion model: approaches to dealing with contaminant reaction times and parameter variability. Psychon Bull Rev. 2002;9:438–481. doi: 10.3758/bf03196302. [DOI] [PMC free article] [PubMed] [Google Scholar]
- Ratcliff R, Hasegawa YT, Hasegawa RP, Smith PL, Segraves MA. Dual diffusion model for single-cell recording data from the superior colliculus in a brightness-discrimination task. J Neurophysiol. 2007;97:1756–1774. doi: 10.1152/jn.00393.2006. [DOI] [PMC free article] [PubMed] [Google Scholar]
- Ray S, Pouget P, Schall JD. Functional distinction between visuomovement and movement neurons in macaque frontal eye field during saccade countermanding. J Neurophysiol. 2009;102:3091–3100. doi: 10.1152/jn.00270.2009. [DOI] [PMC free article] [PubMed] [Google Scholar]
- Roitman JD, Shadlen MN. Response of neurons in the lateral intraparietal area during a combined visual discrimination reaction time task. J Neurosci. 2002;22:9475–9489. doi: 10.1523/JNEUROSCI.22-21-09475.2002. [DOI] [PMC free article] [PubMed] [Google Scholar]
- Sato TR, Watanabe K, Thompson KG, Schall JD. Effect of target-distractor similarity on FEF visual selection in the absence of the target. Exp Brain Res. 2003;151:356–363. doi: 10.1007/s00221-003-1461-1. [DOI] [PubMed] [Google Scholar]
- Schall JD. Neural basis of deciding, choosing and acting. Nat Rev Neurosci. 2001;2:33–42. doi: 10.1038/35049054. [DOI] [PubMed] [Google Scholar]
- Schall JD, Hanes DP. Neural basis of saccade target selection in frontal eye field during visual search. Nature. 1993;366:467–469. doi: 10.1038/366467a0. [DOI] [PubMed] [Google Scholar]
- Schall JD, Morel A, King DJ, Bullier J. Topography of visual cortex connections with frontal eye field in macaque: convergence and segregation of processing streams. J Neurosci. 1995;15:4464–4487. doi: 10.1523/JNEUROSCI.15-06-04464.1995. [DOI] [PMC free article] [PubMed] [Google Scholar]
- Schlag J, Dassonville P, Schlag-Rey M. Interaction of the two frontal eye fields before saccade onset. J Neurophysiol. 1998;79:64–72. doi: 10.1152/jn.1998.79.1.64. [DOI] [PubMed] [Google Scholar]
- Scudder CA, Kaneko CS, Fuchs AF. The brainstem burst generator for saccadic eye movements. Exp Brain Res. 2002;142:439–462. doi: 10.1007/s00221-001-0912-9. [DOI] [PubMed] [Google Scholar]
- Segraves MA. Activity of monkey frontal eye field neurons projecting to oculomotor regions of the pons. J Neurophysiol. 1992;68:1967–1985. doi: 10.1152/jn.1992.68.6.1967. [DOI] [PubMed] [Google Scholar]
- Simen P, Cohen JD. Explicit melioration by a neural diffusion model. Brain Res. 2009;1299:95–117. doi: 10.1016/j.brainres.2009.07.017. [DOI] [PMC free article] [PubMed] [Google Scholar]
- Simen P, Cohen JD, Holmes P. Rapid decision threshold modulation by reward rate in a neural network. Neural Networks. 2006;19:1013–1026. doi: 10.1016/j.neunet.2006.05.038. [DOI] [PMC free article] [PubMed] [Google Scholar]
- Smith PL. From Poisson shot noise to the integrated Ornstein-Uhlenbeck process: neurally principled models of information accumulation in decision-making and response time. J Math Psychol. 2010;54:266–283. [Google Scholar]
- Smith PL, Ratcliff R. An integrated theory of attention and decision making in visual signal detection. Psychol Rev. 2009;116:283–317. doi: 10.1037/a0015156. [DOI] [PubMed] [Google Scholar]
- Somogyi P. A specific “axo-axonal” interneuron in the visual cortex of the rat. Brain Res. 1977;136:345–350. doi: 10.1016/0006-8993(77)90808-3. [DOI] [PubMed] [Google Scholar]
- Stanford TR, Shankar S, Massoglia DP, Costello MG, Salinas E. Perceptual decision making in less than 30 milliseconds. Nat Neurosci. 2010;13:379–385. doi: 10.1038/nn.2485. [DOI] [PMC free article] [PubMed] [Google Scholar]
- Tanaka M. Cognitive signals in the primate motor thalamus predict saccade timing. J Neurosci. 2007;27:12109–12118. doi: 10.1523/JNEUROSCI.1873-07.2007. [DOI] [PMC free article] [PubMed] [Google Scholar]
- Thomas NW, Paré M. Temporal processing of saccade targets in parietal cortex area LIP during visual search. J Neurophysiol. 2007;97:942–947. doi: 10.1152/jn.00413.2006. [DOI] [PubMed] [Google Scholar]
- Thompson KG, Bichot NP. A visual salience map in the primate frontal eye field. Prog Brain Res. 2005;147:251–262. doi: 10.1016/S0079-6123(04)47019-8. [DOI] [PubMed] [Google Scholar]
- Thompson KG, Hanes DP, Bichot NP, Schall JD. Perceptual and motor processing stages identified in the activity of macaque frontal eye field neurons during visual search. J Neurophysiol. 1996;76:4040–4055. doi: 10.1152/jn.1996.76.6.4040. [DOI] [PubMed] [Google Scholar]
- Thompson KG, Bichot NP, Schall JD. Dissociation of visual discrimination from saccade programming in macaque frontal eye field. J Neurophysiol. 1997;77:1046–1050. doi: 10.1152/jn.1997.77.2.1046. [DOI] [PubMed] [Google Scholar]
- Thompson KG, Bichot NP, Sato TR. Frontal eye field activity before visual search errors reveals the integration of bottom-up and top-down salience. J Neurophysiol. 2005a;93:337–351. doi: 10.1152/jn.00330.2004. [DOI] [PMC free article] [PubMed] [Google Scholar]
- Thompson KG, Biscoe KL, Sato TR. Neuronal basis of covert spatial attention in the frontal eye field. J Neurosci. 2005b;25:9479–9487. doi: 10.1523/JNEUROSCI.0741-05.2005. [DOI] [PMC free article] [PubMed] [Google Scholar]
- Thornton TL, Gilden DL. Parallel and serial processes in visual search. Psychol Rev. 2007;114:71–103. doi: 10.1037/0033-295X.114.1.71. [DOI] [PubMed] [Google Scholar]
- Treisman A, Gormican S. Feature analysis in early vision: evidence from search asymmetries. Psychol Rev. 1988;95:15–48. doi: 10.1037/0033-295x.95.1.15. [DOI] [PubMed] [Google Scholar]
- Tsotsos JK, Culhane SM, Kei Wai WY, Lai Y, Davis N, Nuflo F. Modeling visual attention via selective tuning. Artif Intell. 1995;78:507–545. [Google Scholar]
- Usher M, McClelland JL. The time course of perceptual choice: the leaky, competing accumulator model. Psychol Rev. 2001;108:550–592. doi: 10.1037/0033-295x.108.3.550. [DOI] [PubMed] [Google Scholar]
- Usher M, Olami Z, McClelland JL. Hick's law in a stochastic race model with speed–accuracy tradeoff. J Math Psychol. 2002;46:704–715. [Google Scholar]
- Van Zandt T. How to fit a response time distribution. Psychon Bull Rev. 2000;7:424–465. doi: 10.3758/bf03214357. [DOI] [PubMed] [Google Scholar]
- Ward R, McClelland JL. Conjunctive search for one and two identical targets. J Exp Psychol Hum Percept Perform. 1989;15:664–672. doi: 10.1037//0096-1523.15.4.664. [DOI] [PubMed] [Google Scholar]
- White BJ, Munoz DP. Separate visual signals for saccade initiation during target selection in the primate superior colliculus. J Neurosci. 2011;31:1570–1578. doi: 10.1523/JNEUROSCI.5349-10.2011. [DOI] [PMC free article] [PubMed] [Google Scholar]
- Wichmann FA, Hill NJ. The psychometric function: II. Bootstrap-based confidence intervals and sampling. Percept Psychophys. 2001;63:1314–1329. doi: 10.3758/bf03194545. [DOI] [PubMed] [Google Scholar]
- Wolfe JM. Guided search 4.0: current progress with a model of visual search. In: Gray W, editor. Integrated models of cognitive systems. New York: Oxford UP; 2007. pp. 99–119. [Google Scholar]
- Wolfe JM, Palmer EM, Horowitz TS. Reaction time distributions constrain models of visual search. Vision Res. 2010;50:1304–1311. doi: 10.1016/j.visres.2009.11.002. [DOI] [PMC free article] [PubMed] [Google Scholar]
- Woodman GF, Kang MS, Thompson K, Schall JD. The effect of visual search efficiency on response preparation. Psychol Sci. 2008;19:128–136. doi: 10.1111/j.1467-9280.2008.02058.x. [DOI] [PMC free article] [PubMed] [Google Scholar]