Abstract
Displaying the vast amount of clinical data that exist in electronic medical records without causing information overload or interfering with provider thought processes is a challenge. To support the transformation of data into information and knowledge, effective electronic displays must be flexible and guide physicians’ thought processes. Applying research from cognitive science and human factors engineering offers promise in improving the electronic display of clinical information.
Objectives
After completing this article, readers should be able to:
Appreciate the importance of supporting provider thought processes during both data entry and data review.
Recognize that information does not need to be displayed and reviewed in the same way the data are entered.
Introduction
Electronic medical records (EMRs) contain an abundance of clinical data, especially in the intensive care environment. (1)(2) Providers must absorb, integrate, and analyze these data to make diagnoses and treatment decisions in critical situations. Avoiding information overload yet ensuring that all pertinent information is provided is a significant challenge when presenting data in the NICU. In addition to causing frustration and inefficiency, poorly presented data (and associated information overload) can facilitate errors by decreasing situational awareness or causing pertinent clinical data to be overlooked. (3)(4) Well-designed informatics tools should “filter data so that it becomes information, transform information into knowledge, and ultimately provide clinicians with wisdom based on that knowledge at the exact time they need it.” (5)(6) A thoughtful approach to EMR data entry and display supports clinical decision-making and has the potential to decrease errors and improve quality of care in our vulnerable patient population. (7)
Data Entry
EMR data entry can be accomplished by various approaches. Structured data entry includes check boxes, radio buttons, pull-down menus, and other fields that restrict the type of input. Unstructured data generally are collected in free-text boxes and allow more flexibility. Although entering data in a highly structured fashion can be useful for the purposes of research and regulatory reporting and to ensure completeness, structured data entry also has the potential to cause user dissatisfaction and introduce errors. (8)(9)(10)(11) Patel et al (12) demonstrated that a computerized interface can impact the questions asked during a clinical encounter and may impair a clinician’s ability to develop a cognitive model of a patient.
Utilizing technologies such as biomedical device integration, which captures data from monitors and medical devices for entry into an EMR, can improve the data-entry process by eliminating delays and reducing errors. (13) EMRs can support integrated data entry and the notion of a care team by unifying data-entry fields across providers and locations. For example, rather than establishing separate fraction of inspired oxygen data fields for respiratory therapist and bedside nurse documentation, a single data field that can be updated by either provider has the potential to limit the possibility of errors between different users, avoid confusion by ensuring that the EMR represents a single source of truth for a patient’s data, and support information sharing among a team of providers. Similarly, if fluid intake or output, blood product administration, and medications given during a surgical procedure are recorded in an anesthesia documentation module that is not integrated with the remainder of the patient’s chart, the information may be missed and could result in patient harm (such as inappropriate timing of medication administration or missed doses). Data within a patient’s medical record should be represented in a patient-centric fashion, rather than in a provider-, location-, or encounter-centric fashion.
Data Display and Review
Patient data can be displayed differently than they are entered. (14) The manner in which information is presented to clinicians represents another potential source of error. For example, data displayed in a small time window may give the impression that a patient is stable when in fact a trend toward a state of extremis is present. Alternatively, a time window that is too large may hide important granularity of a clinical situation, such as physiologic changes associated with intermittent shunting across a patent ductus arteriosus.
One theory central to understanding the problem of data display is the notion of “distributed cognition.” (15) In brief, this term refers to the idea that concepts are distributed among providers (nurses, respiratory therapists, and physicians), artifacts (paper flowsheets and computer screens), and environments (the ICU, operating room, and anesthesia recovery room). In addition to these three elements, the ability to retrieve information from a given display accurately and efficiently is dependent on the task at hand, previous experience, and one’s level of expertise. (16)(17) These complexities make development of an “ideal” data display difficult, because an individual data element does not exist in isolation. Rather, the display of clinical data must be considered in context (ie, what is the intent in viewing the data, and what previous experiences and expectations are brought to the task?).
Fragmented data, such as vital signs on one screen and urine output measures on another, that require care providers to switch between multiple screens to gather information also add to the cognitive workload of developing a mental overview of a patient’s clinical situation. (8) On paper, bedside flowsheets bring together several pieces of clinical information in a single view to help provide a cognitive overview of a patient in the NICU. (3) Capturing the utility of the paper flowsheet in electronic formis a challenge, in part because the variable, complex cognitive workflows of neonatologists are not understood completely. Brown et al (18) demonstrated this variability by providing neonatologists with paper-based flowsheets and asking them to identify both a diagnosis and the items on the flowsheet that led to their diagnostic choice. Although there was high agreement regarding diagnosis, much less overlap was present in the information the providers identified as clinically relevant. This discrepancy highlights the challenge in developing electronic displays without fully understanding clinicians’ internal cognitive representations and thought processes.
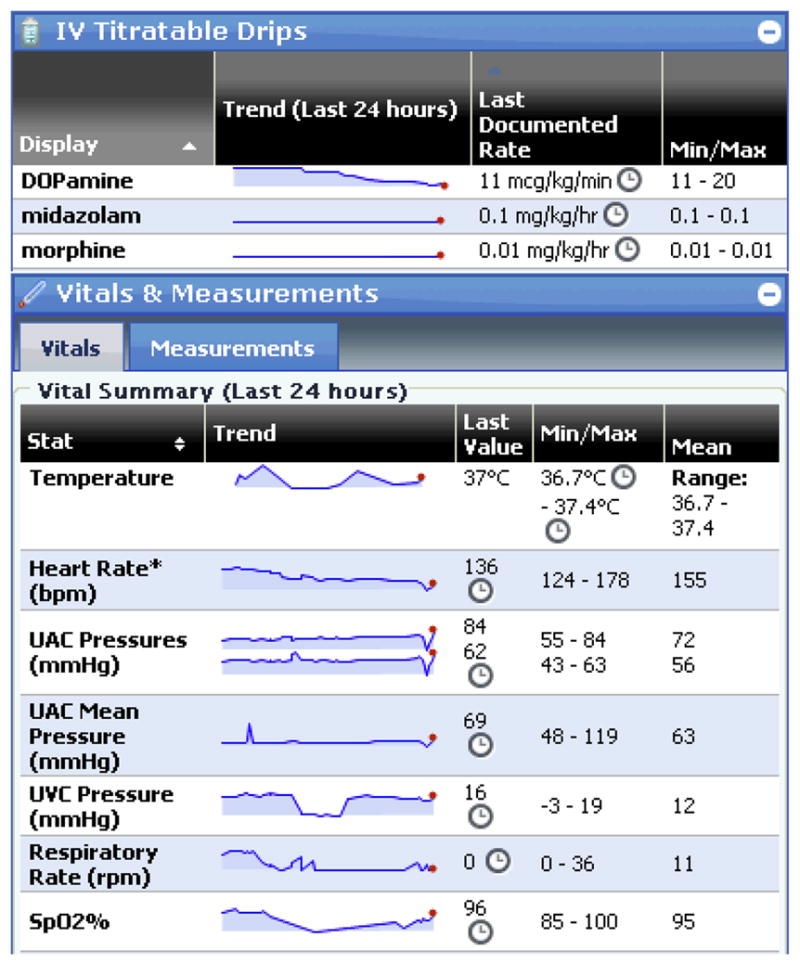
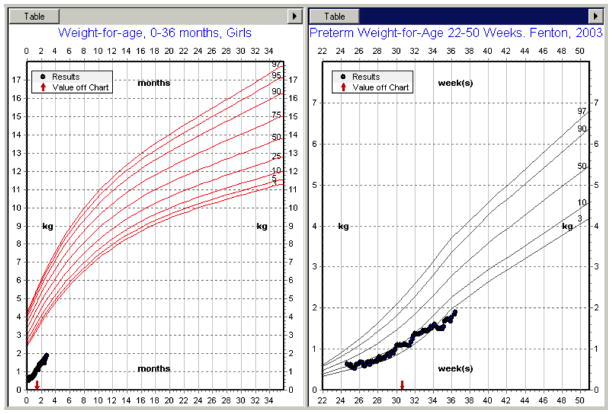
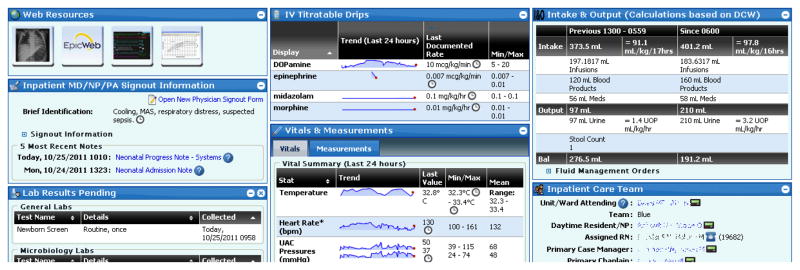
This is not to say that it is impossible to improve on existing models of data display in the NICU. Different visualizations can aid in the ability to trend and summarize numeric data. For example, sparklines are data-rich word-sized graphics especially useful for identifying trends that are difficult to discern from data presented in tables. (3)(19)(20)At Lucile Packard Children’s Hospital at Stanford, sparklines are used to summarize the temporal relationship between fluctuations in vital signs, respiratory support, and continuous infusion rates, providing a patient-centric view scaled to the patient’s past and current data (Fig 1). Growth charts are another instance in which displaying data graphically can be more meaningful. (21) However, unless graphs are context-specific and scaled to the patient, such as Fenton growth charts for monitoring weight trends in preterm infants, they can be of limited utility (Fig 2). More sophisticated visualization tools that allow for examination of changes in patient status over time for multiple variables are being developed and have the potential to alert providers of an impending crisis. (22) Patient summary screens allow the aggregation of patient information from multiple data sources in a single display (Fig 3). On a single screen, providers can review vital signs, intake and output, continuous infusions, respiratory support, current laboratory and radiology orders, and pending laboratory/microbiology tests. Information about the current care team is also available, including hyperlinks to web-based text paging. In addition, significant clinical events, handoff information, recent clinical documents, and links to web resources (eg, an application for radiograph review and a clinical decision support tool for management of hyperbilirubinemia) are also displayed. The organization of this information into widgets allows for user-based customization of the display.
Figure 1.

Sparklines on a patient summary screen.
Figure 2.
Pediatric growth chart (left) and Fenton growth chart (right) for the same premature infant.
Figure 3.
Patient summary screen.
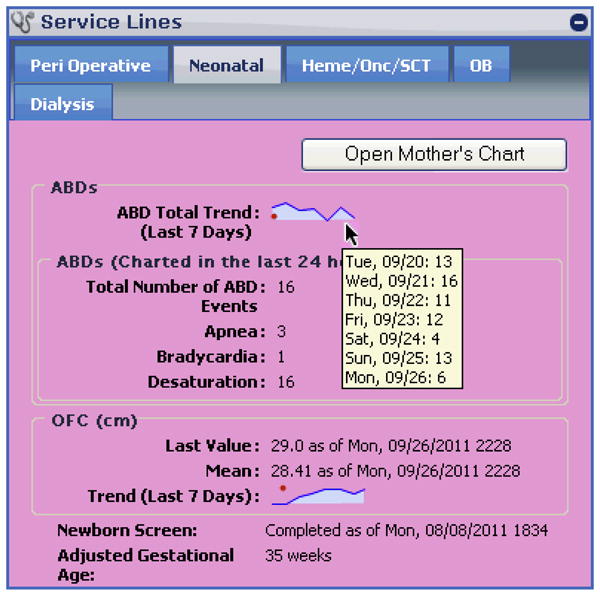
Patient summary screens also can be customized by discipline. The neonatal view includes a sparkline trending apnea/bradycardia/desaturation events and a button for navigation into the chart of a patient’s mother (Fig 4). In addition to facilitating access to maternal information by providing single-click access to her chart, pertinent pregnancy and delivery information documented in her chart is copied automatically to corresponding data-entry screens and clinical documents in the infant’s chart.
Figure 4.

Neonatal view of a patient summary screen.
Conclusions
The quantity of clinical data in EMRs presents challenges and opportunities to the design of informatics tools that display information to providers. Although an ideal display would be flexible enough to support various thought processes and empower clinicians with knowledge and wisdom from the data, we remain far from achieving this goal. Applying human factors research to health care would aid in understanding the “messy details” of human cognition and guide the development of intelligent electronic displays. (23)
Acknowledgments
This work was supported by the National Library of Medicine at the National Institutes of Health under Biomedical Informatics Research Training Grant 5 T15 LM 7033. Its contents are solely the responsibility of the authors and do not necessarily represent the official views of the NIH.
Footnotes
Author Disclosure
Drs Palma, Brown, Lehmann, and Longhurst have disclosed no financial relationships relevant to this article. This commentary does not contain a discussion of an unapproved/investigative use of a commercial product/device.
References
- 1.Heldt T, Long B, Verghese GC, Szolovits P, Mark RG. Integrating data, models, and reasoning in critical care. Conf Proc IEEE Eng Med Biol Soc. 2006;1:350–353. doi: 10.1109/IEMBS.2006.259734. [DOI] [PubMed] [Google Scholar]
- 2.Ordóñez P, DesJardins M, Feltes C, Lehmann CU, Fackler J. Visualizing multivariate time series data to detect specific medical conditions. AMIA Annu Symp Proc. 2008 Nov 6;:530–534. [PMC free article] [PubMed] [Google Scholar]
- 3.Bauer DT, Guerlain S, Brown PJ. The design and evaluation of a graphical display for laboratory data. J Am Med Inform Assoc. 2010;17(4):416–424. doi: 10.1136/jamia.2009.000505. [DOI] [PMC free article] [PubMed] [Google Scholar]
- 4.Feblowitz JC, Wright A, Singh H, Samal L, Sittig DF. Summarization of clinical information: a conceptual model. J Biomed Inform. 2011;44(4):688–699. doi: 10.1016/j.jbi.2011.03.008. [DOI] [PubMed] [Google Scholar]
- 5.Halamka JD. [Accessed September 2011];Data, Information, Knowledge, and Wisdom: Life as a Healthcare CIO. Available at: http//geekdoctor.blogspot.com/2007/11/data-information-knowledge-and-wisdom.html.
- 6.Ackoff RL. From data to wisdom. J Appl Syst Anal. 1989;16(1):3–9. [Google Scholar]
- 7.Kim GR, Lehmann CU. Council on Clinical Information Technology. Pediatric aspects of inpatient health information technology systems [published correction appears in Pediatrics. 2009;123(2):604. [Google Scholar]; Pediatrics. 2008;122(6):e1287–e1296. doi: 10.1542/peds.2008-2963. [DOI] [PubMed] [Google Scholar]
- 8.Ash JS, Berg M, Coiera E. Some unintended consequences of information technology in health care: the nature of patient care information system-related errors. J Am Med Inform Assoc. 2004;11(2):104–112. doi: 10.1197/jamia.M1471. [DOI] [PMC free article] [PubMed] [Google Scholar]
- 9.Bates DW, Kuperman GJ, Wang S, et al. Ten commandments for effective clinical decision support: making the practice of evidence-based medicine a reality. J Am Med Inform Assoc. 2003;10(6):523–530. doi: 10.1197/jamia.M1370. [DOI] [PMC free article] [PubMed] [Google Scholar]
- 10.Payne TH, tenBroek AE, Fletcher GS, Labuguen MC. Transition from paper to electronic inpatient physician notes. J Am Med Inform Assoc. 2010;17(1):108–111. doi: 10.1197/jamia.M3173. [DOI] [PMC free article] [PubMed] [Google Scholar]
- 11.O’Connell RT, Cho C, Shah N, Brown K, Shiffman RN. Take note(s): differential EHR satisfaction with two implementations under one roof. J Am Med Inform Assoc. 2004;11(1):43–49. doi: 10.1197/jamia.M1409. [DOI] [PMC free article] [PubMed] [Google Scholar]
- 12.Patel VL, Kushniruk AW, Yang S, Yale JF. Impact of a computer-based patient record system on data collection, knowledge organization, and reasoning. J Am Med Inform Assoc. 2000;7(6):569–585. doi: 10.1136/jamia.2000.0070569. [DOI] [PMC free article] [PubMed] [Google Scholar]
- 13.Vawdrey DK, Gardner RM, Evans RS, et al. Assessing data quality in manual entry of ventilator settings. J Am Med Inform Assoc. 2007;14(3):295–303. doi: 10.1197/jamia.M2219. [DOI] [PMC free article] [PubMed] [Google Scholar]
- 14.Kim GR, Lawson EE, Lehmann CU. Challenges in reusing transactional data for daily documentation in neonatal intensive care. AMIA Annu Symp Proc. 2008 Nov 6;:1009. [PubMed] [Google Scholar]
- 15.Hutchins E. Cognition in the Wild. Cambridge, MA: MIT Press; 1995. [Google Scholar]
- 16.Zhang J, Patel VL, Johnson KA, Smith JW. Designing human-centered distributed information systems. IEEE Intelligent Systems. 2002;17(5):42–47. [Google Scholar]
- 17.Alberdi E, Becher JC, Gilhooly K, et al. Expertise and the interpretation of computerized physiological data: implications for the design of computerized monitoring in neonatal intensive care. Int J Hum Comput Stud. 2001;55(3):191–216. [Google Scholar]
- 18.Brown P, Guerlain S, Gordon P, Bauer D. Variations in faculty assessment of NICU flowsheet data: implications for electronic data display. Int J Med Inform. 2011;80(7):529–532. doi: 10.1016/j.ijmedinf.2011.03.013. [DOI] [PubMed] [Google Scholar]
- 19.Tufte E. Beautiful Evidence. Cheshire, CT: Graphics Press LLC; 2006. [Google Scholar]
- 20.Powsner SM, Tufte ER. Graphical summary of patient status. Lancet. 1994;344(8919):386–389. doi: 10.1016/s0140-6736(94)91406-0. [DOI] [PubMed] [Google Scholar]
- 21.Rosenbloom ST, Qi X, Riddle WR, et al. Implementing pediatric growth charts into an electronic health record system. J Am Med Inform Assoc. 2006;13 (3):302–308. doi: 10.1197/jamia.M1944. [DOI] [PMC free article] [PubMed] [Google Scholar]
- 22.Ordóñez P, desJardins M, Lombardi M, Lehmann CU, Fackler J. An animated multivariate visualization for physiological and clinical data in the ICU. Proceedings of the 1st ACM International Health Informatics Symposium; 2010. pp. 771–779. [Google Scholar]
- 23.Nemeth CP, Cook RI, Woods DD. The messy details: insights from the study of technical work in healthcare. Systems, man and cybernetics, part A: systems and humans. IEEE Transactions on Systems, Man, and Cybernetics. 2004;34(6):689–692. [Google Scholar]


