

Abstract
Phosphorus (P) is a finite and dwindling resource. Debate focuses on current production and use of phosphate rock rather than on the amounts of P required in the future to feed the world. We applied a two-pool soil P model to reproduce historical continental crop P uptake as a function of P inputs from fertilizer and manure and to estimate P requirements for crop production in 2050. The key feature is the consideration of the role of residual soil P in crop production. Model simulations closely fit historical P uptake for all continents. Cumulative inputs of P fertilizer and manure for the period 1965–2007 in Europe (1,115 kg⋅ha−1 of cropland) grossly exceeded the cumulative P uptake by crops (360 kg⋅ha−1). Since the 1980s in much of Europe, P application rates have been reduced, and uptake continues to increase due to the supply of plant-available P from residual soil P pool. We estimate that between 2008 and 2050 a global cumulative P application of 700–790 kg⋅ha−1 of cropland (in total 1,070–1,200 teragrams P) is required to achieve crop production according to the various Millennium Ecosystem Assessment scenarios [Alcamo J, Van Vuuren D, Cramer W (2006) Ecosystems and Human Well-Being: Scenarios, Vol 2, pp 279–354]. We estimate that average global P fertilizer use must change from the current 17.8 to 16.8–20.8 teragrams per year in 2050, which is up to 50% less than other estimates in the literature that ignore the role of residual soil P.
Keywords: food security, global crop production, phosphorus depletion, hysteresis
Significant improvements in agricultural productivity and efficiency of resource use are required to secure food production for the projected world population in 2050 (1). Food production needs to grow faster than the global population due to changing human diets (i.e., increasing per-capita consumption of meat) and production of biofuels. This challenge can be managed through significant improvements in agricultural productivity and phosphorus (P) fertilizer use efficiency.
P is essential for plant growth and often a major limiting nutrient in agriculture (1–3). Many studies have raised concern about rapid depletion of the world's P reserves (4, 5). Recently, it was suggested that global P production will peak by 2033 (5). In contrast, other studies conclude that almost half of the currently available P resources will be depleted by 2100 (6), or that P rock reserves will be available for the next 300–400 y (7).
Resource use efficiency, including strategies such as recycling of human P sewage sludge and other waste materials containing P, and reducing runoff and erosion, will be important to improve the sustainability of human P cycle (6).
Readily available P in the soil solution provides most of the plant-available P. The two main factors that control the availability of P to plant roots are the concentration of phosphate ions in the soil solution and the P-buffer capacity, i.e., the ability of the soil to replenish these ions when plant roots remove them (3). Soils differ in their buffering capacity and in the extent to which they fix P in insoluble compounds that are unavailable for uptake. P fixation depends on the amount of iron and aluminum oxides (properties that are particularly relevant in strongly weathered tropical soils) or high calcium activity (8, 9). Following a traditional misconception that P fixation is dominant and irreversible, P has been used excessively in agricultural systems for decades in many industrialized countries (10).
A critical concentration of readily available P must be maintained to obtain good crop yields (3). Crop uptake is generally only 10–20% of the P fertilizer applied in the first year, but a substantial part of applied P accumulates in the soil as residual P (3, 11). The residual P is the difference between P inputs (mineral fertilizer, manure, weathering, and deposition) and P outputs (withdrawal of P in harvested products, and P loss by runoff or erosion) (12). The residual value of P refers to P that can be taken up by crops for many years (3, 13), depending on soil P fixation capacity, soil pH, crop species, and P application time (9). In an ideal situation, when adequate P is present in the readily available pools, annual P inputs from fertilizer equal to the plant P uptake may be adequate to maintain good crop yields (3). Where the amount of readily available P is below a critical level, the rate of P release from residual P is insufficient to sustain optimal crop yields.
Here, an analysis is presented of the historical and future demand of P in global crop production systems. The key feature of this study is the contribution of residual P to the available P for crop uptake at the continental and global scale. A dynamic phosphorus pool simulator (DPPS)—a simple two-pool P model (11), including labile and stable pools and long-term P input and output data, is applied in this analysis to simulate the P transformations in soil, the build-up of residual soil P pool, and crop P uptake (Fig. 1).
Fig. 1.

Scheme of the DPPS model. The model includes two dynamic pools of P: the labile (PL) and the stable (PS) pools, comprising both organic and inorganic P. Four inputs of P to the system are defined: fertilizer, manure, weathering, and deposition. The coefficient ρ refers to the total P input (mineral fertilizer and manure) after subtracting runoff loss. The coefficients f and 1 − f refer to the fraction of ρ that transfers to the PL and PS, respectively. Coefficient α represents the crop P uptake fraction from PL. Parameters ω and δ are weathering and deposition inputs to the PL and PS, respectively. μLS and μSL denote to the transfer rate of P from the PL to the PS and from PS to the PL, respectively (redrawn from ref. 11).
Results
Historical P Application Through Fertilizer and Manure (1965–2007).
Past trends of fertilizer P use vary markedly across the different regions of the world. Annual P application in Western Europe was 24 kg⋅ha−1 in 1965, peaked at 34 kg⋅ha−1 in the 1980s, and then gradually decreased to 17 kg⋅ha−1 in 2007 (Fig. 2A). Oceania's annual P fertilizer use fluctuated between 8 and 18 kg⋅ha−1, with rates in the early 2000s returning to those of 1965 (Fig. 2F). Annual application rates in North America remained fairly constant around 9–12 kg⋅ha−1 from 1965 to 2007 (Fig. 2B), whereas the rates of P used rose rapidly from 4 to 21 kg⋅ha−1 in Latin America (including Central and South America) and from 6 to 28 kg⋅ha−1 in Asia (with almost 70% of the global croplands; Fig. 2 E and D). In Africa, annual P application rates remained low (<4.5 kg⋅ha−1) throughout the entire period (Fig. 2C). North America, Western Europe, and East and South Asia accounted for >80% of global P fertilizer use in 1979–1999 (14), despite comprising <55% of global cropland.
Fig. 2.

Trends of annual P application and P uptake in cropland for the period 1965–2050 according to GO scenario in (A) Western Europe, (B) North America, (C) Africa, (D) Asia, (E) Latin America and (F) Oceania. Long-term FAO data (15) and simulation results are illustrated by circles and lines, respectively. Shaded and open circles refer to P application and P uptake rates, respectively. Dashed and solid lines refer to P application and P uptake rates, respectively. The regions are based on those defined by the FAO (15). The R2 values for calculated vs. observed P uptake (1965–2007) range from 0.62 for Oceania, 0.81 for Western Europe, 0.83 for North America, 0.84 for Africa, 0.93 for Latin America, and 0.98 for Asia.
Aggregated global P application in croplands in the form of fertilizer and manure from 1965 to 2007 show a sharp increase in global fertilizer application between 1965 and 1990, whereas global manure P application in croplands was more stable in that period and increased gradually after 1990 (Fig. 3A). At the continental and regional scale, these trends are completely different. In Africa, annual applications of inorganic P fertilizer and manure P in 1965 are the same [0.2 teragrams (Tg)⋅y−1 for each]. Though annual inorganic P fertilizer use doubled (up to 0.4 Tg), manure P showed a threefold increase (reaching to 0.6 Tg) between 1965 and 2007. In Asia, annual fertilizer P application increased 12.5-fold (from 0.8 Tg in 1965 to 10 Tg in 2007), and manure P more than doubled from 2 Tg to 4.5 Tg in the same period.
Fig. 3.

(A) Global annual applications of inorganic P fertilizer and manure P between 1965 and 2007. (B) Trends of annual P application and P uptake in cropland for the period 1965 to 2050 in the entire globe according to the four MEA scenarios. Long-term FAO data (15) and simulation results are illustrated by circles and lines, respectively. Shaded and open circles refer to P application and P uptake rates, respectively. Dashed and solid lines refer to P application and P uptake rates, respectively. The R2 value for calculated versus observed P uptake (1965–2007) is 0.96.
Cumulative P Application and Uptake Between 1965 and 2007.
Cumulative inputs of P fertilizer and manure (12, 15) in Oceania (560 kg P) and Western Europe (1,115 kg P) per hectare of cropland for the period 1965–2007 were much greater than the cumulative crop P uptake (100 and 350 kg⋅ha−1 for Oceania and Western Europe, respectively). Over the same period, cumulative P input in Asia was close to 700 kg⋅ha−1 and 500 kg⋅ha−1 in North America, Eastern Europe, and Latin America, but only 160 kg⋅ha−1 in Africa. The cumulative P uptake was much smaller in Africa (105 kg⋅ha−1 P uptake) than in Asia, North America, and Latin America (250 kg⋅ha−1 P uptake). At the global scale, less than half of the applied P between 1965 and 2007 (550 kg⋅ha−1) was taken up by harvested crops (225 kg⋅ha−1).
P Demand Between 2008 and 2050.
We used the DPPS model to calculate P application rates (fertilizer and manure) based on target crop production from the Global Orchestration (GO) scenario of the Millennium Ecosystem Assessment (MEA) (16) (Table 1). The GO scenario projects a rapid increase in annual crop production and P uptake in Africa (from 3.1 to 8.3 kg⋅ha−1) and Oceania (from 2.5 to 6.5 kg⋅ha−1) between 2008 and 2050, whereas in Western Europe annual P uptake will increase by only 5% (from 9.9 in 2007 to 10.4 kg⋅ha−1 per year by 2050). With a faster increase in crop production (13%) in Eastern Europe, P target uptake rate will reach 4.4 kg⋅ha−1 in 2050 (Fig. S1). In North America, Latin America, and Asia, P uptake needs to increase by 40–60% between 2007 and 2050.
Table 1.
Cropland area, phosphorus application, target P uptake, and cumulative P input in different world regions and the entire globe
| Region | Cropland, 106 ha |
P application rate, fertilizer and manure, kg⋅ha−1⋅y−1 |
P uptake rate, kg⋅ha−1⋅y−1 |
Target P uptake rate, kg⋅ha−1* | Cumulative P input, kg⋅ha−1 |
|||||
| 1965 | 2007 | 1965 | Max (y) | 2007 | 1965 | 2007 | 2050 | 1965–2007 | 2008–2050 | |
| Western Europe | 107 | 94 | 23.8 | 33.8 (1979) | 17.2 | 4.9 | 9.9 | 10.4 | 1,115 | 600 |
| Eastern Europe | 231 | 199 | 6.1 | 18.7 (1998) | 4.7 | 2.6 | 3.9 | 4.4 | 430 | 225 |
| North America | 230 | 225 | 8.7 | 12.4 (1976) | 11.4 | 3.9 | 8.8 | 12.7 | 465 | 630 |
| Latin America | 112 | 170 | 4.4 | 20.8 (2007) | 20.8 | 3.1 | 8.9 | 13.2 | 480 | 840 |
| Asia | 446 | 541 | 6.4 | 27.5 (2006) | 27.3 | 3.5 | 10 | 15.8 | 690 | 1,130 |
| Africa | 173 | 247 | 1.9 | 4.4 (2004) | 4.1 | 1.8 | 3.1 | 8.3 | 160 | 580 |
| Oceania | 41 | 46 | 14.8 | 17.3 (1996) | 16 | 1.1 | 2.5 | 6.5 | 560 | 690 |
| World | 1,390 | 1,520 | 7.6 | 16.6 (2007) | 16.6 | 3.2 | 7.6 | 11.8 | 550 | 790 |
The DPPS model simulates the historical patterns of uptake as a response to the application rates remarkably well in all continents (Fig. 2). R2 values for calculated vs. observed P uptake (1965–2007) for all continents and the world range between 0.81 and 0.98, and 0.62 for Oceania. During the past decades, Oceania experienced prolonged drought periods resulting in important fluctuations in crop production (Fig. 2F), which is probably the reason for the poorer fit in Oceania than in other continents. Based on the DPPS model, we estimate that to achieve the 2050 target production, the cumulative P application between 2008 and 2050 amounts to 1,130 kg⋅ha−1 in Asia (Fig. 2D), 840 kg⋅ha−1 in Latin America, 690 kg⋅ha−1 in Oceania, and 630 kg⋅ha−1 in North America. Compared with these continents, the cumulative P inputs are smaller in Western Europe (600 kg⋅ha−1) and Africa (580 kg⋅ha−1; Fig. 2). The GO scenario shows a 55% increase in target P uptake rate in global agricultural systems from 2007 to 2050, from 7.6 to 11.8 kg⋅ha−1⋅y−1, resulting in a global cumulative P input ∼790 kg⋅ha−1 between 2008 and 2050. The calculated global cumulative P input between 2008 and 2050 for the other MEA scenarios is as follows: 700 Adapting Mosaic (AM) scenario, 720 Order from Strength (OS), and 760 Technogarden (TG) kg⋅ha−1 for a target P uptake of 10.7, 10.9, and 11.4 kg⋅ha−1⋅y−1, respectively (Fig. 3B).
Sensitivity Analysis.
When assuming P runoff to be 20% or 30% of P input (instead of 10% as a default value), cumulative P application between 2008 and 2050 was, respectively, 2–9% and 4–18% higher in different continents and the entire globe.
The full range from the sensitivity analyses (including transfer times, runoff loss, and fraction of input entering the labile pool) for the required P input (2008–2050) in global croplands under the GO scenario is 1,000–1,440 Tg. In this case, the total mineral P fertilizer required in the year 2050 will range between 14.6 and 28 Tg (near the standard 20.8). Even the highest projections are still 20% less than future estimates found in the literature (12, 17).
Phosphorus Recovery.
Accounting for the contribution of residual P in future P demand, the average of P recovery—defined as P in the crop yield over the P input—between 2008 and 2050 shows an increase relative to P recoveries calculated for 1965–2007 in all world regions (except for Africa; Fig. 4A). Global P recovery shows a steady increase from 30% in 1965 to close to 40–50% in the period 2000–2007, and close to 60% in 2050 (Fig. 4B).
Fig. 4.

(A) P recovery from actual historical data (1965–2007) and future simulated data (2008–2050). AF, Africa; N-A, North America; L-A, Latin America; AS, Asia; E-E, Eastern Europe; W-E, Western Europe; and OC, Oceania. (B) Global P recovery from 1965 to 2050.
Discussion
Residual P and Hysteretic Crop Uptake.
Our analysis shows that including residual P in the estimation of the fertilizer required to achieve the target crop yields leads to a reduced fertilizer requirement compared with other studies that did not account for residual P. In most world regions, soil P status has been improved over the past decades by applying P fertilizer and manure. For instance, since the 1980s, P application rates have declined in many European countries, and uptake continued to increase. This finding is possibly due to the continued supply of plant-available P from the residual soil P pool (13). Obviously the residual P pool must be maintained, so the current decreasing trend simulated for Europe (Fig. 2A) needs to be balanced by P input equal to crop removal (Fig. S2). By contrast, in many developing countries in Africa, Asia, and Latin America, soils have been continually depleted over the years due to the low rate of P input. A global P balance study recently reported that almost 30% of global cropland area showed P deficiency in 2000 (18).
Our results show a hysteretic behavior in crop P uptake vs. fertilizer application. This behavior is well pronounced in regions with large P applications (e.g., in Western Europe; Fig. 5), where for the same P application rate, two different P uptake rates are observed at different points in time. The high uptake rate is the result of the residual P that has accumulated in the soil. Build-up of soil P fertility as a result of substantial past inputs of organic and mineral P fertilizer in several world regions has reduced the P inputs required, although P uptake by crops has stabilized or increased. This finding has also been observed at smaller scales. Experimental data at field, farm, and country scales (19–22) support our findings that when soil-available P is adequate, crop yields can increase with decreasing or even halting P application. For example a farm-scale study showed that long-term (1989–2006) equilibrium P fertilization did not lead to reduced crop yields in Dutch sandy soils (22). A recent national-level study on P fertilizer in Japan indicated that crop yields remained constant or even increased, despite a decline in use of P fertilizer and manure between 1985 and 2005 (20). Even in high P-fixing soils, a large initial application of P (∼600 kg⋅ha−1) can be adequate for cultivating maize for 7–9 y because of the effect of residual P (19).
Fig. 5.

Hysteresis in P uptake vs. P application between 1965 and 2007 (Western Europe). With the same amount of P application, there are two rates of P uptake that show the contribution of the residual P to the crop production.
Projection of Future P Requirement.
There are only a few global studies that estimate the amount of P input/output in croplands in 2050 (12, 17, 23). Steen (23) estimated a 2.5% annual growth in P consumption over the long term due to the 2–2.5% increase in crop yield per year. With this rapid growth, global annual consumption would be 26–31 Tg P in 2050. Total P use in 2050 calculated by Bouwman et al. (12, 17) ranges between 23 and 33 Tg⋅y−1, depending on the scenario for crop production and P use efficiency. These projections ignored the effect of residual soil P.
Our results show that accounting for the role of residual soil P leads to lower projections of P demand for the period 2008–2050. Global P application rates per hectare will increase, but less than proportional to the required increases in production and yield (Table 1). However, the situation differs among continents. In Europe, Asia, Latin America, and Oceania, crop production can benefit from the residual P accumulated due to past P fertilizer and manure use (Table 1), and P uptake can increase even with a reduction in P application rates between 2008 and 2050. In contrast, target P uptake rates can be achieved in North America with a slight increase in P application rates. Due to the minimal P application rates in the past decades, in Africa more than a fivefold increase from 4 kg⋅ha−1 in 2007 to ∼23 kg⋅ha−1 in 2050 is needed to achieve the target P uptake. This result is consistent with conclusions of Steen (23) who suggested that 30–50% more P fertilizer than crop requirements must be applied for almost 30–50 y to restore soil P in depleted soils.
Our estimate of the global P input required in global cropland of 1,200 million tons P for the 2008–2050 period includes P from both mineral fertilizer and animal manure. The total amount of P use in 2050 is smaller than recent projections in all regions except Africa (17). Accounting for the relative contribution of P from animal manure in global croplands under the GO scenario (32%) (12), global inorganic P fertilizer use must be 20.8 Tg in 2050. This is 10–40% less than estimated in other studies (12, 17, 23). The demand is even less for the other scenarios (Fig. 3B). However, a large part of the P in animal manure that is recycled in cropland originates in grasslands. This transfer of P from grasslands to cropland is particularly important in developing countries (12), and contributes to the build-up of residual soil P in cropland. Given the increasing future demand for grass (24), additional fertilizer P will be required to maintain soil fertility in the world's soils under grassland.
Our results suggest that residual soil P can contribute to crop production with a considerable lag time. The model results provide important information on where and how much P is needed to achieve food security in 2050. Because >80% of global P reserves is used in agricultural products (2), our results provide a firm basis to analyze depletion of global P reserves.
Materials and Methods
Model Structure.
In soil P models, generally different pools are distinguished. In our continental and global analysis, we used the DPPS model, which distinguishes two soil P pools (labile and stable). We chose the DPPS model because increasing the number of pools from two (labile and stable) to three (active, labile, and fixed) was shown not to improve model predictions, and can make calibration more difficult (25).
The DPPS model was used to simulate the long-term historical P uptake by crops for time series of P inputs, and to estimate the future P inputs for a specific future target P uptake. Different sources of P input to the system have been defined in the model, i.e., fertilizer, manure, weathering, and atmospheric depositions (Fig. 1). Withdrawal of P in harvested crops (uptake) and runoff (erosion) are two outflows from the system.
P inputs (excluding the runoff loss) are allocated to two dynamic P pools—namely, the stable (PS; 20%) and the labile P pools (PL; 80%). The model simulates the P transfers between the pools, the uptake of P by the crop, and the size of both pools (Fig. 1). To calculate the dynamics of P in these two pools, two differential equations are used:
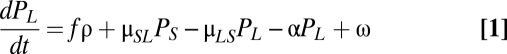 |
 |
The rates of P transfer from PL to PS and vice versa are denoted by μLS and μSL, respectively (y−1). The coefficient ρ refers to the total P input (mineral fertilizer and manure) after subtracting runoff loss of P. The coefficients f and 1 − f refer to the fraction of ρ that transfers to PL and PS, respectively. Coefficient α represents the crop P uptake fraction from PL. Parameters ω and δ are weathering and deposition inputs to PL and PS, respectively. A large μLS makes PL less available for plant uptake, and a large μSL indicates that the stable pool acts as a buffer that replenishes the labile pool.
The model can also be formulated in a target-oriented approach (26) in which the (future) P uptake is a model input and the P application a result, assuming no change in cropland area.
In Western Europe, Asia, and Latin America, the rapidly increasing P inputs did not lead to a similar increase of P uptake (Fig. 2 A, D, and E). Therefore, with increasing rate of P application and growing size of the PL, a coefficient to limit the uptake fraction was imposed (27).
We accounted for the dynamics of cultivated land as follows. Each year, the initial conditions (with no fertilizer history) are assigned to the new, additional area, and the crop P uptake in each segment is calculated based on the history of that segment and finally weighted by its corresponding fractional area. This method allows us to have differentiated productivity and soil contents of residual P for different parts of the total area.
Data Used.
Long-term crop yield, annual P fertilizer consumption, and areas of arable crops (1965–2007) were obtained from the Food and Agricultural Organization of the United Nations (FAO) (15), including different world regions.
We distinguished globally 161 different crops. P contents for each crop were obtained from different sources (28–30). Harvested P was calculated as production × P content of the harvested product.
Total P in manure production within pastoral, mixed, and industrial livestock production systems was computed from the animal stocks within these systems and their P excretion rates, based on various sources (31–35). Animal manure available for application to crops and grassland includes all stored or collected manure and excludes excretion in grazing land and animal manure used for other purposes (fuel, building material) or manure not used at all (such as manure from confined animal feeding operations collected in lagoons).
We used global values from Liu et al. (36) for P supply from weathering (1.6 Tg⋅y−1) and atmospheric deposition (0.4 Tg⋅y−1). These values were more conservative compared with 2 Tg⋅y−1 (weathering) and 1–2 Tg⋅y−1 (atmospheric deposition) estimated by Smil (2). From the global values we calculated the average P inputs per hectare (1 and 0.25 kg⋅ha−1⋅y−1 for weathering and deposition, respectively).
For runoff we used data from Bouwman et al. (12), who estimated that 10% of the total P input (fertilizer and manure) is lost from croplands, assuming that most of fertilizer P inputs are on flat terrains, such as river floodplains. Close to 80% of global arable land is on flat to gently undulating (<8% slopes) terrain, and close to 50% has slopes <2% (37, 38). Because in DPPS, fertilizer and manure directly enter the labile and stable pools, the calculated P loss by runoff is taken from the labile and stable pools in a ratio of 4:1.
Scenario Analysis.
Future needs of P fertilizer are calculated based on the target crop yields, given by four different MEA scenarios for 2050: GO, OS, TG, and AM (Table S3). Here we use the total P uptake for 2050 for the reactive GO scenario in different world regions. This scenario predicts the highest increase in global crop production among the four MEA scenarios, and the largest P uptake, i.e., 11.8 kg⋅ha−1⋅y−1 vs. 10.7 in AM, 10.9 in OS, and 11.4 in TG scenarios.
Sensitivity Analysis.
We analyzed the sensitivity of DPPS to variation of fixed model parameters μLS, μSL, f, and the percentage of the total P input lost due to runoff (for more information, see SI Materials and Methods). The implications of the uncertainty of the transfer time from the labile to the stable pool and from the stable to the labile pool are examined by increasing or decreasing the standard values by 50%.
We assessed the uncertainty of runoff loss of P by assuming larger fractions of the P inputs being lost. Though the standard case is based on a global average loss rate, in many countries, runoff and erosion loss may be more important. We therefore increased runoff P loss by a factor of 2 and 3 (20% and 30% of total inputs instead of the standard 10%).
The uncertainty in the fraction of total P input (mineral and manure) that transfers to labile (f) and stable pools (1 − f) was assessed by assuming 90% and 70% instead of the standard 80% for f and, consequently, 10% and 30% for 1 − f instead of the standard 20%.
Supplementary Material
Acknowledgments
We thank A. Smit (Plant Research International, Wageningen University and Research Center), J. Wolf (Wageningen University), and V. Joekar Niasar (Utrecht University) for many helpful discussions and suggestions for improvement. This project was funded by Wageningen University and Research Center Programs KB4 and C.T. de Wit Graduate School for Production Ecology and Resource Conservation.
Footnotes
The authors declare no conflict of interest.
This article is a PNAS Direct Submission.
See Commentary on page 5917.
This article contains supporting information online at www.pnas.org/lookup/suppl/doi:10.1073/pnas.1113675109/-/DCSupplemental.
References
- 1.Koning NBJ, et al. Long-term global availability of food: Continued abundance or new scarcity? Neth J Agric Sci. 2008;55:229–292. [Google Scholar]
- 2.Smil V. Phosphorus in the environment: Natural flows and human interferences. Annu Rev Energy Environ. 2000;25:25–53. [Google Scholar]
- 3.Syers JK, Johnston AE, Curtin D. Efficiency of Soil and Fertilizer Phosphorus Use: Reconciling Changing Concepts of Soil Phosphorus Behaviour with Agronomic Information. Rome: Food and Agriculture Organization of the United Nations; 2008. [Google Scholar]
- 4.Déry P, Anderson B. 2007. Peak phosphorus. Energy Bull (August 13). Available at http://www.energybulletin.net/node/33164.
- 5.Cordell D, Drangert J, White S. The story of phosphorus: Global food security and food for thought. Glob Environ Change. 2009;19:292–305. [Google Scholar]
- 6.Van Vuuren DP, Bouwman AF, Beusen AHW. Phosphorus demand for the 1970–2100 period: A scenario analysis of resource depletion. Governance, complexity and resilience. Glob Environ Change. 2010;20:428–439. [Google Scholar]
- 7.Van Kauwenbergh J. 2010 World phosphorus rock reserves and resources. Technical Bulletin IFDC-T-75 (Intl Fertilizer Dev Center, Muscle Shoals, AL) [Google Scholar]
- 8.Fairhurst T, Lefroy R, Mutert E, Batjes N. The importance, distribution and causes of phosphorus deficiency as a constraint to crop production in the tropics. Agroforestry Forum. 1999;9(4):2–8. [Google Scholar]
- 9.Sanchez PA. Properties and Management of Soils in the Tropics. New York: Wiley Interscience; 1976. [Google Scholar]
- 10.Smil V. Phosphorus: Global transfers. Causes and Consequences of Global Environmental Change. 2002;3:536–542. [Google Scholar]
- 11.Wolf J, De Wit C, Janssen B, Lathwell D. Modeling long-term crop response to fertilizer phosphorus. I. The model. Agron J. 1987;79:445–451. [Google Scholar]
- 12.Bouwman A, Beusen A, Billen G. Human alteration of the global nitrogen and phosphorus soil balances for the period 1970–2050. Global Biogeochem Cycles. 2009;Vol 23 doi: 10.1029/2009GB003576. [DOI] [Google Scholar]
- 13.Nuruzzaman MLH, Bolland MDA, Veneklaas EJ. Phosphorus uptake by grain legumes and subsequently grown wheat at different levels of residual phosphorus fertiliser. Aust J Agric Res. 2005;56:1041–1047. [Google Scholar]
- 14.Bruinsma JE. World Agriculture: Towards 2015/2030. An FAO Perspective. Earthscan, London: 2003. [Google Scholar]
- 15.Food and Agriculture Organization of the United Nations 2011. Production/crops and resource/fertilizer. FAOSTAT Database Collections. Available at http://faostat.fao.org/default.aspx.
- 16.Alcamo J, Van Vuuren D, Cramer W. Changes in ecosystem services and their drivers across the scenarios. In: Carpenter SR, Pingali PL, Bennett EM, Zurek MB, editors. Ecosystems and Human Well-Being: Scenarios. Vol 2. Washington, DC: Island; 2006. pp. 279–354. [Google Scholar]
- 17.Bouwman L, et al. Exploring global changes in nitrogen and phosphorus cycles in agriculture induced by livestock production over the 1900–2050 period. Proc Natl Acad Sci. 2011 doi: 10.1073/pnas.1012878108. [DOI] [PMC free article] [PubMed] [Google Scholar]
- 18.MacDonald GK, Bennett EM, Potter PA, Ramankutty N. Agronomic phosphorus imbalances across the world's croplands. Proc Natl Acad Sci USA. 2011;108:3086–3091. doi: 10.1073/pnas.1010808108. [DOI] [PMC free article] [PubMed] [Google Scholar]
- 19.Kamprath E. Residual effect of large applications of phosphorus on high phosphorus fixing soils. Agron J. 1967;59:25–27. [Google Scholar]
- 20.Mishima S, Endo A, Kohyama K. Recent trends in phosphate balance nationally and by region in Japan. Nutr Cycl Agroecosyst. 2010;86:69–77. [Google Scholar]
- 21.van Keulen H, Aarts HFM, Habekotté B, van der Meer HG, Spiertz JHJ. Soil–plant–animal relations in nutrient cycling: The case of dairy farming system ‘De Marke’. Eur J Agron. 2000;13:245–261. [Google Scholar]
- 22.Verloop J, Oenema J, Burgers SLG, Aarts HFM, Van Keulen H. P-equilibrium fertilization in an intensive dairy farming system: Effects on soil-P status, crop yield and P leaching. Nutr Cycl Agroecosyst. 2010;87:369–382. [Google Scholar]
- 23.Steen I. Phosphorus availability in the 21st century: Management of a non-renewable resource. Phosphorus Potassium. 1998;217:25–31. [Google Scholar]
- 24.Bouwman AF, Van der Hoek KW, Eickhout B, Soenario I. Exploring changes in world ruminant production systems. Agric Syst. 2005;84:121–153. [Google Scholar]
- 25.Bhogal A, Young SD, Ralph R, Bradley S, Craigon J. Modelling the residual effects of phosphate fertilizer in the Ropsley (UK) field trial 1978–1990. Nutr Cycl Agroecosyst. 1995;44(1):27–36. [Google Scholar]
- 26.Van Ittersum M, Rabbinge R. Concepts in production ecology for analysis and quantification of agricultural input-output combinations. Field Crops Res. 1997;52:197–208. [Google Scholar]
- 27.Janssen BH, Lathwell DJ, Wolf J. Modeling long-term crop response to fertilizer phosphorus. II. Comparison with field results. Agron J. 1987;79:452–458. [Google Scholar]
- 28.Bouwman A, Van Drecht G, Van der Hoek K. Nitrogen surface balances in intensive agricultural production systems in different world regions for the period 1970–2030. Pedosphere. 2005;15:137–155. [Google Scholar]
- 29.US Department of Agriculture 2006. Phosphorus content. National Agricultural Statistics Service. Available at http://www.nass.usda.gov. Accessed October 10, 2010.
- 30.US Department of Agriculture 2010. Phosphorus content. USDA National Nutrient Database for Standard Reference. Available at http://www.nal.usda.gov/fnic/foodcomp/search/. Accessed October 15, 2010.
- 31.Service MP. Livestock Waste Facilities Handbook. 2nd Ed. Ames, IA: Iowa State University; 1985. [Google Scholar]
- 32.Sheldrick W, Syers JK, Lingard J. Contribution of livestock excreta to nutrient balances. Nutr Cycl Agroecosyst. 2003;66:119–131. [Google Scholar]
- 33.Smith LW. Production systems. In: Putnam PA, editor. Handbook of Animal Science. San Diego: Academic; 1991. pp. 280–291. [Google Scholar]
- 34.Van Horn HH, Newton GL, Kunkle WE. Ruminant nutrition from an environmental perspective: Factors affecting whole-farm nutrient balance. J Anim Sci. 1996;74:3082–3102. doi: 10.2527/1996.74123082x. [DOI] [PubMed] [Google Scholar]
- 35.Wilkerson VA, Mertens DR, Casper DP. Prediction of excretion of manure and nitrogen by Holstein dairy cattle. J Dairy Sci. 1997;80:3193–3204. doi: 10.3168/jds.S0022-0302(97)76292-1. [DOI] [PubMed] [Google Scholar]
- 36.Liu Y, Villalba G, Ayres RU, Schroder H. Global phosphorus flows and environmental impacts from a consumption perspective. J Ind Ecol. 2008;12:229–247. [Google Scholar]
- 37.Bouwman AF, Kram T, Klein , Goldewijk K, editors. Integrated Modelling of Global Environmental Change. An Overview of IMAGE 2.4. The Hague: PBL Netherlands Environmental Assessment Agency; 2006. [Google Scholar]
- 38. National Geophysical Data Center (2012) A 30-arc-second (1-km) gridded, quality-controlled global digital elevation model (DEM). Available at http://www.ngdc.noaa.gov. Accessed January 20, 2012.
Associated Data
This section collects any data citations, data availability statements, or supplementary materials included in this article.