The authors demonstrated that Rbpms can reliably be used as an RGC marker for quantitative evaluation in rat models of excitotoxicity, optic nerve crush, and experimental glaucoma.
Abstract
Purpose.
To investigate whether a recently described retinal ganglion cell (RGC) marker Rbpms (RNA binding protein with multiple splicing) could be used for RGC quantification in various models of RGC degeneration.
Methods.
Optic nerve crush, excitotoxicity, and elevated intraocular pressure (IOP) rat models were used. Topographic analysis of Rbpms immunolabeling was performed on retinal wholemounts. Retrograde labelings with Fluorogold (FG) and III β-tubulin immunohistochemistry were compared.
Results.
In the optic nerve crush model, 37%, 87%, and 93% of Rbpms-positive cells were lost 1, 2, and 4 weeks, respectively. Significant loss of Rbpms-positive cells was noted 1 week after intravitreal injection of 12, 30, and 120 nmol N-methyl-d-aspartate (NMDA), whereas coinjection of 120 nmol of NMDA along with MK-801 increased the cell number from 10% to 59%. Over 95% of Rbpms-positive cells were FG- and III β-tubulin–positive after injury caused by optic nerve crush and NMDA injection. In rats with elevated IOP, induced by trabecular laser photocoagulation, there was a significant loss of Rbpms-positive cells compared with that of contralateral controls (P = 0.0004), and cumulative IOP elevation showed a strong linear relationship with the quantification of RGCs by Rbpms immunolabeling and retrograde labeling with FG. More than 99% of the remaining Rbpms-positive cells were double-labeled with FG.
Conclusions.
Rbpms can reliably be used as an RGC marker for quantitative evaluation in rat models of RGC degeneration, regardless of the nature and the location of the primary site of the injury and the extent of neurodegeneration.
The loss of vision in optic neuropathies is caused primarily by the degeneration of retinal ganglion cells (RGCs). The survival of RGCs in various animal models of RGC degeneration is commonly evaluated with retrograde labeling by injection of tracers such as Fluorogold (FG), dextran tetramethylrhodamine, or DiI into areas of the brain that are targeted by RGCs, primarily the superior colliculus (SC), or by exposure of an axotomized optic nerve to these dyes. However, both procedures have significant limitations. Since RGC retrograde labeling with these tracers depends on active axonal transport, neither of these labeling techniques can differentiate among cell body loss, axon degeneration, or failure of transport. This is particularly important when evaluating cell loss in animal models of glaucoma, in which axonal transport deficiency caused by elevated intraocular pressure (IOP) has been proposed to be a factor in RGC degeneration.1–3 Furthermore, labeling via the SC leaves uncounted those RGCs projecting to other brain regions.4 The application of tracers to the cut surface of the optic nerve overcomes these concerns, but requires a surgical procedure that alters gene expression in RGCs and leads to the initiation of RGC apoptosis. In addition to retrograde labeling, several antigenic RGC markers, including Thy 1, Brn3, III β-tubulin, neurofilament, and others, have been used to label these cells. Many of these markers are not specific to RGCs or do not label the entire RGC population.5–8 Therefore, retrograde labeling is still viewed as the most reliable and accurate way of identifying RGCs.
Recently, we characterized the expression of an RNA binding protein with multiple splicing (Rbpms), or hermes, in the retina9 and demonstrated that anti-Rbpms antibodies label over 99% of retrogradely labeled RGCs in the untreated rat retina.10 Since the level of gene expression may be significantly altered in response to various types of stress or injury, in this study we determined whether Rbpms can be used as an RGC marker for quantitative analysis of these cells in animal models of RGC degeneration induced by IOP elevation, optic nerve crush, and excitotoxicity.
Materials and Methods
Animals
The use of animals was approved by the Animal Research Committee of the University of California, Los Angeles. The procedures were performed in compliance with the ARVO Statement for the Use of Animals in Ophthalmic and Vision Research. Animals were housed with standard food and water provided without restriction. The light was turned on at 3:00 AM and off at 3:00 PM. The animals were kept at least 1 week in this environment before surgical procedures and IOP measurement. Surgical procedures were performed on one eye of each rat, whereas the contralateral eye served as an untreated control. Topical ophthalmic ointment (tobramycin, Tobrex; Alcon, Fort Worth, TX) was applied immediately after procedures.
Rat Models of RGC Degeneration
Excitotoxicity.
A previously described method was used to induce excitotoxic cell loss in rat retinas by intravitreal injection of N-methyl-d-aspartate (NMDA).11 Briefly, 3-month-old male Wistar rats were anesthetized by inhalation of isoflurane (3.5%–5%) in oxygen. After a topical application of 0.5% procaracaine hydrochloride, an intravitreal injection of 3 μL of 0.4, 1, 4, 10, and 40 mM (corresponding to 1.2, 3, 12, 30, and 120 nmol) neutralized NMDA (Sigma, St. Louis, MO) in 0.1 M PBS was administered unilaterally. The coinjection of MK-801 (1 mg/mL) was administered to antagonize the effect of 120 nmol NMDA. To define the dose–response of NMDA, animals were euthanized 1 week after injection.
Optic Nerve Crush.
After Wistar rats were anesthetized, the optic nerve was exposed without damaging the adjacent blood supply. A pair of extra-fine self-closing forceps was used to crush the optic nerve at 2 mm behind the globe for 10 seconds.12 The conjunctival incision was sutured. To examine the temporal response after optic nerve crush, animals were euthanized at 1, 2, and 4 weeks.
Experimental Glaucoma.
After 1 week of accommodation, both light- and dark-phase IOP were measured with a portable tonometer (TonoLab; Icare, Helsinki, Finland) twice a week at 10:00 AM and 5:00 PM, respectively, on 6-month-old male Brown Norway rats in the awake state. After topical anesthesia, five successful readings obtained with the tonometer were recorded. The IOP readings usually became more stable and consistent after 1 week. A previous method of trabecular laser photocoagulation was modified.13–15 Approximately 200 laser burns were delivered ab externo to the trabecular meshwork at laser settings of 200-μm diameter, 100-mW power, and 50-ms duration. Approximately 2 to 3 weeks after the first laser treatment, a second laser treatment was performed on eyes with no IOP elevation when compared with contralateral control eye. To correlate RGC loss labeled by Rbpms with various cumulative IOP elevation, laser photocoagulation was performed on 360° trabecular meshwork and animals were euthanized 3, 4, and 5 weeks after IOP elevation. To evaluate the specificity and sensitivity of Rbpms immunolabeling against retrograde labeling with FG, different levels of IOP elevation over 5 weeks were generated by performing laser photocoagulation on a range of 330° (30° at superior region received no laser) to 360° trabecular meshwork.
The tonometer (TonoLab) was calibrated with hydrostatic pressure ranging from 0 to 70 mm Hg in the eyes of anesthetized adult Brown Norway rats as measured manometrically. The linear regression equation was y = 1.06x + 0.58 with R2 = 0.98. For IOP analysis, all IOP readings were corrected to the actual IOP and presented as mm Hg in this study. The IOP reading in the eye with experimental glaucoma was compared with the contralateral control eye in the same animal. Cumulative IOP elevation, mean and peak of IOP, and IOP fluctuation were analyzed. Cumulative IOP elevation was calculated by performing separate integrations of the IOP over the days of exposure for the experimental and contralateral control eye (mm Hg–days).16 The control eye integral value was subtracted from the experimental eye integral. The mean and peak of IOP in the dark and light phases were also analyzed. The SD of IOP readings for the period after laser treatment was considered the IOP fluctuation.
Rbpms Immunohistochemistry on Retinal Wholemount
Animals were deeply anesthetized with intramuscular injections of 80 mg/kg sodium pentobarbital and then transcardially perfused with 4% paraformaldehyde in 0.1 M phosphate buffer. The eyes were enucleated and postfixed for 1 hour. According to published protocol,10 entire retinas were incubated with 10% fetal bovine serum for 1 hour to block nonspecific staining, and then immersed in the custom-made primary antibody against Rbpms in PBS containing 1% Triton, 0.5% BSA, and 0.9% sodium chloride (PBS-T-BSA) overnight at 4°C. Anti-Rbpms antibodies were generated against N-terminal GGKAEKENTPSEANLQEEEVR polypeptide (ProSci, Poway, CA) in our laboratory as described previously.10 After washing in PBS-T-BSA, the retinas were incubated with secondary Alexa Fluor 488 goat anti-rabbit IgG antibody (1/1000) overnight at 4°C. They were mounted flat with several radial cuts on a glass slide. After air-drying overnight, the retinas were counterstained with 4′,6′-diamidino-2-phenindole (DAPI) and mounted.
Retrograde Labeling
Procedures for retrograde labeling with Fluorogold (FG; Fluorochrome, Denver, CO) were performed as previously described.10,14 The procedure of applying FG at the transected optic nerve was selected because it ensured that all RGC axons were exposed to FG, including those RGCs projecting to areas other than the superior colliculus. Briefly, the optic nerve was exposed through a lateral conjunctival incision, and a cross section of the optic nerve was made with the needle knife through the opening of the optic nerve sheath, with care taken not to damage the adjacent blood supply. A gelfoam soaked with 6% FG was applied onto the surface of the transected optic nerve. The conjunctival incision was sutured and prophylactic antibiotic ointment was applied. The procedures were performed on only one eye to avoid bilateral blindness. The animals were euthanized 1 day after retrograde labeling.
RGC Quantification
Topographical analysis of immunolabeled cells was performed under a fluorescence microscope (LSM410; Carl Zeiss, Oberkochen, Germany).10 The retina was divided into four quadrants: superior, inferior, nasal, and temporal. Three sampling fields (0.32 × 0.24 mm each) were imaged at each region of 1, 2, 3, and 4 mm from the center of the optic nerve in each retina quadrant. In total, 48 images were captured on each retina. In each sampling field, the number of Rbpms-positive cells was counted in a masked manner. In this study, the average of cell counting on each retina was used for analysis. For statistical analysis, the density of immunopositive cells (number of cells per mm2) was compared. The percentage of cell loss was defined as the percentage of the decreased number of cells in the experimental eye against the density in the contralateral control eye of the same animal.
Double Fluorescence Immunohistochemistry of III β-Tubulin and Rbpms
The enucleated eyeballs were immersed in fixative for 1 hour, bisected, and postfixed for 3 hours. The eye cups were incubated with 30% sucrose at 4°C overnight and embedded in optical cutting temperature compound (O.C.T.; Sakura Finetec, Torrance, CA). Sections (10 μm thick) were obtained along the vertical meridian through the optic nerve head. Standard immunohistochemical procedures were performed with primary rabbit antibodies against Rbpms and mouse III β-tubulin (TUJI, 1:200, mouse; Covance, Emeryville, CA), and FITC-conjugated anti-rabbit and rhodamine-conjugated anti-mouse secondary antibody. Negative control sections were incubated without primary or secondary antibodies. For quantification, at least two retinal sections from each eye were collected. For each retinal section, the numbers of cells in the RGC layer labeled with immunoreactivity of (1) Rbpms and III β-tubulin, (2) Rbpms but no III β-tubulin, and (3) III β-tubulin but no Rbpms were counted. Retinal sections obtained from 3-month-old C57 black mice were included.
Double Labeling of FG and Rbpms in Models of Optic Neuropathy
To determine whether the FG-labeled RGCs expressed Rbpms, the above-cited retrograde labeling procedure at the transected optic nerve was performed 1 day before euthanasia. The dissected retinas were obtained from animals 1 week after 120 nmol NMDA injection, 4 weeks after optic nerve crush, and 5 weeks after IOP elevation, and then immunolabeled for Rbpms analysis. In each sampling field, the numbers of RGCs labeled by (1) FG and Rbpms immunoreactivity, (2) FG without Rbpms immunoreactivity, and (3) Rbpms immunoreactivity without FG were counted. The percentage of FG-positive cells labeled by Rbpms and the percentage of Rbpms-positive cells labeled by FG were calculated.
Statistical Analysis
Data were presented as the mean ± SD. Differences among groups were analyzed by one-way ANOVA, followed by the Student's t-test. P < 0.05 was considered statistically significant.
Results
Distribution of RGCs in Adult Rat Retinas
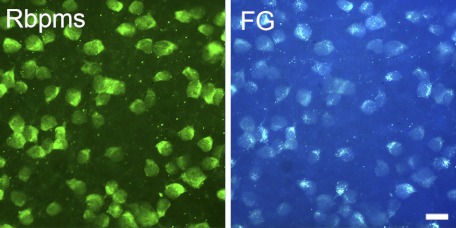
The distribution of RGCs in retinas was analyzed by Rbpms immunohistochemistry (Fig. 1A) and correlated with retrograde labeling with FG (Fig. 1B). Experiments were performed on rat wholemount retinas. The labeling of the cell bodies was discrete, with prominent cytoplasmic immunoreactivity counterstained by a nuclear dye, DAPI (Fig. 2A). The average numbers (±SD) of Rbpms-positive and FG-labeled cells were 2169 ± 149 and 2120 ± 132 per mm2, respectively (Table 1). Consistent with FG labeling, the density of Rbpms-positive cells was decreased from the posterior pole to the peripheral retina dependent on the distance from the center of the optic nerve head. The densities of FG- and Rbpms-labeled cells at four retinal (superior, inferior, temporal, and nasal) quadrants or at 1, 2, 3, and 4 mm from the center of optic nerve head (n = 4) were similar, and not statistically different (P > 0.05).
Figure 1.
Rbpms immunostaining and retrograde labeling of rat retinal wholemount. Approximately 99% of retinal ganglion cells retrogradely labeled by FG were also Rbpms-positive.
Figure 2.
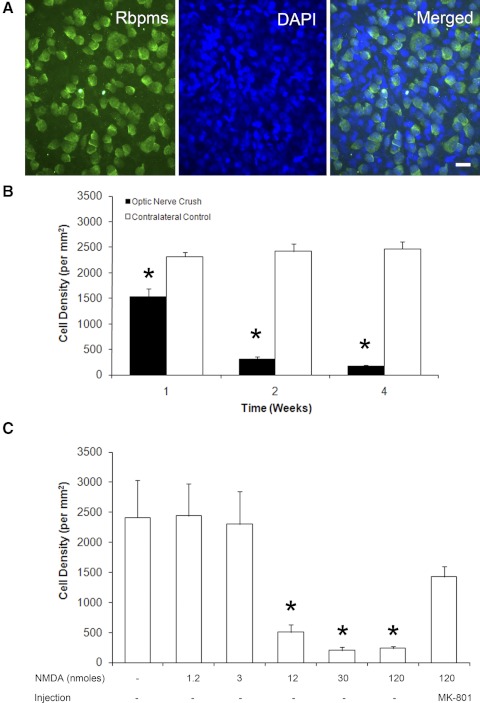
Temporal- and dose-dependent loss of Rbpms-positive cells after optic nerve crush and excitotoxicity, respectively. (A) Wholemount retinas were immunostained with Rbpms antibodies and counterstained with DAPI to visualize cell nuclei. Rbpms-positive cells make up only a portion of all cells in the retinal ganglion cell layer (RGCL), since rodent RGCL contains both RGCs and displaced amacrine cells in an approximately equal ratio. (B) The density of Rbpms-positive cells after optic nerve crush compared with contralateral control. Progressive loss of RGCs 1 week (37%), 2 weeks (87%), and 4 weeks (93%) after optic nerve injury were observed. (C) Significant decreases of Rbpms-positive cell density were noted 1 week after intravitreal injection of 12, 30, and 120 nmol NMDA. Injection of MK-801 reduced the excitotoxic effect of NMDA (120 nmol) RGCs.
Table 1.
Distribution of FG- and Rbpms-Labeled Cells in Rat Retinal Wholemounts (n = 4 per Group)
| Factor | Distance from Optic Nerve Head (mm) |
||||
|---|---|---|---|---|---|
| 1 | 2 | 3 | 4 | Average | |
| Cell density (per mm2) | |||||
| FG+ | 2691 ± 76 | 2554 ± 54 | 1858 ± 251 | 1377 ± 206 | 2120 ± 132 |
| Rbpms+ | 2744 ± 86 | 2603 ± 87 | 1911 ± 264 | 1418 ± 326 | 2169 ± 149 |
Temporal and Dose-Dependent RGC Loss after Optic Nerve Injury and Excitotoxicity
In the optic nerve crush model, 37%, 87%, and 93% loss of Rbpms-positive cells compared with the contralateral control retinas were observed at 1, 2, and 4 weeks after injury, respectively (Fig. 2B; n = 4 per group). The losses of Rbpms-positive cells were significant at 1 (P = 0.0001), 2 (P = 0.0001), and 4 weeks (P < 0.0001). There was no remarkable change in the density of Rbpms-positive cells in the contralateral control eyes.
The administration of 12 (P = 0.0013), 30 (P < 0.0001), and 120 (P < 0.0001) nmol of NMDA induced 79%, 92%, and 90% losses of Rbpms-positive cells, respectively, compared with controls (Fig. 2C; n = 4 per group). Coinjection of MK-801 significantly reduced the loss of Rbpms-positive cells induced by 120 nmol of NMDA from 90% to 41% (P = 0.018; n = 4).
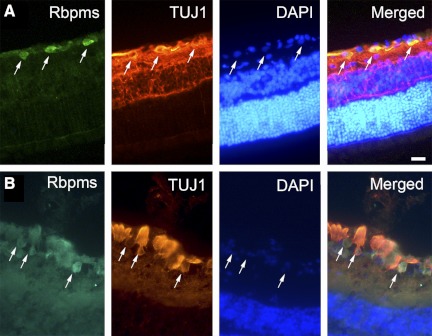
To confirm that the Rbpms-positive cells are RGCs, double-fluorescence immunohistochemistry with Rbpms and III β-tubulin (TUJ) was performed on retinal sections (Fig. 3A). Table 2 shows that >98% of Rbpms-positive cells were III β-tubulin immunopositive after injections of different concentrations of NMDA and optic nerve crush (n = 4 per group; total = 32). The percentages of III β-tubulin and Rbpms double-labeled cells after injuries and in control retinas were similar. In mouse retina, Rbpms-positive cells were also III β-tubulin immunopositive (Fig. 3B). Table 3 demonstrates that there was over 97% of FG-positive cells labeled by Rbpms 1 week after NMDA injection, whereas >98% of Rbpms-positive cells were labeled by FG. Both percentages in retinas 4 weeks after optic nerve crush significantly decreased when compared with control (P < 0.05).
Figure 3.
Colocalization of Rbpms- and III β tubulin–positive cells in rat (A) and mouse (B) retinas. Retinal sections were double immunolabeled with Rbpms and III β-tubulin antibodies and counterstained with nuclear DAPI. Cells positive for these two RGC markers are indicated by arrows.
Table 2.
Percentage of Rbpms-Positive Cells Labeled by III β-Tubulin 1 Week after Intravitreal Injection of NMDA and Optic Nerve Crush (n = 4 per Group)
| Group | Percentage of Rbpms+ Cells That Are III β-Tubulin+ |
|---|---|
| Untreated control | 98.83 ± 1.08 |
| 1.2 nmol NMDA | 98.79 ± 2.42 |
| 3 nmol NMDA | 100.00 |
| 12 nmol NMDA | 98.15 ± 3.21 |
| 30 nmol NMDA | 100.00 |
| 120 nmol NMDA | 100.00 |
| 120 nmol NMDA +3 μg MK-801 | 99.41 ± 0.89 |
| Contralateral control | 98.27 ± 2.00 |
| Optic nerve crush 1 week | 99.14 ± 0.65 |
Table 3.
Comparison between Rbpms Immunolabeling and Retrograde Labeling Using FG after NMDA Injection and Optic Nerve Crush
| Group | Percentage of Rbpms+ Cells That Are FG+ | P Value | Percentage of FG+ Cells That Are Rbpms+ | P Value |
|---|---|---|---|---|
| Untreated control (n = 6) | 99.71 ± 0.46 | — | 99.92 ± 0.06 | — |
| 120 nmol NMDA 1 wk (n = 7) | 98.28 ± 2.87 | 0.24 | 97.51 ± 3.98 | 0.16 |
| Optic nerve crush 4 wk (n = 5) | 95.68 ± 3.24 | 0.049* | 96.13 ± 2.51 | 0.028* |
P < 0.05.
RGC Loss Induced by IOP Elevation
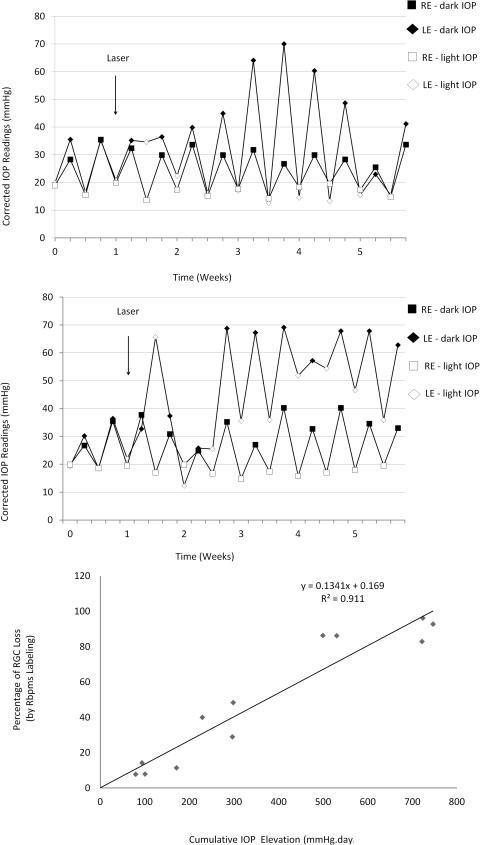
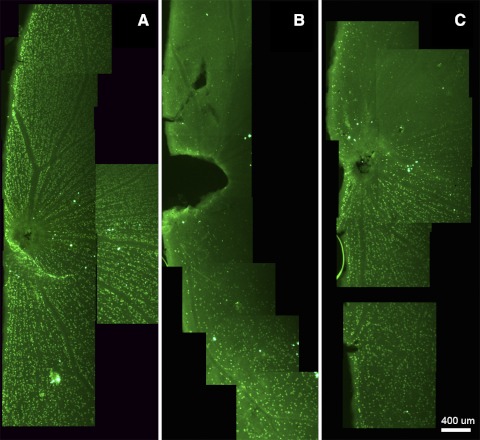
The average awake (corrected) IOPs in the dark and light phases of control Brown Norway rats were 32.0 ± 5.2 and 18.8 ± 2.1 mm Hg, respectively. Trabecular laser photocoagulation increased the average IOP by 45.5% to 46.6 ± 8.4 mm Hg in the dark phase and by 60.3% to 30.1 ± 14.2 mm Hg in the light phase. We observed large circadian IOP fluctuations persisting throughout the whole experiment and two distinguished patterns of IOP elevation. One group of animals (n = 7) had elevated dark IOP but not light IOP (Fig. 4A), whereas another group (n = 5) had both increased dark and light IOP (Fig. 4B). The observed IOP fluctuations in this laser model were similar to that reported by Morrison and colleagues for their hypertonic saline rat glaucoma model.17–19 To explore the relationship between RGC loss and cumulative IOP elevation, retinas were evaluated 3 (n = 2), 4 (n = 3), and 5 (n = 7) weeks after laser treatment. A range of cumulative IOP elevation from 88.2 to 792.4 mm Hg–days in animals was obtained to correlate with the graded RGC loss. Quantitative analysis demonstrated a variable decrease in Rbpms-positive cell density ranging from 7.8% to 96.2% in eyes with IOP elevation compared with contralateral controls (Fig. 5A) and topographical analysis showed uneven patterns of cell loss (Figs. 5B, 5C).
Figure 4.
Patterns of IOP elevation and the relationship between IOP and RGC loss. (A) Animal 1488R with cumulative IOP elevation of 298 mm Hg–days showing marked dark-phase IOP elevation. (B) Animal 1482R with cumulative IOP elevation of 721 mm Hg–days showing IOP elevation in both dark and light phases. (C) Relationship between cumulative IOP elevation and percentage loss of Rbpms-positive cells. There was a linear correlation, with the equation y = 0.13x − 0.17, R2 = 0.91. Filled diamonds and squares represent IOP readings in the dark phase, whereas open diamonds and squares represent IOP readings in the light phase. Diamonds represent right eyes with trabecular laser photocoagulation, whereas squares represent left control eyes.
Figure 5.
Distribution of RGCs in retinal wholemounts. (A) Rbpms-positive cells in control retina. (B) Severe loss of Rbpms-positive cells after 5 weeks of IOP elevation in both light and dark phases. Animal 1482R with 721 mm Hg–days demonstrated 83% loss of Rbpms-positive cells when compared with contralateral control. (C) Regional loss of Rbpms-positive cells at a retinal quadrant after 5 weeks of IOP elevation in the dark phase. The average loss of Rbpms-positive cells in Animal 1488R with 298 mm Hg–days was 48%.
Correlation between IOP Levels and RGC Loss
The correlation between the percentage loss of Rbpms-positive cells to the properties of IOP by performing univariate linear regression is summarized in Table 3. The cumulative IOP elevation (R2 = 0.91; Fig. 4C) and the mean of light- and dark-phase IOP (R2 = 0.92) showed a strong linear correlation with the percentage loss of Rbpms-positive cells. The IOP fluctuation (R2 = 0.03) and the peak of dark-phase IOP (R2 = 0.09) had a weaker correlation with the percentage loss of Rbpms-positive cells (Table 4).
Table 4.
Association of Rbpms-Positive Cell Loss with IOP Elevation by Univariate Linear Regression
| IOP | Slope | Intercept at x-Axis | R2 |
|---|---|---|---|
| Mean (light and dark) | 3.53 | 24.08 | 0.92 |
| Mean (light) | 2.18 | 7.06 | 0.72 |
| Mean (dark) | 3.52 | 32.25 | 0.67 |
| Peak (light and dark) | 3.30 | 48.29 | 0.42 |
| Peak (light) | 1.33 | 8.78 | 0.61 |
| Peak (dark) | 1.30 | 22.96 | 0.09 |
| Cumulative elevation | 0.94 | 0.18 | 0.91 |
| Fluctuation | −1.62 | 48.79 | 0.03 |
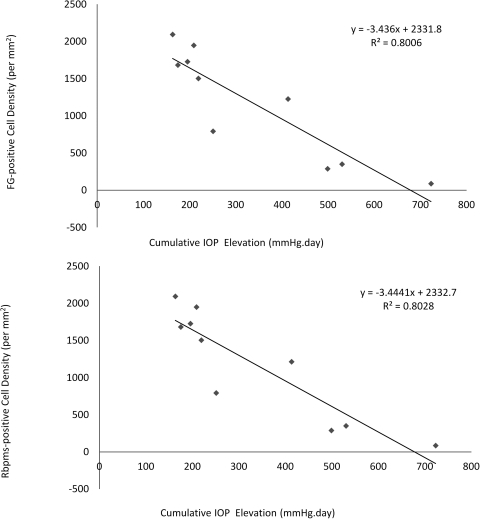
The percentages of RGC labeling by FG and Rbpms, and the levels of cumulative IOP elevation were compared. The average density of FG-positive cells decreased as the cumulative IOP elevation increased (Fig. 6A). The average density of Rbpms-positive cells showed a similar trend with the cumulative IOP elevation (Fig. 6B). Table 5 shows that the percentages of FG-positive cells labeled by Rbpms (99.53%) and Rbpms-positive cells labeled by FG (99.29%) in animals with IOP elevation were similar.
Figure 6.
Quantification of RGCs by FG and Rbpms labeling 5 weeks after IOP elevation. (A) Relationship between density of FG-positive cells and cumulative IOP elevation. There was a declining number of FG-positive cells when the cumulative IOP elevation increased. (B) Relationship between density of Rbpms-positive cells and cumulative IOP elevation. As the cumulative IOP increased, a similar linear trend of decreasing number of Rbpms-positive cells was noted. The levels of cumulative IOP elevation were adjusted by the area of trabecular meshwork (ranging from 330° to 360°) that received laser photocoagulation.
Table 5.
Specificity and Sensitivity of Rbpms Immunolabeling to Retrograde Labeling Using FG in Rat Glaucoma Model
| Animal | Percentage of FG+ Cells That Are Rbpms+ | Percentage of Rbpms+ Cells That Are FG+ | Cumulative IOP Elevation (mm Hg–days) |
|---|---|---|---|
| 1634R | 99.43 | 99.15 | 498.9 |
| 1635R | 99.77 | 99.30 | 530.2 |
| 1636R | 100.00 | 97.27 | 723.0 |
| 1788R | 100.00 | 100.00 | 163.3 |
| 1789R | 96.14 | 97.17 | 413.3 |
| 1795R | 100.00 | 100.00 | 250.8 |
| 1796R | 100.00 | 100.00 | 195.4 |
| 1797R | 100.00 | 100.00 | 219.0 |
| 1798R | 100.00 | 100.00 | 174.7 |
| 1799R | 100.00 | 100.00 | 208.8 |
| Average | 99.53 | 99.29 | |
| SD | 1.21 | 1.13 |
Discussion
We recently demonstrated that the expression of Rbpms in the retina is restricted to RGCs9 and consequently characterizes Rbpms as a new RGC marker.10 Immunolabeling with antibody against Rbpms detected over 99% of FG-labeled RGCs in rat retinal wholemounts, whereas <3% of Rbpms-positive cells were not retrogradely labeled by FG. Retrograde labeling of RGCs, despite the availability of several antigenic RGC markers, is considered to be the most reliable method to identify and quantify RGCs in control and injured retinas.5–8,12 This could be explained by the fact that most commonly known RGC markers are not specific to RGCs, or do not label the entire RGC population. Some markers may be not suitable for topographic quantification of RGC body on retinal wholemount due to strong immunoreactivity in nerve fiber bundles particularly at the region close to optic nerve head. Furthermore, some RGC markers are downregulated during RGC injury and become insufficient to identify RGCs. For instance, quantification of Brn3a-positive cells in the control rat retina revealed that 92.2% of the FG-positive cells were Brn3a positive and 3.4% of FG-positive cells did not express Brn3a.12 Only a portion of the FG-positive RGCs were labeled by a Brn3a antigenic RGC marker after optic nerve injury (crush and transection).
In the present study, we evaluated Rbpms as a potential RGC marker in retinas of three commonly used rat models of RGC degeneration: excitotoxicity, optic nerve crush, and ocular hypertension. These models have distinct sites of injury that likely trigger different pathways of RGC death. Intravitreal exposure to excessive NMDA overstimulates NMDA receptors on cell membranes of RGC bodies,11,20 whereas crush injury generates direct trauma to RGC axons. The parameters (NMDA dosage and time and intensity of crush) of these two models can be manipulated to generate desired levels of RGC loss. After intravitreal injection of NMDA and optic nerve crush, the dose- and temporal-dependent loss of RGCs was evaluated with immunolabeling of Rbpms and confirmed by double labeling of III β-tubulin and FG. Although the density of FG-positive cells labeled by Rbpms after optic nerve crush was reduced significantly, we believe that 96% of FG-prelabeled RGCs, which are immunolabeled by Rbpms, is satisfactory. These data indicate that Rbpms expression in a minority of RGCs (<4%) can be affected by the nature of injury. In the rat model of chronic IOP elevation, Rbpms immunolabeling identified 99% of FG-prelabeled RGCs, supporting that Rbpms immunolabeling may visualize RGCs with intact axonal transport. Less than 3% of Rbpms-positive cells in some individual animals (1636R and 1789R as shown in Table 5) were lacking FG and they were possibly considered as axonally damaged RGCs. This pattern is consistent with the hypothesis that retrograde transport is blocked at the optic nerve head region due to high IOP.21–23
Soto et al.24 studied the stages of RGC degeneration in a rat model of experimental glaucoma model with translimbal laser photocoagulation and performed γ-synuclein (Sncg) mRNA in situ hybridization on retinas after retrograde labeling of FG at both superior colliculi. There were 63.4% of nuclei in the RGC layer of the control rat retina labeled by both Sncg mRNA in situ hybridization signal and FG, whereas only 0.2% of RGCs expressed Sncg mRNA but were not labeled by FG. The authors found that the number of Sncg-positive cells without FG was dependent on the severity of RGC degeneration because Sncg-positive cells lacking FG totaled 10% and 85% in the rat retinas with mild and severe RGC degeneration, respectively. Our study was not able to correlate the axonal transport deficit of FG with the severity of RGC degeneration, but this discrepancy may be due to different stages or rates of disease progression in our rat model (3–5 weeks) and their rat laser model (10 and 29 days after translimbal laser), and probably different levels of dark-phase IOP elevation.
A strong correlation between RGC loss and cumulative IOP elevation was observed in the present study. Cumulative IOP elevation has been demonstrated as a crucial factor causing RGC loss in animal models of glaucoma.19 Unexpectedly, we found that the relationship between RGC loss and the mean of light and dark IOP is stronger than the mean of light IOP or the mean of dark IOP. However, this phenomenon could be strain specific. Consistent with published reports,13–15,17–19 we noticed that the IOP difference between the light and dark phase is larger in pigmented Brown Norway rats compared with albino Wistar rats. Nevertheless, this observation indicates that measurement of both light- and dark-phase IOP may be required in future studies in rat models of chronic IOP elevation.
In summary, the present findings extend our characterization of Rbpms as a reliable RGC marker, and demonstrate that Rbpms can be used for quantitative analysis of RGCs in animal models of RGC degeneration induced by excitotoxicity, optic nerve injury, and chronic IOP elevation. The results demonstrate that Rbpms immunolabeling may be effectively used regardless of the nature and the location of the injury site, and the extent of RGC loss. Efficient and reliable detection of RGCs with Rbpms immunolabeling may complement or be used as an alternative to retrograde labeling to reduce the potential disturbance of gene expression associated with an invasive labeling procedure.
Acknowledgments
The authors thank Sam C.-S. Chang for IOP measurement and Fei Yu for statistical advice.
Footnotes
Supported by National Eye Institute/National Institutes of Health Grant EY018644 (NP) and Research to Prevent Blindness (JC).
Disclosure: J.M.K. Kwong, None; A. Quan, None; H. Kyung, None; N. Piri, None; J. Caprioli, None
References
- 1. Anderson DR, Hendrickson A. Effect of intraocular pressure on rapid axoplasmic transport in monkey optic nerve. Invest Ophthalmol. 1974;13:771–783 [PubMed] [Google Scholar]
- 2. Quigley HA, Addicks EM. Chronic experimental glaucoma in primates. II. Effect of extended intraocular pressure elevation on optic nerve head and axonal transport. Invest Ophthalmol Vis Sci. 1980;19:137–152 [PubMed] [Google Scholar]
- 3. Quigley HA, Anderson DR. Distribution of axonal transport blockade by acute intraocular pressure elevation in the primate optic nerve head. Invest Ophthalmol Vis Sci. 1977;16:640–644 [PubMed] [Google Scholar]
- 4. Kobbert C, Apps R, Bechmann I, Lanciego JL, Mey J, Thanos S. Current concepts in neuroanatomical tracing. Prog Neurobiol. 2000;62:327–351 [DOI] [PubMed] [Google Scholar]
- 5. Beale R, Osborne NN. Localization of the Thy-1 antigen to the surfaces of rat retinal ganglion cells. Neurochem Int. 1982;4:587–595 [DOI] [PubMed] [Google Scholar]
- 6. Leahy KM, Ornberg RL, Wang Y, et al. Quantitative ex vivo detection of rodent retinal ganglion cells by immunolabeling Brn-3b. Exp Eye Res. 2004;79:131–140 [DOI] [PubMed] [Google Scholar]
- 7. Cui Q, Yip HK, Zhao RC, So FF, Harvey AR. Intraocular elevation of cyclic AMP potentiates ciliary neurotrophic factor-induced regeneration of adult rat retinal ganglion cell axons. Mol Cell Neurosci. 2003;1:49–61 [DOI] [PubMed] [Google Scholar]
- 8. Kong WC, Cho EYP. Antibodies against neurofilament subunits label retinal ganglion cells but not displaced amacrine cells of hamsters. Life Sci. 1999;64:1773–1778 [DOI] [PubMed] [Google Scholar]
- 9. Piri N, Kwong JM, Song M, Elashoff D, Caprioli J. Gene expression changes in the retina following optic nerve transection. Mol Vis. 2006;12:1660–1673 [PubMed] [Google Scholar]
- 10. Kwong JM, Caprioli J, Piri N. RNA binding protein with multiple splicing: a new marker for retinal ganglion cells. Invest Ophthalmol Vis Sci. 2010;51:1052–1058 [DOI] [PMC free article] [PubMed] [Google Scholar]
- 11. Lam TT, Abler AS, Kwong JMK, Tso MOM. N-Methyl-d-aspartate (NMDA) induced apoptosis in rat retina. Invest Ophthalmol Vis Sci. 1999;40:2391–2397 [PubMed] [Google Scholar]
- 12. Nadal-Nicolás FM, Jiménez-López M, Sobrado-Calvo P, et al. Brn3a as a marker of retinal ganglion cells: qualitative and quantitative time course studies in naive and optic nerve–injured retinas. Invest Ophthalmol Vis Sci. 2009;50:3860–3868 [DOI] [PubMed] [Google Scholar]
- 13. Kwong JMK, Caprioli J. Expression of phosphorylated c-Jun N-terminal protein kinase (JNK) in experimental glaucoma in rats. Exp Eye Res. 2006;82:576–582 [DOI] [PubMed] [Google Scholar]
- 14. Ishii Y, Kwong JMK, Caprioli J. Retinal ganglion cell protection with geranylgeranylacetone, a heat shock protein inducer, in a rat glaucoma model. Invest Ophthalmol Vis Sci. 2003;44:1982–1992 [PubMed] [Google Scholar]
- 15. Munemasa Y, Ahn J, Kwong JMK, Caprioli J, Piri N. Redox proteins Thioredoxin 1 and Thioredoxin 2 support retinal ganglion cell survival in experimental glaucoma. Gene Ther. 2009;16:17–25 [DOI] [PubMed] [Google Scholar]
- 16. McKinnon SJ, Lehman DM, Tahzib NG, et al. Baculoviral IAP Repeat-containing-4 protects optic nerve axons in a rat glaucoma model. Mol Ther. 2002;5:780–787 [DOI] [PubMed] [Google Scholar]
- 17. Moore CG, Johnson EC, Morrison JC. Circadian rhythm of intraocular pressure in the rat. Curr Eye Res. 1996;15:185–191 [DOI] [PubMed] [Google Scholar]
- 18. Morrison JC, Moore CG, Deppmeier LM, Gold BG, Meshul CK, Johnson EC. A rat model of chronic pressure-induced optic nerve damage. Exp Eye Res. 1997;64:85–96 [DOI] [PubMed] [Google Scholar]
- 19. Jia L, Cepurna WO, Johnson EC, Morrison JC. Patterns of intraocular pressure elevation after aqueous humor outflow obstruction in rats. Invest Ophthalmol Vis Sci. 2000;41:1380–1385 [PubMed] [Google Scholar]
- 20. Vorwerk CK, Gorla MS, Dreyer EB. An experimental basis for implicating excitotoxicity in glaucomatous optic neuropathy. Surv Ophthalmol. 1999;43:S142–S150 [DOI] [PubMed] [Google Scholar]
- 21. Minckler DS, Tso MO, Zimmerman LE. A light microscopic, autoradiographic study of axoplasmic transport in the optic nerve head during ocular hypotony, increased intraocular pressure, and papilledema. Am J Ophthalmol. 1976;82:741–757 [DOI] [PubMed] [Google Scholar]
- 22. Quigley HA, Addicks EM, Green WR, Maumenee AE. Optic nerve damage in human glaucoma. II. The site of injury and susceptibility to damage. Arch Ophthalmol. 1981;99:635–649 [DOI] [PubMed] [Google Scholar]
- 23. Pease ME, McKinnon SJ, Quigley HA, Kerrigan-Baumrind LA, Zack DJ. Obstructed axonal transport of BDNF and its receptor TrkB in experimental glaucoma. Invest Ophthalmol Vis Sci. 2000;41:764–774 [PubMed] [Google Scholar]
- 24. Soto I, Pease ME, Son JL, Shi X, Quigley HA, Marsh-Armstrong N. Retinal ganglion cell loss in a rat ocular hypertension model is sectorial and involves early optic nerve axon loss. Invest Ophthalmol Vis Sci. 2011;52:434–441 [DOI] [PMC free article] [PubMed] [Google Scholar]


