Derivatization prior to detection by MS is employed especially to enhance and normalize analyte response. One class of analytes needing improved detection in this way is DNA adducts (damaged nucleotides in DNA). This is because DNA adducts are structurally diverse, present in trace amounts in biological samples, often encountered as unknowns, and tend to vary in their response by MS. For example, in regard to adducts in a nucleoside form, the response of 1,N6-etheno-dA was reported to be 17 times higher than that of dU.1 Detection of DNA adducts by MS has been reviewed.2,3 MS is also important for measurement of modified nucleotides in DNA that play a role in epigenetics, such as 5-hydroxymethylcytosine.4,5
Of particular interest to us is the detection of DNA adducts as nucleotides, in part because the technique of 32P-postlabeling has been employed widely for detection of DNA adducts in this form,6 making it easier to employ 32P-postlabeling and MS as companion techniques. This could improve the detection of DNA adducts, since 32P-postlabeling has some shortcomings that MS potentially can help to overcome if it is sensitive enough. 32P-postlabeling gives little or no qualitative information about unknown adducts. It has a problem with variation in response largely because labeling yield depends on adduct structure.7,8 Even though its radioenzymatic labeling step targets nucleotides, compounds that are not nucleotides can be labeled and detected.9 A prior effort to improve nucleotide response by LC-ESI-MS/MS via derivatization gave a 3–4 fold signal enhancement, and normalization of response was not studied.10
Previously we reported that a BODIPY dye-imidazole conjugate could be attached specifically to the phosphate moiety of nucleotides under aqueous conditions in the presence of a water soluble carbodiimide.11 Here we report that benzoylhistamine (BH) conjugates of a diversity of nucleotides are highly sensitive and give a similar response as molecular anions by MALDI-MS. Based on this, a new, advantageous way for mass spectrometry to provide nontargeted analysis of modified nucleotides is presented.
EXPERIMENTAL
Materials
The Qiagen Blood & Cell Culture Maxi Kit was purchased from Qiagen (Valencia, CA). Nuclease P1, 1-ethyl-3-[3-(dimethylamino)propyl]carbodiimide (EDC), 2-N-(morpholino)ethanesulfonic acid (MES), α-cyano-4-hydroxy-cinnamic acid (CCA), ammonium citrate (dibasic), triethylammonium acetate buffer (TEAA, 1M), 5-hydroxymethyl-2′-deoxyuridine, thymidine-5′-monophosphate (TMP) and triethylammonium bicarbonate buffer (1M) were from Sigma (St. Louis, MO). Phosphodiesterase I was from Worthington (Lakewood, NJ). BIOMAX-5 Ultrafree MC centrifugal filter devices were from Millipore (Billerica, MA). Propanesulfonic acid silica was from J. T. Baker (Phillipsburg, NJ). Microcentrifuge tubes, pipetter tips, and HPLC grade acetonitrile (ACN) were from Fisher Scientific (Pittsburgh, PA). All materials were used as received. Human placenta from a smoker was obtained from the National Disease Research Interchange (Philadelphia, PA). Benzoylhistamine (BH) and d4-benzoylhistamine (d4-BH) were synthesized as described.12 ThymineGlycolThymineDimer (0801215) was a gift from ZeptoMetrix (Buffalo, NY). CS Chem3D Pro software was from CambridgeSoft Corporation (Cambridge, MA).
DNA was isolated using a Qiagen Blood & Cell Culture Maxi Kit. Digestion of 25 μg of DNA to nucleotides was done with nuclease P1 at pH 5.5 followed with phosphodiesterase I at pH 9, 3 hours at 45 °C for both. The DNA digest was filtered with a Ultrafree-MC Biomax-5 Membrane 5 kDa filter.
Digested DNA (3 μg aliquot) was dried, and redissolved in 20 μL of 80 mM triethylammonium bicarbonate buffer for HPLC separation, using an XBridge C18 column (1×150 mm, 3.5 μm). The gradient flow rate was 30 μL/min, from 1% to 30 % ACN in 30 min, with 20 mM triethylammonium bicarbonate buffer at pH 8.5. Based on monitoring by absorbance, fractions were collected between the peaks for the four major normal nucleotides, and evaporated in a Speed Vac (Savant Instruments, Nassau-Suffolk, NY).
The labeling reaction was performed by adding 3.5 μL of 12 mM BH (do-BH) or d4-BH (6 mM BH and 6 mM d4-BH when isotopologue labeling with tag mixture was done), and 3.5 μL of 80 mM EDC, in 0.01 M MES buffer at pH 6, to the dried HPLC collection vial, and then, after mixing, the sample was kept at room temperature for 3 hours.
The residual BH tag and EDC were removed with an UltraMicroSpin Column (The Nest Group, Southborough, MA) packed with 55 μL of propyl sulfonic acid silica, followed by evaporation and then redissolving in 5 μL of TEAA buffer (0.02 M at pH 7, 3% methanol, 3% ACN). The sample was injected into a trapping column (PepMap C18, 300 μm ID × 5 mm) on a column switching module of a Micro-LC system (Dionex, Sunnyvale, CA) at a flow rate of 7 μL/min with 20 mM TEAA buffer containing 1% ACN for 4 min, then 2 min at 14 μL/min. Switching was then done onto a capillary column (180 μm I.D × 150 mm), which was gradient eluted from 3% to 60 % ACN in 40 min at 2.2 μL/min. A droplet was collected onto a MALDI plate every 20 sec with a Probot Micro Fraction Collector (Dionex, Sunnyvale, CA).
CCA matrix (0.5 μl, 5 mg/mL in ACN: water, 50:50, v/v, with 2.5 mM of ammonium citrate, dibasic) was deposited on each dried spot, followed by air-drying for 5 min. For calibration, a reference compound (e.g. 1,N6-etheno dAMP subjected to BH-labeling) can be included in the CCA matrix solution. Analysis was done on a Voyager DE STR MALDI-TOF-MS or a Model 5800 MALDI-TOF/TOF-MS (AB SCIEX, Foster City, CA) in a negative, reflectron mode with a delay time of 150 ns. Each sample well was surveyed to find “sweet spot”, and then 400 laser pulses were averaged to generate a spectrum. MS/MS was performed with a medium pressure of air and a mass resolution window of 400 with the metastable-suppresor on.
RESULTS AND DISCUSSION
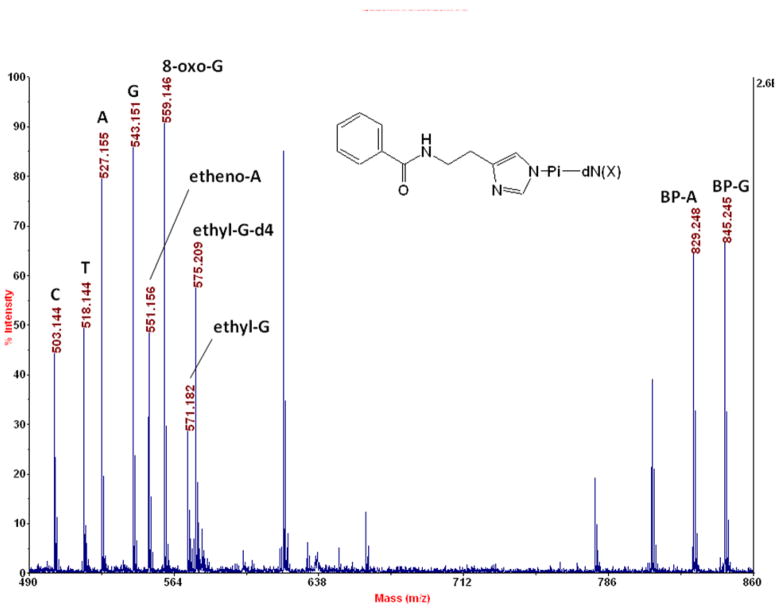
Similar responses (within a factor of < 3) of high intensity are observed for benzoylhistamine (BH) phosphorimidazolide conjugates of a diversity of nucleotides as seen in Figure 1, where 50 fmol amounts as standards are detected by MALDI-TOF-MS in the negative ion mode. Note that accurate masses of parent ions are being detected. Without the BH tag, response is lower, especially for smaller DNA adducts. For example, the BH tag boosts the response for 1,N6-etheno-dAMP by 250-fold in this mode (data not shown for the unlabeled nucleotide). The BH-labeling/MALDI technique is similarly useful for detecting ribonucleotides (data not shown).
Figure 1.
Detection of four BH-labeled normal deoxynucleotides (C: dCMP at 503.144, T: TMP at 518.144, A: dAMP at 527.155, G: dGMP at 543.151) and five BH-labeled DNA adducts (1,N6-etheno-dAMP at 551.156, 8-oxo-dGMP at 559.146, N2-ethyl-dGMP at 571.182, BP-A at 829.248, and BP-G at 845.245), along with an internal standard (N2-ethyl-d4-dGMP at 575.209) by MALDI-TOF-MS. A sample volume of 0.5 μL containing 50 fmol each of these compounds, that was also 0.5 mg/mL in α-cyano-4-hydroxycinnamic acid (CCA matrix) in 50% in acetonitrile, was deposited manually onto a stainless steel plate (AB SCIEX V70066), and the spectrum was summed from 50 laser pulses on a MALDI-TOF-MS (AB SCIEX Voyager DE STR) in the reflectron mode. BH, benzoylhistamine; dN (the deoxynucleoside part of a normal DNA mononucleotide); dN(X), a DNA adduct; BP-A, benzo[a]pyrene diolepoxide adduct of dAMP; BP-G, benzo[a]pyrene diolepoxide adduct of dGMP. The observed masses matched the exact masses exactly except for A (exact mass 527.156), ethyl-G-d4 (527.207), and BP-A (829.250). Internal calibration was done: the peaks for C, BP-G, and etheno-A were employed, but their masses were allowed to vary in the calculation.
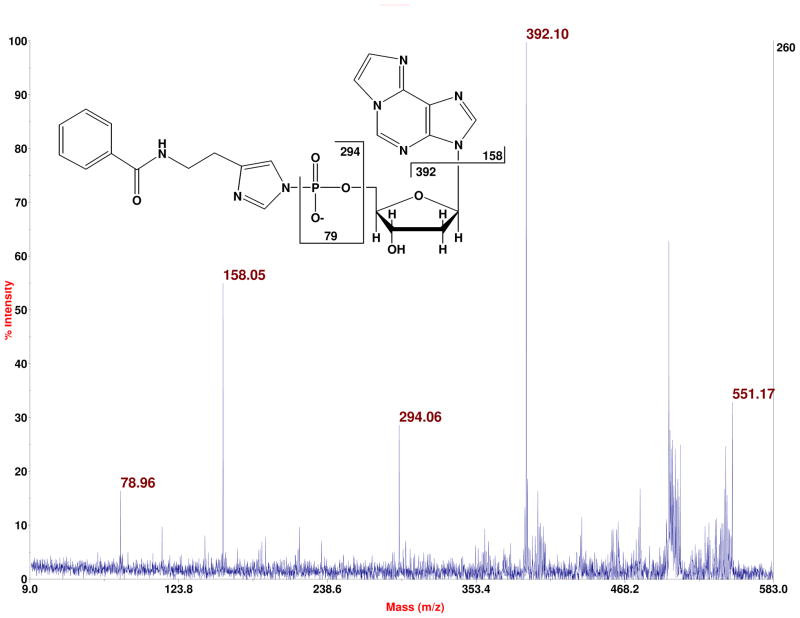
This benzoylhistamine/MALDI strategy for detection of DNA adducts has two other features that are important. First, by means of post-source decay or post-source collision-induced dissociation (CID), ions corresponding to tag-phosphate-sugar and nucleobase are readily observed. The former ion, from cleavage of the glycosidic bond, distinguishes deoxyribonucleotides (m/z 392) from ribonucleotides (m/z 408). This is illustrated for a deoxynucleotide in a CID experiment in which 80 amol of BH-1,N6-etheno-dAMP is tested, as seen in Figure 2. In a corresponding non-CID spectrum (data not shown) on 80 amol, the S/N is 200 for the parent ion at m/z 551. Second, one can also employ benzoylhistamine-d4 to either label a given sample of nucleotides with a cocktail of the two tags (isotopologue d0,d4 labeling) to detect DNA adducts as precisely-spaced peak pairs (enhancing specificity to help distinguish signals from noise), or one can measure ratios of a given adduct in different samples by labeling each sample with a different tag prior to combining the samples.
Figure 2.
Daughter ions (post-source collision-induced dissociation of M− at 551.17) from BH-labeled 1,N6-etheno-dA. A sample volume of 40 nL containing 80 amol of this compound in 5 mg/mL CCA matrix with 0.5 mg/mL ammonium citrate in 50% acetontrile was deposited onto a stainless steel plate (AB SCIEX 1018497) using a TEMPO (AB-SCIEX), and the spectrum was summed from 400 laser pulses on a MALDI-TOF/TOF-MS (AB SCIEX 5800).
The technique can be applied to biological samples by the sequence of DNA extraction, digestion to nucleotides, partial chromatographic resolution of modified nucleotides by solid phase extraction13 or HPLC (described here), labeling with isotopologue benzoylhistamines (60% yield), post-derivatization sample cleanup (ion exchange solid phase extraction followed by HPLC), eluent spotting, and detection by MALDI-TOF-MS. Currently data from the latter step is screened manually for do,d4 peak pairs that signify potential modified deoxynucleotides. Next MALDI-TOF/TOF-MS is done to confirm such species based on formation from the parent ion pair of a daughter ion pair at m/z 392 and 396 for the d0/d4 ions of BH-phosphate-deoxyribose. Other fragmentation ions are usually seen simultaneously that can provide additional structural information.
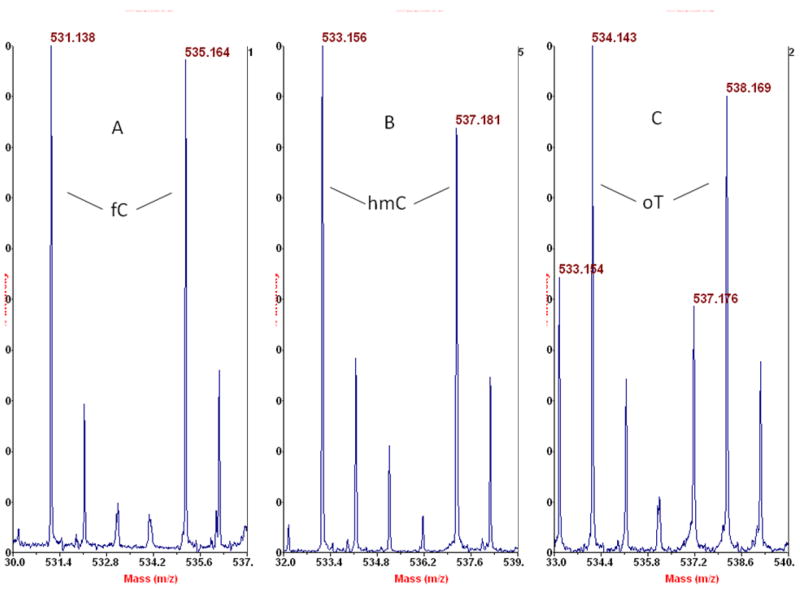
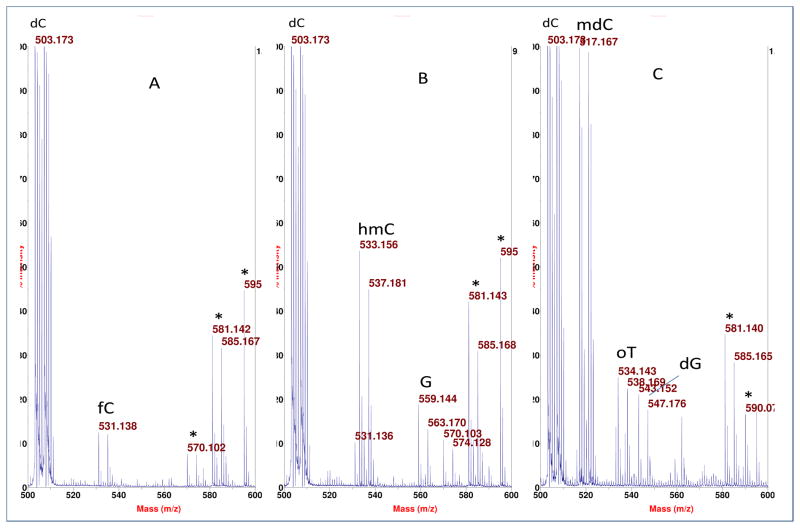
Starting with human placenta from a smoker, we detected, in one of the HPLC fractions (between the peaks for dCMP and TMP), two known, nucleobase modifications of DNA (in their BH-deoxynucleotide or BHdnt forms): 5-hydroxymethylcytosine (hmC), and 5-formylcytosine (fC), as seen in parts A and B, respectively, of Figure 3. More of the m/z neighborhood for the data in Figure 3A,B is shown in Figure 4A,B, as well as for Figure 3C to be discussed subsequently. The intense peak for dCMP in the spectra of Figure 4 is due to extended tailing at the trace level from early-eluting dCMP, which gives the benefit of keeping background nucleotide present throughout the HPLC separation to minimize analyte losses on active sites, while also causing ion suppression of closely-eluting subsequent peaks that compromises sensitivity. A peak pair for GMP is seen in Figure 4B apparently from incomplete removal of RNA from the DNA sample. This peak pair was confirmed to be GMP (rather than 8-oxo-dGMP, an isobar) by MALDI-TOF/TOF-MS, where the do,d4 peak pair of BH-phosphate-ribose was observed at m/z 408 and 412 (without any peaks at m/z 392 and 396 for BH-phosphate-deoxyribose), along with a peak at m/z 150 for guanine (without any peak at 166 for 8-oxo-guanine).
Figure 3.
Detection of isotopologue BH-deoxynucleotides from placental DNA by negative ion MALDI-TOF-MS. A: fC-BHdnt; B: hmC-BHdnt; C: putative 6-oxo-T-BHdnt, designated here as oT. Exact masses: fC (531.1393), hmC (533.1550), oT (534.1390).
Figure 4.
Larger m/z scales for the corresponding data shown in Figure 3. The peak pairs marked with an asteric may be artifacts, e.g. m/z 586 and 585 might be an adduct ion of BH-phosphate-sugar with matrix. G: BH-GMP.
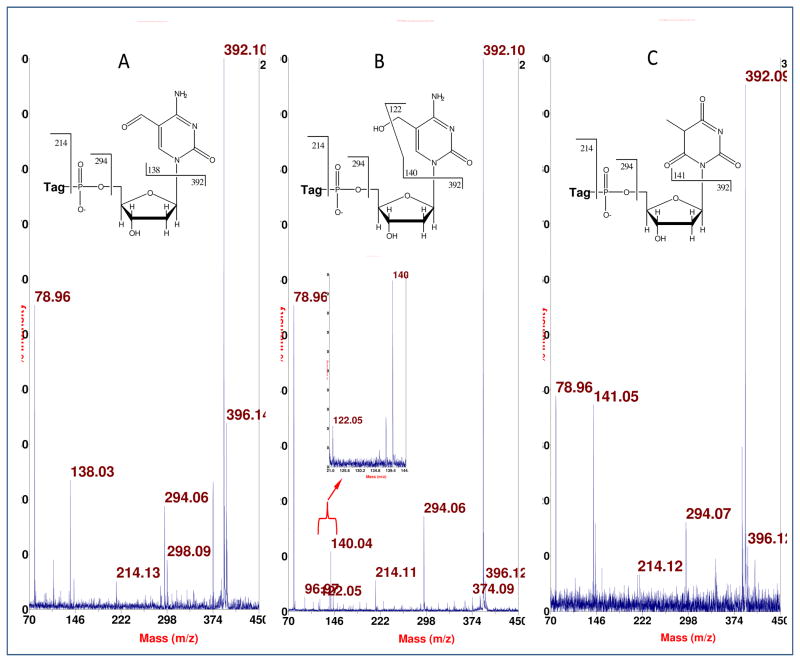
The assignments for the data in Figure 3A,B (and Figure 4A,B) were made based on accurate mass measurements, and also on the fragmentation data shown in Figure 5A,B. In Figure 5A, an M− for fC-BHdnt (531 Da) was subjected to CID, giving three common ions for BH-labeled deoxynucleotides (79 u: phosphate; 294 and 298 u: BH-phosphate as a pair of isotopologue ions; 392 and 396 u: similarly BH-phosphate-deoxyribose ions) along with a peak for the fC-nucleobase anion at 138 u. In Figure 5B, the same three common ions are observed, along with a peak at m/z 140 for the hmC-nucleobase anion. Also seen in this latter spectrum, which is clearer in the expanded part shown in the inset, is a peak at m/z 122 due to loss of water from the hmC-nucleobase anion.
Figure 5.
Fragmentation analysis by negative ion MALDI-TOF-MS of deprotonated molecules of: A, fC-BHdnt; B: hmC-BHdnt; C: oT-BHdnt.
Initially, upon obtaining the data shown in Figure 3C, we assumed that we were detecting the BHdnt form of 5-hydroxymethyluracil (hmU), a known compound which can be formed as a DNA adduct. However, as seen in Figure 5C, where an M− (534 Da) for this compound is subjected to CID, no loss of water is observed (no peak above noise at m/z 123) from the nucleobase anion (141 u), even though such loss should take place, just as it does for hmC. (Also seen in Figure 5C are the three common ions already discussed above.) This led us to postulate that the nucleobase of the BH-deoxynucleotide being detected in these mass spectra (Figures 3C and 5C) was 6-oxothymine (5-methylbarbituric acid, an isobar of hmU) or one or more of its tautomers, which we will now designate as putative 6-oxo-T, a species which should resist loss of water in any of its tautomeric forms.
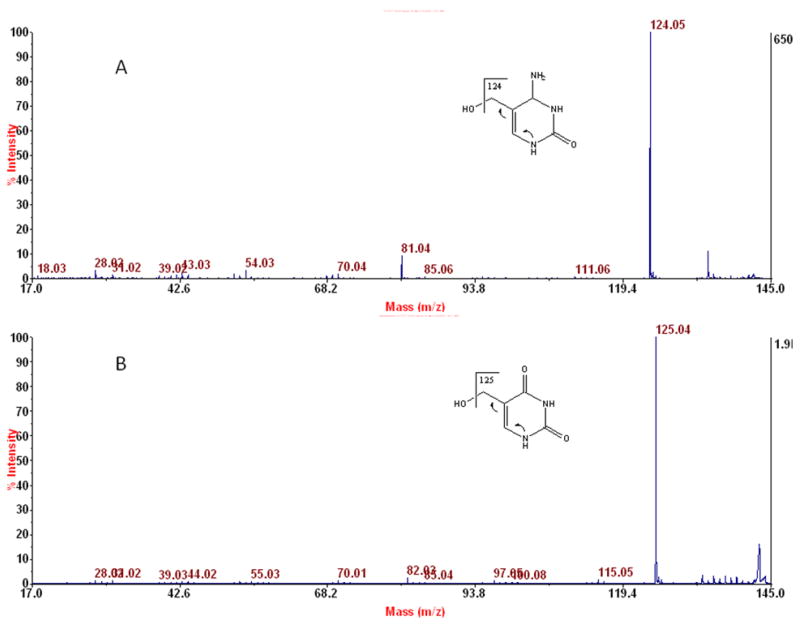
To further support the assignment of Figures 3C and 5C to putative 6-oxo-T, we obtained the data shown in Figures 6–8. For the data in Figure 6A, hmC-BHdnt from placental DNA was subjected to MALDI-TOF/TOF-MS in the positive mode, and the protonated hmC-base (m/z 142) from the ion source was subjected to CID. As seen in Figure 6A, the spectrum is dominated by a peak at m/z 124 due to loss of water from m/z 142. (Because the metabolic ion suppressor was on, to avoid overloading the detector with m/z 142, no m/z 142 is seen.) A similar experiment with 5-hydroxymethyl-2′-deoxyuridine, which yielded m/z 143 (hmU-protonated nucleobase) from the ion source, similarly gave a major fragment ion at m/z 125 from loss of water, as seen in Figure 6B. Thus, as anticipated, hmU, like hmC, readily loses water in CID.
Figure 6.
Fragmentation analysis by positive ion MALDI-TOF/TOF-MS of protonated nucleobases formed in the ion source from the following samples: A: hmC-BHdnt isolated from placental DNA; B: 5-hydroxymethyl-2′-deoxyuridine (purchased).
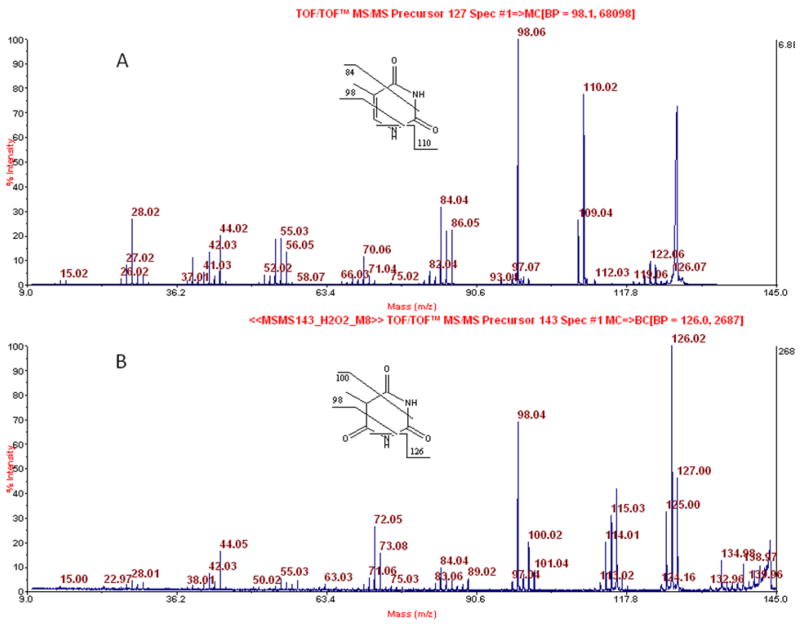
Figure 8.
Positive ion MALDI-TOF/TOF-MS of the sample tested in Figure 6. A. Spectrum from CID of m/z 127. B. Spectrum from CID of m/z 143. Accompanying losses of hydrogen atoms are not always depicted.
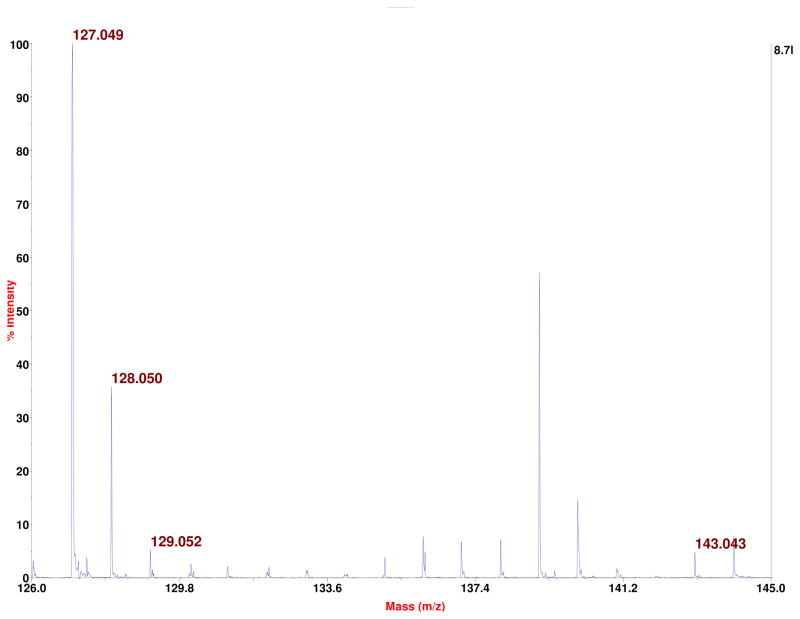
Towards a goal of confirming more strongly that putative 6-oxo-T is not 5-hydroxymethyluracil (hmU), we reacted TMP with hydrogen peroxide (10% H2O2 overnight at room temperature), followed by BH-labeling, HPLC, fraction collection, and negative ion MS analysis. This gave a product with the same chromatographic and negative ion mass spectral properties as the putative 6-oxo-T from placenta. In parallel we had reacted thymidine with hydrogen peroxide, and the product, without HPLC separation, was subjected to positive ion MALDI-TOF-MS. This gave the data shown in Figure 7, where a peak for the protonated thymine nucleobase is seen at m/z 127, along with a peak for protonated oxidized thymine nucleobase at m/z 143. Since the peak for m/z 127 was above saturation, there is no information about the relative abundance of m/z 127 and m/z 143 in the figure. Subjecting m/z 127 to CID gave the data shown (and partly assigned) in Figure 8A. Similar analysis of m/z 143 gave the data and assignment shown in Figure 8B. As seen, the fragmentation of m/z 143 (protonated putative 6-oxo-T nucleobase) is very different from that of the protonated hmU nucleobase (Figure 6B). While there is a peak at m/z 125 in Figure 8B, that might in principle come from loss of water by m/z 143, a corresponding peak at m/z 109 is present in Figure 8A in spite of the absence of an OH group in thymine. Neither m/z 125 nor m/z 109 is a matrix peak. Alternatively, our reaction of TMP with hydrogen peroxide may have formed some hmU-deoxynucleotide that was present in the HPLC fraction examined, contributing to m/z 125 in Figure 8B. (In regard to the structural assignments for the fragmentation peaks that we have made in both parts of Figure 8, the unit at C3N3, in principle, could be lost in each case rather than the unit at C1N6, as shown.) The combined data of Figures 5–8, encompassing CID data in both negative and positive ion modes, establishes that putative 6-oxo-T cannot be hmU.
Figure 7.
Positive ion MALDI-TOF-MS spectrum of thymidine after reaction with hydrogen peroxide followed by MALDI-MS. A peak for protonated thymine nucleobase (formed in the ion source) is seen at m/z 127, along with a peak at m/z 143 which corresponds to protonated putative 6-oxo-thymine (and also, in principle, protonated 5-hydroxymethyluracil).
Thymine glycol, or 5,6-dihydroxy-5,6-dihydrothymine, is a major product in the reaction of thymine with reactive oxygen species.14,15 It has never been reported to dehydrate to form 6-oxo-T, lacks favorable geometry for this at its 5,6 positions,16 and actually was reported to not undergo this conversion (to 5-methylbarbituric acid).17 Nevertheless, we still wondered whether putative 6-oxo-T might form artifactually in our MALDI ion source from thymine glycol. However, neither thymine glycol-BH (that we synthesized from thymidine essentially as described for a DNA-oligomer18), nor an authentic dinucleotide containing a thymine glycol (acquired from ZeptoMetrix) showed any loss of water when tested in this way. Thus, at least under our MALDI source conditions, thymine glycol is not a precursor of putative 6-oxo-T.
The data shown for putative 6-oxo-T in Figures 3 and 5 came from the HPLC fraction collected between the peaks for dCMP and TMP. Since hmU-deoxynucleotide is reported to elute much earlier than the corresponding thymine deoxynucleotide,19 as one would expect, we considered that analyzing fractions collected from this region might reveal separate peaks for hmU and 6-oxo-T as deoxynucleotides. While this may have been the case (we collected and tested three fractions in this region, and dehydration of m/z 143 apparently was elevated in the earlier fraction), the signal-to-noise ratio was too low to provide reliable information.
It is interesting to consider why putative 6-oxo-T has not been reported before in DNA, in spite of extensive studies of DNA oxidation. Aside from its postulated occurrence here in DNA, 6-oxo-T is a known compound: 5-methylbarbituric acid.17 For the corresponding compound, barbituric acid, the triketo tautomer is most stable.20 We offer the following speculations: (1) sometimes putative 6-oxo-T may have been misidentified as hmU; (2) as a nucleotide, putative 6-oxo-T may elute in HPLC under at least some conditions very close to thymine, making it difficult to detect; (3) the detection of putative 6-oxo-T requires high sensitivity; and (4) perhaps it is not very mutagenic, escaping detection in this way. In regard to the latter point, putative 6-oxo-T might be similar in some respects to 8-oxo-G, a species which can form a relatively normal base pair in its anti conformation.21,22 A calculation of charge density for the atoms engaged in anti base pairing of 6-oxo-T and T by CS Chem Pro3D software suggests small differences (5% change for O4, and 1.6% for H3), and the dihedral angle for H3-N1-C4-O6 changes by only 1.5%. While 8-oxo-G is mutagenic especially in its syn form that mispairs with A, the syn form of putative 6-oxo-T, because of its methyl, should not be able to base pair at all, preventing mutation by this mechanism. (However, putative 6-oxo-T might be mutagenic in a less specific way, as by disturbing local DNA structure via a steric clash in both its anti and syn forms with its sugar; via its nonplanar methyl with some accompanying loss of ring planarity, or via local effects on cation binding and hydration of DNA as reported for 8-oxo-G.23 It also might be mutagenic by translesion synthesis.) Similar arguments could be made for the 6-hydroxy tautomer of putative 6-oxo-T. Perhaps one of the unknown peaks observed when radiolabeled thymine in a poly(dA-[3H]dT) oligomer was oxidized with osmium tetroxide prior to digestion and analysis by HPLC is 6-oxo-thymidine,18 although we did not observe any putative 6-oxo-T when we subjected thymidine to this reaction (but formed thymine glycol as pointed out above), where radioactivity was absent.
The levels of fC, hmC and oT in the smoker placental DNA (Figure 3) were similar and all about 1 in 10e5 nucleotides. We have no information about the origins of these DNA modifications in the sample. While hmC and fC can be formed enzymatically,4,5 no doubt they can also arise by oxidative damage to DNA, both in the living cell and subsequently in an artifactual way as is known for other oxidative modifications of DNA.24 Whether putative 6-oxo-T can form enzymatically as an intended product or byproduct is unknown. Other biological samples that we have tested (e.g. sperm DNA from a nonsmoker, DNA from a mouse stem cell line) have similar levels of putative 6-oxo-T (lower by less than a factor of 3, preliminary data not shown).
The sensitivity of our assay depends on the amount of DNA and the extent to which a MALDI spot containing a modified nucleotide of interest also contains residual normal nucleotides, which cause ion suppression when excessive. (In principle, additional chromatography prior to MALDI spotting can overcome the latter problem.) For example, when an aliquot corresponding to BH-labeling of 25 fmol of 1,N6-etheno-dAMP is spiked into the MALDI spots for the peaks shown in Figure 3, the S/N is 200 in the spot for fC (this modified nucleotide elutes closest to the earlier, large peak of BH-dCMP, which tails at the trace level), 600 for hmC (elutes after fC), and 1000 for oT (elutes after hmC). Considering that 3 μg of DNA nucleotides were being tested, the sensitivity (calculated for S/N = 10) is 1.3 modified nucleotides in 10e7 nucleotides in the fC spot, 5 in 108 in the hmC spot, and 3 in 108 in the oT spot. When 100 fmol of AAF-dGMP is spiked into a digest of 100 μg of DNA, a S/N of 200 is observed with double tag labeling on the Voyager DE STR, corresponding to a sensitivity at that level of 6 in 10e9, which can be increased to 3 in 10e9 with single tag labeling.
Conclusion
It is useful to have a nontargeted method, even though it is tedious in its current form, for modified nucleotides in DNA which simultaneously provides deoxynucleotide-specific detection (observation of a sugar-containing daughter ion), high sensitivity (in part due to the negative ion mode, which reduces noise), semi-quantitation (the matrix solution can contain an internal standard), enhanced specificity for adduct discovery (based on isotopologue labeling in combination with accurate mass measurements), and, to the extent studied to date, normalization of response within a factor of 3 (which also contributes to the semi-quantitation). In regard to DNA adducts, the method can be used to help characterize genotoxicity in regard to complex environmental exposures (discover the genotoxic contaminants), drug development (e.g. complement the Ames Test with detailed molecular structural information to improve pre-clinical safety assessment), and chemotherapy (broad monitoring of adducts to help in guiding dosing). It can also be used in studies of epigenetic modifications of DNA. For putative 6-oxo-T, which we have discovered in DNA and found to be relatively abundant there by this method, much remains to be learned about this compound.
Acknowledgments
This work was supported by NIH Grant P42ES017198 from NIEHS, and NIH Grant AR043369 (via Massachusetts General Hospital, Harvard Medical School), NIH Grant AI44432, and NIH Grant HD065812. The authors thank Jean Cadet for reviewing this manuscript. Contribution number 1010 from the Barnett Institute.
References
- 1.Pang B, Zhou X, Yu H, Dong M, Taghizadeh K, Wishnok JS, Tannenbaum SR, Dedon PC. Carcinogenesis. 2007;28:1807–1813. doi: 10.1093/carcin/bgm037. [DOI] [PubMed] [Google Scholar]
- 2.Lemiere F. Mass Spectrometric Determination of DNA Adducts in Human Carcinogenesis. In: Banoub JH, Limbach PA, editors. Mass Spectrometry of Nucleosides and Nucleic Acids. CRC Press; New York: 2010. pp. 195–255. [Google Scholar]
- 3.Farmer PB, Singh R. Mutation Res. 2008;659:68–76. doi: 10.1016/j.mrrev.2008.03.006. [DOI] [PubMed] [Google Scholar]
- 4.Tahiliani M, Koh KP, Shen Y, Pastor WA, Bandukwala H, Brudno Y, Agarwal S, Lyer LM, Liu DR, Aravind L, Rao A. Science. 2009;324:930–935. doi: 10.1126/science.1170116. [DOI] [PMC free article] [PubMed] [Google Scholar]
- 5.Ito S, Shen L, Dai Q, Wu SC, Collins LB, Swenberg JA, He C, Zhang Y. Science. 2011;333:1300–1303. doi: 10.1126/science.1210597. [DOI] [PMC free article] [PubMed] [Google Scholar]
- 6.Phillips DH, Castegnaro M. Mutagenesis. 1999;14:301–315. doi: 10.1093/mutage/14.3.301. [DOI] [PubMed] [Google Scholar]
- 7.Shields PG, Harris CC, Petruzzelli S, Bowman ED, Weston A. Mutagenesis. 1993;8:121–126. doi: 10.1093/mutage/8.2.121. [DOI] [PubMed] [Google Scholar]
- 8.Goncalves LL, Beland FA, Marques MM. Chem Res Toxicol. 2001;14:165–174. doi: 10.1021/tx0002031. [DOI] [PubMed] [Google Scholar]
- 9.Masento MS, Hewer A, Grover PL, Phillips DH. Carcinogensis. 1989;10:1557–1559. doi: 10.1093/carcin/10.8.1557. [DOI] [PubMed] [Google Scholar]
- 10.Flarakos J, Xiong W, Glick J, Vouros J. Anal Chem. 2005;77:2373–2380. doi: 10.1021/ac0483724. [DOI] [PubMed] [Google Scholar]
- 11.Wang P, Giese RW. Anal Chem. 1993;65:3518–3520. [Google Scholar]
- 12.Wang P, Li G, Giese R. 8,003,395 B2 US Patent.
- 13.Bono R, Romanazzi V, Munnia A, Piro S, Allione A, Ricceri F, Guarrera S, Pignata C, Matullo G, Wang P, Giese RW, Peluso M. Chem Res Toxicol. 2010;23:1342–1348. doi: 10.1021/tx100083x. [DOI] [PMC free article] [PubMed] [Google Scholar]
- 14.Wang Y. Chem Res Toxicol. 2002;15:671–676. doi: 10.1021/tx0155855. [DOI] [PubMed] [Google Scholar]
- 15.Lustig MJ, Cadet J, Boorstein RJ, Teebor W. Nucleic Acid Res. 1992;20:4839–4848. doi: 10.1093/nar/20.18.4839. [DOI] [PMC free article] [PubMed] [Google Scholar]
- 16.Ravanat JL, Douki T, Duez P, Gremaud E, Herbert K, Hofer T, Lasserre L, Saint-Pierre C, Favier A, Cadet J. Carcinogenesis. 2002;23:1911–1918. doi: 10.1093/carcin/23.11.1911. [DOI] [PubMed] [Google Scholar]
- 17.Barszcz D, Tramer Z, Shugar D. Acta Biochimica Polonica. 1963;X:9–24. [PubMed] [Google Scholar]
- 18.Higgins SA, Frenkel K, Cummings A, Teebor GW. Biochemistry. 1987;26:1683–1688. doi: 10.1021/bi00380a029. [DOI] [PubMed] [Google Scholar]
- 19.Hollstein MC, Brooks P, Linn S, Ames BN. Proc Natl Acad Sci. 1984;81:4003–4007. doi: 10.1073/pnas.81.13.4003. [DOI] [PMC free article] [PubMed] [Google Scholar]
- 20.Ralhan S, Ray NK. J Mol Structure: THEOCHEM. 2003;634:83–88. [Google Scholar]
- 21.Plum GE, Grollman AP, Johnson F, Breslauer kJ. Biochemistry. 1995;34:16148–16160. doi: 10.1021/bi00049a030. [DOI] [PubMed] [Google Scholar]
- 22.Singh SK, Szulik MW, Ganguly M, Khutsishvili I, Stone MP, Marky lA, Gold B. J Nucleic Acids Res. 2011:1–13. doi: 10.1093/nar/gkr275. [DOI] [PMC free article] [PubMed] [Google Scholar]
- 23.Lipscomb LA, Peek ME, Morningstar ML, Verghis SM, Miller EM, Rich A, Essigmann JM, Williams LD. Proc Natl Acad Sci. 1995;92:719–723. doi: 10.1073/pnas.92.3.719. [DOI] [PMC free article] [PubMed] [Google Scholar]
- 24.Wagner JR, van Lier JE, Berger M, Cadet J. J Am Chem Soc. 1994;116:2235–2242. [Google Scholar]


