Abstract
Automating the detection of epileptic seizures could reduce the significant human resources necessary for the care of patients suffering from intractable epilepsy and offer improved solutions for closed-loop therapeutic devices such as implantable electrical stimulation systems. While numerous detection algorithms have been published, an effective detector in the clinical setting remains elusive. There are significant challenges facing seizure detection algorithms. The epilepsy EEG morphology can vary widely among the patient population. EEG recordings from the same patient can change over time. EEG recordings can be contaminated with artifacts that often resemble epileptic seizure activity. In order for an epileptic seizure detector to be successful, it must be able to adapt to these different challenges. In this study, a novel detector is proposed based on a support vector machine assembly classifier (SVMA). The SVMA consists of a group of SVMs each trained with a different set of weights between the seizure and non-seizure data and the user can selectively control the output of the SVMA classifier. The algorithm can improve the detection performance compared to traditional methods by providing an effective tuning strategy for specific patients. The proposed algorithm also demonstrates a clear advantage over threshold tuning. When compared with the detection performances reported by other studies using the publicly available epilepsy dataset hosted by the University of BONN, the proposed SVMA detector achieved the best total accuracy of 98.72%. These results demonstrate the efficacy of the proposed SVMA detector and its potential in the clinical setting.
Keywords: SVM, detection, epilepsy, seizure, support, vector
1. Introduction
Since the first human electroencephalogram (EEG) recording reported by Hans Berger in 1929, the EEG has become a ubiquitous tool in the management and treatment of patients suffering from epilepsy [1]. Regardless of its modality, whether it is surface, scalp or intracranial recordings, the EEG offers the clinician the ability to monitor and localize abnormal electrical activity in the human brain. While essential as a diagnostic tool, the clinical utilization of EEGs presents several challenges. (1) Long-term continuous EEG recordings implemented in the clinical setting generate a very large amount of data that can only be analyzed by trained clinical neurophysiologists. The result is an extremely taxing and often impossible task. (2) When reading an EEG recording, equally qualified physicians often disagree on their analysis of the epileptic seizure activities and there is no consistent standard that can be used as the base reference [2–3]. In these cases, a reliable automated detection algorithm can greatly facilitate the care of epilepsy patients and offer a common diagnosis standard for physicians.
Efforts to study seizure detection began as early as the 1970s [4] and benefiting from the advances made in computing technology, the field has since established a significant number of published algorithms. Many of these detection algorithms are based on support vector machine classifiers (SVM) which often exhibit superior generalization capabilities compared to other classifiers such as neural networks [5–11]. The SVM binary classifier was proposed by Vapnik [12] and is based on the theory of structural risk minimization (SRM). The SRM principle tries to minimize the upper bound of the generalization error by finding the balance between empirical performance and the Vapnik Chervonenkis (VC) dimension, a measure of the generalization capability of the classifier. This is a departure from traditional neural networks where the decision boundaries are constructed by minimizing empirical risk alone. While the SRM theory does not guarantee superior generalization performance with SVM classifiers, there are numerous empirical evidence to support the high accuracy of SVMs [13].
While published detection algorithms for epilepsy are numerous and often exhibit good performance in the research setting, the implementation of seizure detection in the clinical setting has been less successful. This failure can be attributed to several factors that can degrade the performance of the detector. (1) Epileptic seizure morphology can have significant variations between individual patients. As a result, a seizure detection algorithm with good performance across the general patient population can perform poorly for specific patients that do not fit the design criteria. (2) The seizure morphology of a patient can vary with time due to changes in the state of the patient or the recording equipment. (3) The EEG recordings can be contaminated with physiological and non-physiological artifacts that may imitate epileptic seizure activity. With regard to type I challenges, several studies have demonstrated an improvement in seizure detection performance using patient-specific detection algorithms as compared to patient non-specific algorithms [14–17]. However, these strategies may have little effect on reducing type II and III errors and they require a detector to be trained separately for each patient, which is tedious in the clinical setting.
An alternative strategy is to design tuning capabilities into the detection algorithm so that the operator can adapt the detector to fit a given need. In [17–18] the ability to tune the detector is realized by allowing the user to adjust the classification threshold. This is a simple strategy but its effectiveness has not been demonstrated. In this study, an alternative strategy is employed to enable tuning of the SVMA seizure detection algorithm. Instead of tuning by uniformly shifting the decision boundary, thresholding, a novel methodology is used to change the decision boundary based on the available training data. This new detection algorithm consists of the following characteristics:
A novel feature set composed of the median Teager energy of the signal, the power of the signal, and the Lempel-Ziv entropy of the signal in five physiological frequency sub-bands extracted using a band-pass Gabor filter bank.
A SVM assembly classifier. Each member of the assembly is trained with a different weighting ratio between seizure data and non-seizure data. By choosing different SVMs in the assembly, the user can tune the performance of the detector for a given situation that still takes the training data into consideration and is easy to implement.
The objective of this paper is to implement a novel SVMA seizure detection algorithm to improve the performance of detection algorithms by providing the end user with the ability to easily tune the detection algorithm for specific patients. In the following sections, the algorithm of the proposed detector is first presented. Feature vectors are then extracted from the datasets and their abilities to capture seizure morphologies are examined. The detector is then trained and tested on an epileptic seizure dataset that is publicly available online. The results are used to compare the tuning performance of the proposed detector against threshold tuning, as well as other published detection algorithms on the same dataset.
2. Methods
2.1 EEG data and pre-processing
In order to substantiate the efficacy of the proposed SVMA detector, its performance should be compared directly to other published algorithms. However a fair evaluation of different detection algorithms is difficult, if not impossible. Published detection studies employ a wide range of datasets which can have a significant impact on the detection performances achieved. For instance, a dataset chosen with strong epileptic seizure morphology and minimal artifacts will offer significant advantages to the quantification of an algorithm’s performance measure versus a dataset with less selection. In this case, the publicly available dataset, provided by the University of Bonn, is the best method for comparison and a number of detection algorithms have been published using this dataset.
The dataset contains 5 subsets (A–E) each with 100 single-channel EEG segments, 23 seconds/segment in duration. These segments were selected and cut out from the continuous multichannel EEG recordings following visual inspection for artifacts, e.g., due to muscle activity or eye movements. Subsets A and B are surface EEG recordings from five healthy volunteers with eyes open and closed respectively. Subsets C, D and E are intracranial recordings from the hippocampal formation of five epileptic patients all of whom experienced complete seizure remission following hippocampal resection. D and C are seizure-free intracranial recordings from the epileptogenic zone and the hippocampal formation of the opposite cerebral hemisphere respectively. Subset E is recorded during the occurrence of epileptic seizures from ictal sites. The depth electrodes are implanted symmetrically into the hippocampal formations and strip electrodes are implanted onto the lateral and basal regions of the neocortex. The EEG signals are recorded with a 128-channel amplifier system, at 173.61Hz sampling frequency with 12 bit digitization and an average common reference. In this study, only sets A, D and E are used. This dataset selection is made to match previously published studies listed in table 1. The use of the same datasets is necessary for a more accurate performance comparison between those algorithms and the proposed SVMA detector. While it is not ideal to mix scalp EEG data (set A) with intracranial EEG data (set D and E), the feature vectors used as inputs to the SVMA detector exhibits little difference between set A and C.
Table 1.
Comparison of the SVMA detection algorithm with other published algorithms. The table lists the individual datasets used by each study, the partition of the datasets between training/testing and the relevant performance measures.
| Datasets (A,B,C,D,E) |
Train/Test (%) |
Sensitivity (%) |
Specificity (%) |
Total Accuracy (%) |
|
|---|---|---|---|---|---|
| Kannathal et el (2005) | A,E | 57%/43% | 91.49 | 93.02 | 92.22 |
| Guler et el (2005) | A,D,E | 50%/50% | 96.13 | 98.62 | 97.79 |
| Subasi et el (2007) | A,E | 62.5%/37.5% | 95 | 94 | 94.5 |
| Mousavi et el (2008) | A,C,E | NA | 91–96 | 91–96 | 91–96 |
| Chandaka et el (2009) | A,E | 50%/50% | 92.00 | 100.00 | 95.96 |
| Ubeyli et el (2009) | A,D,E | 50%/50% | 95.50 | 98.25 | 97.33 |
| SVMA | A,D,E | 50%/50% | 99.23 | 98.47 | 98.72 |
2.2 Feature Extraction
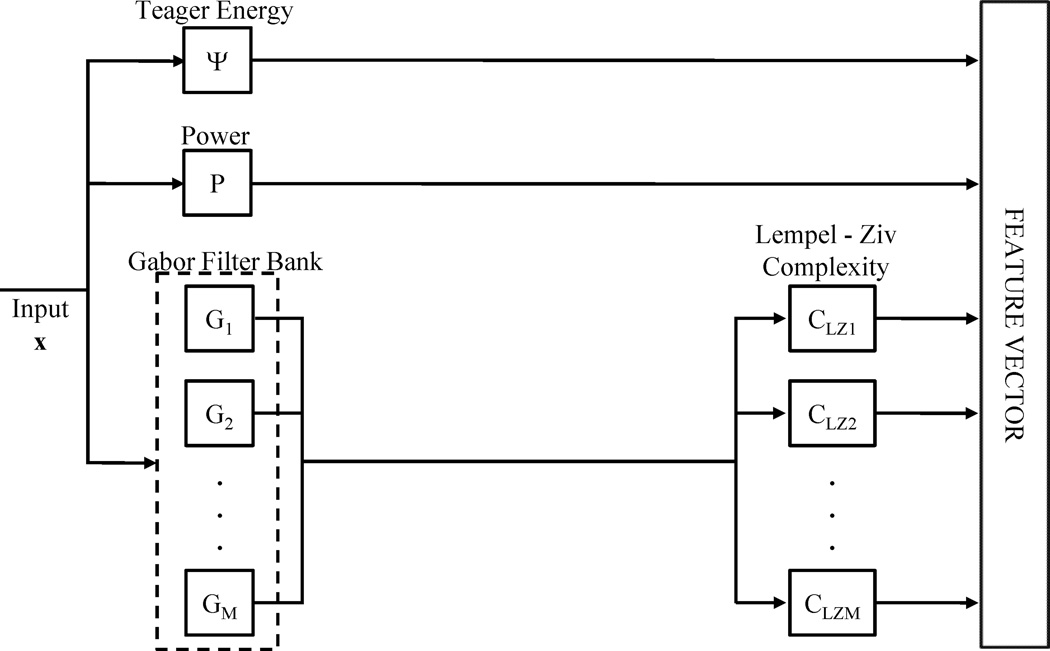
The single channel EEG data segments are divided into 256 points sliding time epochs with 128 point overlap between adjacent epochs. This is equivalent to approximately 1.47 seconds/epoch and 0.735 seconds of overlap between adjacent epochs. Overall, 3100 epochs are constructed from each dataset for a total of 9300 epochs over the three datasets. The median Teager energy of the signal, the power of the signal and the Lempel-Ziv Complexity of the physiological sub-bands are calculated for every epoch and combined to form the feature vector that is the input to the SVMA classifier. The physiological sub-bands are separated through a five-channel Gabor band-pass filter bank. An illustration of the feature vector construction process is shown in figure 1.
Figure 1.
Feature extraction flow chart. Starting with the input signal x, the median Teager energy ( and power (P) are calculated for each epoch while the Lempel-Ziv complexities (CLZ) are calculated for each filtered sub-band (G). The features are then normalized and combined together to form the feature vectors that are the inputs to the SVMA detector.
2.2.1 Median Teager Energy
The Teager energy was first introduced by Herbert M. Teager in 1990 in [19] and subsequently derived by J. F. Kaiser [20]. The discrete version of the Teager Energy Operator (TEO) is defined by the equation:
| (1) |
where Ψ is the TEO and x is the signal. Kaiser’s derivation of this equation is based on the energy of a simple mechanical oscillator where the total energy of the oscillator is proportional to the frequency and amplitude squared. Given:
| (2) |
| (3) |
For small values of Ω, equation (3) can be approximated as
| (4) |
Equation (4) hints at the utility of the Teager energy as a feature for seizure detection. Unlike traditional energy calculations, the Teager energy is square proportional to both the signal amplitude and the signal frequency. Given that epileptic activities often exhibit higher frequencies in their EEG recordings, the Teager energy may be advantageous in distinguishing seizure events. The calculation of the Teager energy is also trivial. In this work, the median Teager energy for each data segment is extracted as a feature.
2.2.2 Power
The power is included as a feature with the Teager energy because the juxtaposition of the two features can offer information for the frequency content of the EEG data. The power P is calculated as
| (5) |
where n = 256, the length of each epoch.
2.2.3 Gabor Band-pass Filter Bank
For the extraction of the physiological sub-bands, the single channel signals are filtered through a bank of band-pass filters. The band-pass filters are constructed using the Gabor filter. The Gabor filter g(t) is described in both the time domain and the frequency domain by
| (6) |
where
| (7) |
and
| (8) |
αc is the center frequency of the band, σ is the width of the filter in Hertz. The discrete version of the filter is implemented by sampling the continuous version. Given the sampling frequency Fs = 173.61 Hz and T = 1/Fs, the Gabor filter in discrete form is
| (9) |
| (10) |
Ωc is the discrete frequency. The filters’ center frequency and bandwidth are designed with wavelet characteristics where the frequency resolution of the filters increases with a decrease in filter center frequency logarithmically.
| (11) |
| (12) |
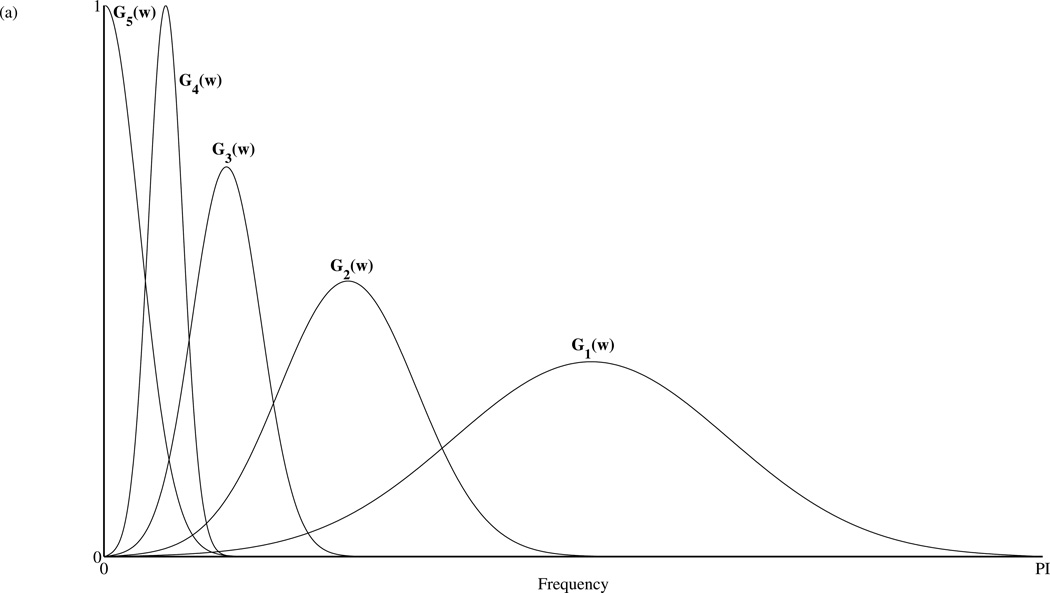
αm are the center frequencies and σm are the corresponding bandwidths. The adjacent filters intersect at half-peak which results in band-pass filters with constant energy across scales. For this study a five band bandpass Gabor filter bank is constructed with center frequencies of (45, 22.5, 11.25, 5.625 and 0 Hz). These band-pass filters are constructed to overlap the physiological frequencies of Gamma (> 30 Hz), Beta (14–30 Hz), Alpha (8–14 Hz), Theta (4–8 Hz) and Delta (< 4 Hz). These frequencies garner the most clinical interests.
2.2.4 Lempel-Ziv Complexity (CLZ)
Lempel-Ziv complexity measures the number of new patterns in a binary sequence. It is closely associated with entropy and is computationally fast. Recently, Lempel-Ziv complexity has been used in biomedical applications to estimate complexity measures in biological signals [21–22]. Although there are several ways to calculating the CLZ of a given signal, the following method was used:
The numerical sequence, which is the input signal, is transformed into a binary sequence B by setting values above the median of the signal to 1 and the remaining values to 0, B = b1b2b3 …‥ bn.
The binary sequence B is then rewritten as a consecutive series of words B = w1w2 ‥ wj, where w1 = b1 and wj is a word that has not appeared in the previous n-1 words.
-
Let J = the number of words extracted from a given sequence B of length N. Then CLZ is defined by
(13) For large values of N, equation 13 can be rewritten as(14)
For example, the sequence B = 10011011110011 is parsed into 1•0•01•10•11•110•011. Since there are a total of 7 words so J = 7, N = 14 and CLZ = 1.9037. For this study, CLZ is calculated for each physiological sub-band and because the epoch lengths are kept constant at N=256, CLZ can be approximated by J alone.
2.3 Support Vector Machine Assembly (SVMA)
The SVMA is composed of a group of separately trained SVM classifiers. Figure 2(a) illustrates the architecture of a single SVM. Given the data sets, (x1, y1), …, (xm, ym) XL × {±1}, where x are patterns of the data and y are the class labels of each data set x. The SVM tries to construct the optimal hyperplane that yields the maximum margin of separation between the members of the two classes by solving the following quadratic programming optimization problem.
| (15) |
Figure 2.
(a) Support Vector Machine architecture. The feature vector x is input to the N kernel functions K corresponding to the N support vectors. (b) The Support Vector Machine Assembly architecture. The feature vector f is input to each member of the SVMA. The SVMA consists of an assembly of SVMs each trained on the same dataset but with a different weighting ratio between seizure and non-seizure data, (Non-Seizure:Seizure). Once trained the output of the SVMA can be tuned by the human operator via gating of its members individual outputs.
For non-linearly separable data, a soft margin can be constructed by the introduction of the slack variable ξi ≥ 0, i = 1, …,m. The new optimization problem becomes
| (16) |
where C is a user defined constant greater than 0. This problem can be solved with its Lagrangian dual and can be simplified to
| (17) |
so the decision function becomes . From this deduction, it is clear that w only depends on the patterns xi where ai is not zero; these are the support vectors. These support vectors lay on the margin of the decision boundary and all other data points are irrelevant. Since the feature vector x only appear in the equations as dot products the decision functions can be converted to the form
| (18) |
where K(x · xi) is a kernel function that maps the input space into a higher dimensional feature space. In this higher dimension, the hyperplane decision boundary is then constructed that results in nonlinear decision curves in the input space. In the proposed SVMA detector, all implementations of the SVMs are done with the Radial Basis Function kernel (RBF)
| (19) |
where γ is the radius of the RBF function set by the user using the LIBSVM tool kit. [23]
The architecture of the SVMA detector is shown in figure 2(b). The detector consists of an assembly of individual SVMs. Each SVM in the collection is trained with the same data but different weighting ratios between the seizure data and non-seizure data ranging from non-seizure : seizure of 512 : 1 to 1 : 512 in powers of 2. With this strategy, SVMs trained with higher weights for seizure data are correspondingly more sensitive to seizure activity while SVMs trained with higher weights for non-seizure data are less likely to give false detections. The end user can then tune the detector by choosing the output of a particular SVM classifier, in the assembly as the detector’s output.
2.4 Detection Performance Evaluation
The performance of the proposed seizure detection algorithm is evaluated with the following parameters:
where TP = true positives, FN = false negatives, TN = true negatives, FP = false positives.
d) Mean detection latency: The BONN dataset used in this study does not have continuous data segments consisting of a pre-seizure period, seizure onset and post-seizure period, so it is not possible to determine the traditional detection latency which basically defines the period between the actual seizure onset and the first detection of seizure. However, because the proposed SVMA algorithm can affect the true detection latency via tuning, an alternative definition is used for the detection latency. In this study, we measure the detection latency as the time difference between the beginning of a seizure segment and the first epoch within that seizure segment that is classified as seizure. While this quantification of detection latency is not ideal, it does offer insight into how the SVMA algorithm can affect the true detection latency.
2.5 Training & Testing Strategy
One hundred training and testing dataset pairs are randomly created using the EEG dataset obtained from Department of Epileptology, University of Bonn. Each training set is randomly constructed from the concatenation of 20% of the available seizure data segments (20 out of 100 segments from set E) and 20% of the non-seizure data segments (20 out of 100 segments from set A and 20 out of 100 segments from set D). The remaining 80% of data segments are combined together to form the testing set (80 segments separately from dataset A, D and E). This results in 60 data segments or 1860 epochs per training set and 240 data segments or 7440 epochs per test set. Each train/test dataset pair is dubbed a “virtual patient” or VP and each seizure segment is counted as a single seizure. The proposed SVMA detection algorithm is then trained on the training dataset for each VP and evaluated on the corresponding test dataset.
3. RESULTS
3.1 Feature Extraction
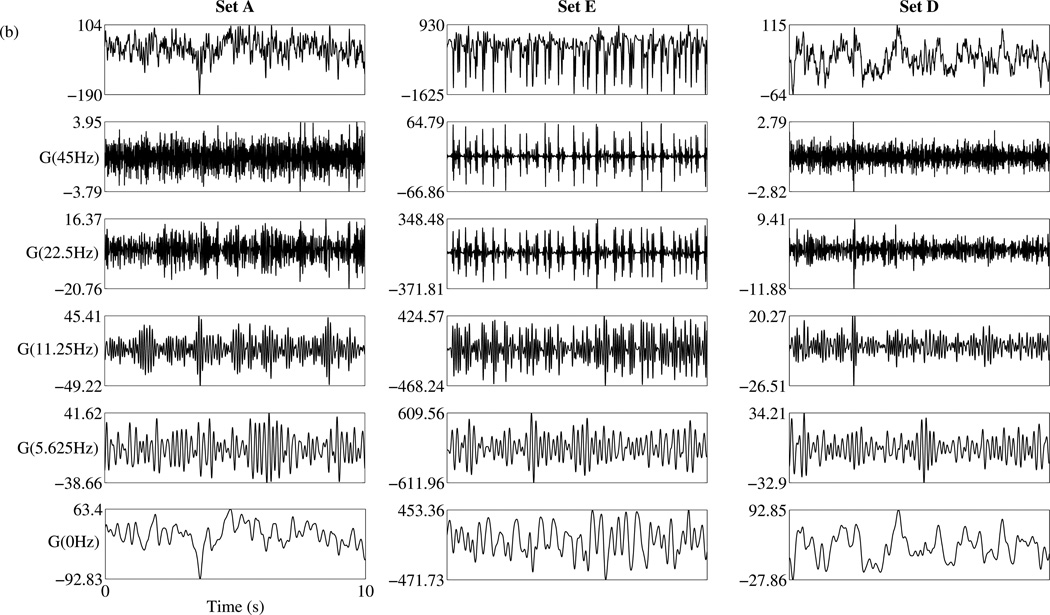
The features chosen for the SVMA input are first evaluated for their ability to capture seizure activity relative to baseline activity. Seven features are extracted from each epoch of data 256 points in length. They include the median Teager energy, power and the Lempel-Ziv complexity of five physiological sub-bands isolated through a Gabor band-pass filter bank. Figure 3(a) shows the frequency response of the five-band Gabor filter bank. The frequencies are normalized to the sampling frequency. Examples of the output of the Gabor filter bank are displayed in figure 3(b). In the figure, data segments of 23 seconds in duration, obtained separately from datasets A, D and E are displayed along with their corresponding filtered waveforms. Following the filter stage, the CLZ coefficients are calculated for each filtered sub-band. These CLZ values are then combined with an epoch’s median Teager energy and power to form the input feature vector for the SVMA classifier.
Figure 3.
(a) Frequency response of the Gabor filter bank. The frequencies are normalized with respect to the sampling frequency. There are a total of five sub-bands each overlapping a different physiological frequency range: 1-Gamma; 2-Beta; 3-Alpha; 4-Theta; 5-Delta. (b) Examples of the Gabor filter bank outputs. Three data segments spanning 23s each are obtained separately from the datasets A, D and E and plotted in row 1. Their corresponding filtered waveforms by the Gabor filter bank are plotted from the highest to the lowest frequency bands, in subsequent rows.
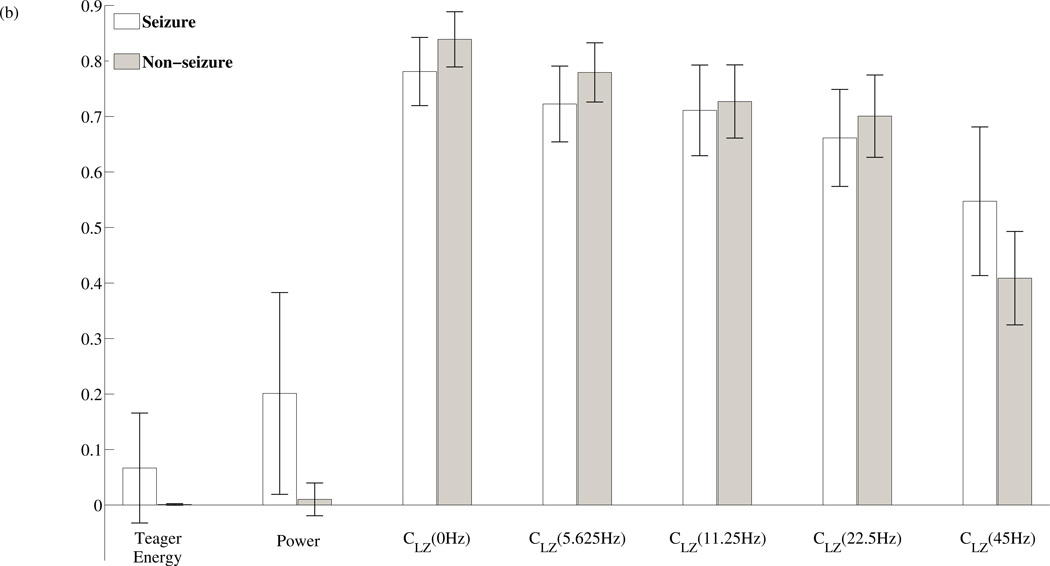
To determine the sensitivity of the chosen features to the presence or absence of a seizure event, the normalized values for each feature during epileptic seizure epochs versus non-seizure epochs were computed and plotted in figure 4. In figure 4(a), the features calculated for the 9300 data epochs extracted from set A, D and E are concatenated together with the set E features in the middle. In figure 4(b), the mean and standard deviation of the features during seizure and non-seizure epochs are plotted. The majority of seizure epochs contain higher power relative to non-seizure epochs, but there are non-seizure epochs that also contain high power and could lead to false seizure detections. In comparison, high median Teager energies are all confined within seizure epochs, an advantage when compared to power. However, during seizure epochs, the Teager energies display larger variations when compared to powers of the same period. The Lempel-Ziv complexities, from the extracted physiological sub-bands, also demonstrate average amplitude differences between seizure epochs and non-seizure epochs. In the highest frequency band centered at 45Hz, there is a uniform increase in CLZ values during seizure epochs, while the remaining lower frequency bands all exhibit a reduction in the computed CLZ values. Using one-sided two sample t-tests with unequal variances, the features all show significant differences in means between non-seizure and seizure epochs, P < 0.001.
Figure 4.
(a) Extracted features during seizure segments and non-seizure segments. The plots are constructed by concatenating features extracted from set E (highlighted in gray) in between features extracted from set A and D. (b) A comparison of the mean and standard deviation of each feature for both seizure and non-seizure data. The computed Power and median Teager Energy are both much higher during seizure epochs compared to non-seizure epochs. The Lempel-Ziv complexities of the lower frequency sub-bands are lower during seizure activity relative to baseline. However in the Gamma band, the Lempel-Ziv complexity is actually higher during seizure activity versus baseline. P < 0.001 for all features.
3.2 Detection Performance
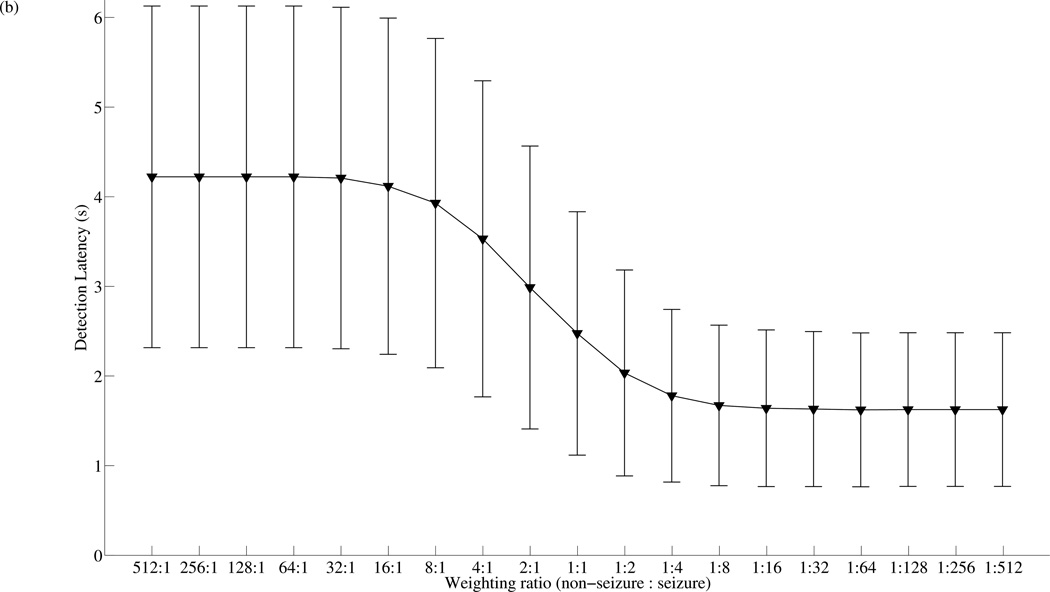
The proposed SVMA seizure detection algorithm utilizes an assembly of SVM classifiers each trained with a different weighting ratio between seizure and non-seizure data. By selecting the output of a particular SVM within the assembly as the output of the SVMA classifier, the operator can tune the performance characteristics of the detector and achieve higher classification performances. To evaluate the tuning capability of the SVMA, each member of the assembly is trained and tested over 100 VPs and the resultant mean and standard deviation of the classification sensitivity, specificity and total accuracy are plotted in Figure 5(a). From left to right on the x-axis, member SVMs are trained with weighting ratios heavily favoring non-seizure data (512:1) to ratios that heavily favor seizure data (1:512). The weighting ratios increase in powers of 2, which results in a total of 19 SVMA members. In most detection studies, the classifier weighs seizure and non-seizure data equally during training corresponding to a weighting ratio of (1:1). Therefore, the performance of each SVMA member can be compared directly to SVM1:1, as comparisons with the traditional SVM classifier. Starting from one extreme where the SVMA members are weighted heavily towards non-seizure data, SVM512:1 achieved a detection specificity of 98.77±1.24%. This is an improved performance compared to the specificity of SVM1:1, which is 97.33±1.74%. However, this improvement comes at the expense of sensitivity which is reduced from 85.77±6.00% with SVM1:1 to 75.54±6.97% with SVM512:1. Accordingly, by increasing the weighting ratio to favor seizure data, moving along the x-axis, the SVM classifiers are able to achieve higher sensitivities at the expense of specificities. For example, SVM1:512, has an increased sensitivity of 95.47±2.39% relative to 85.77±6.00% with SVM1:1 and a decrease in specificity from 97.33±1.74% with SVM1:1 to 86.79±5.31%. The best mean total accuracy over the 100 VPs is 94.11±0.91%, achieved with SVM1:2 instead of SVM1:1, which achieved a mean total accuracy of 93.48±1.17%. The mean total accuracies then decrease as the detector is tuned away from SVM1:2 along either direction of the x-axis. At the extremities, the mean total accuracies are 91.03±1.50% for SVM512:1 and 89.67±3.31% for SVM1:512. These results first demonstrate the tuning capability of the SVMA algorithm. By simply choosing a specific SVMA member, the user can tune the proposed detector to operate with greater sensitivity or specificity. These results also suggest that higher classification performances can be achieved over the traditional SVM1:1 classifier, by simply weighting the non-seizure and seizure data differently, such as (1:2).
Figure 5.
SVMA tuning characteristics. (a) The mean and standard deviation of the sensitivity, specificity and total accuracy across 100 VPs as the SVMA is tuned from SVM512:1 to SVM1:512, where the weighting ratio is (non-seizure: seizure). The proposed SVMA detector can be easily tuned to provide a wide range of sensitivity and specificity performance levels, while the best mean total accuracy is achieved with SVM1:2. (B) The mean and standard deviation of the detection latency as the SVMA is tuned from SVM512:1 to SVM1:512.
Another important performance parameter in seizure detection is detection latency, particularly for closed-loop DBS control of seizures. Figure 5(b) plots the mean seizure detection latency for each SVMA member evaluated over the 100 VPs. The mean detection latency reach a minimum of 1.62±0.86s, when the SVMA is tuned to (1:64). This is a noticeable improvement over a mean detection latency of 2.48±1.36s achieved with the traditional SVM1:1 detector. Further tuning towards weighting ratios favoring seizure data does not result in additional benefits in detection latency. Since each epoch spans a period of 1.47s with a 0.735s overlap between adjacent epochs, the SVMA tuned to SVM1:64 is able to detect almost every seizure segment upon the first epoch of epileptic seizure activity. This may offer a significant advantage in situations where fast responses are necessary for effective treatment of epileptic seizures. However, when the SVMA is tuned for higher specificity, the detection latency increases and approach a maximum of 4.23±1.91s at a weighting ratio of (64:1). Further weighting towards non-seizure data does not alter the detection latencies significantly.
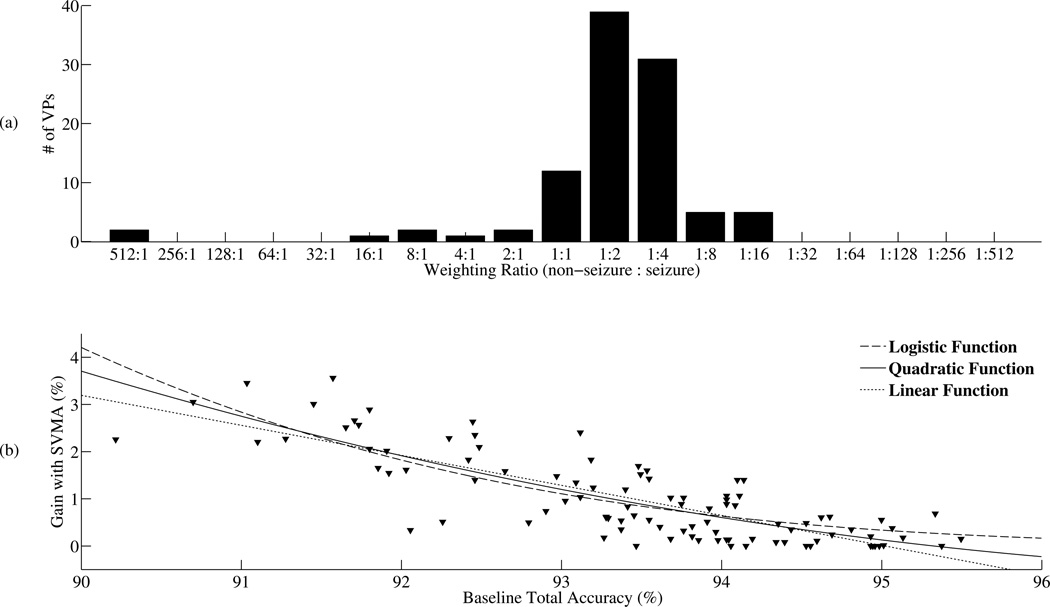
The above studies demonstrate the tuning capability of the SVMA detector to alter its sensitivity, specificity, total accuracy and detection latency performance characteristics. In order to study the effect of patient-specific tuning with the SVMA detector, the detector was tuned to achieve the best classification performance for each individual VP and the resulting classification performance parameters analyzed over the 100 VPs. In figure 6(a), the number of VPs receiving the best detection accuracy for a given SVMA member is plotted. Out of 100 VPs, the baseline SVM1:1 classifier obtained the best total accuracy for only 12 VPs. The remaining 88 VPs all benefited from tuning the detector ranging from SVM512:1 to SVM1:16. Amongst the SVMA members, SVM1:2 achieved the best detection performance for the largest number of VPs at 39. However, even these are only a fraction of the 100 VPs in the study. These results demonstrate that the traditional SVM detector is only optimal for a small portion of patients. Even when using SVM1:2, which offers the best classification performance on average across the 100 VP, the majority of VPs can still benefit from patient-specific tuning with the SVMA detector.
Figure 6.
Patient specific tuning with the SVMA detector. (a) The number of VPs with the best total accuracy for a given SVM in the SVMA is plotted. The baseline SVM1:1 is the best detector for only 12 out of 100 VPs. The remaining 88 VPs all benefited from tuning with the SVMA. SVM1:2 is the best detector for the largest number of VPs (N= 39). (B) The improvements in total accuracy with the SVMA detector is plotted against the baseline total accuracy obtained with SVM1:1 for each VP. Three separate functions are fitted to the dataset (Logistic, Quadratic, Linear). These trends show an inverse relationship between the gain in detection performance with the SVMA algorithm and the baseline detection performance.
To quantify the advantage in detection performance with the SVMA detector over the baseline SVM1:1 detector, figure 6(b) plots the improvement in total accuracy obtained with the SVMA detector over the baseline SVM1:1 detector for all 100 VPs. The gains in detection performance with the SVMA over SVM1:1 are not uniform across the VP population. Rather, the increases in performance are inversely proportional to the baseline detection performances. To illustrate this trend, a logistic, quadratic and linear function were fitted to the dataset. Within the domain of 90 to 96% baseline total accuracy, all three models show higher gains in total accuracy with the SVMA detector when lower baseline total accuracies are achieved with the SVM1:1 detector. The average total accuracy across the 100 VPs increased from 93.48±1.17% with the SVM1:1 detector to 94.46±0.69% with the SVMA detector, P < 0.001 using one-sided two sample t-tests with unequal variances. The individual total accuracy gains ranged from 0% to 3.56% while the baseline total accuracies ranged from 90.22% to 95.50%. These results support the ability of the SVMA detector to facilitate patient-specific tuning and improve detection performance over traditional SVM classifiers. In the next section, the SVMA algorithm is compared with the most common tuning strategy, threshold tuning.
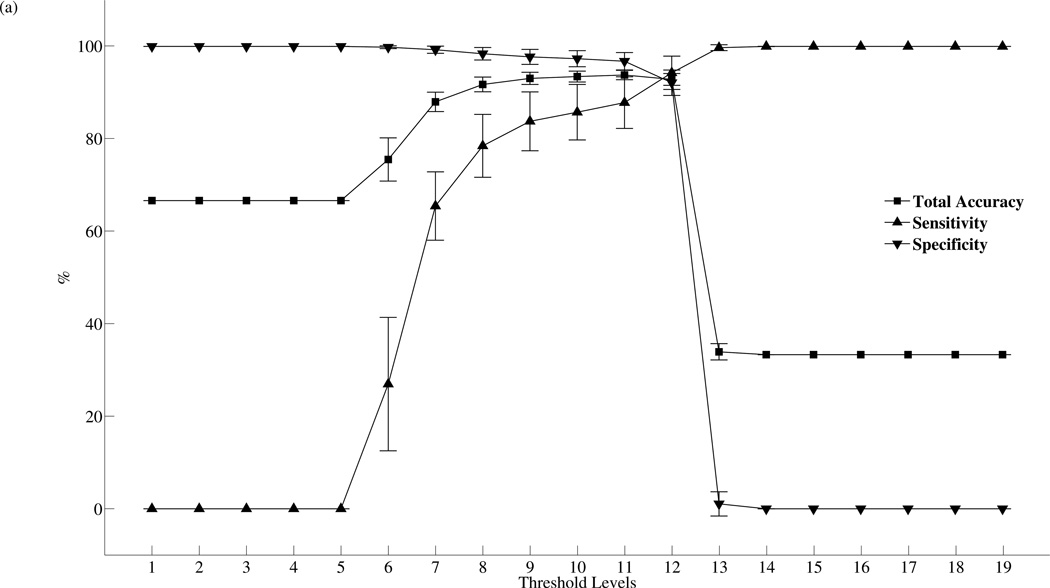
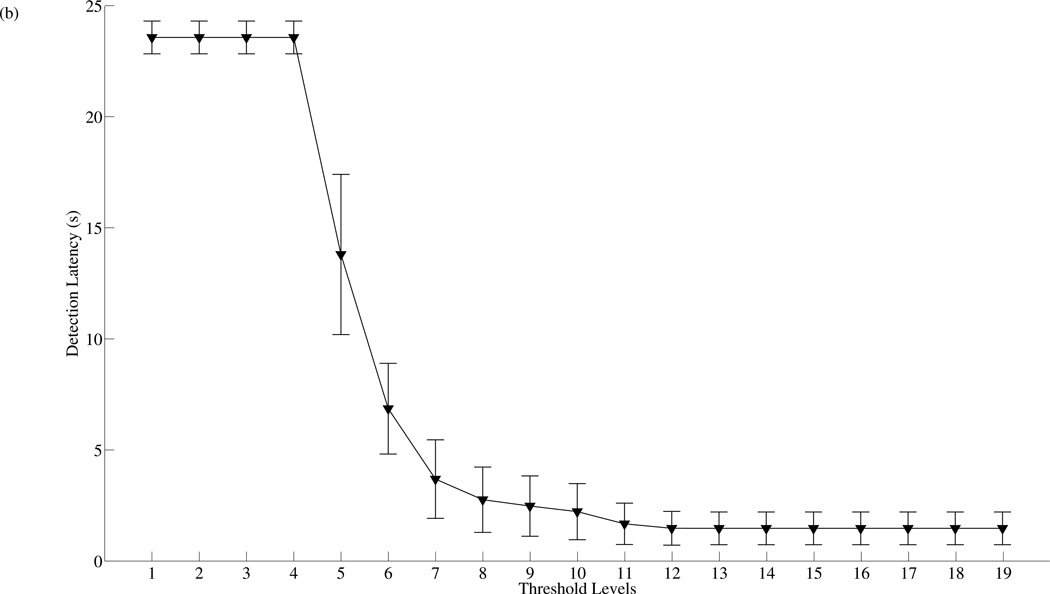
Threshold tuning is a common technique used for altering the performance of a given classifier. It is often implemented by changing some classification threshold to tune the classifier. For instance, in the case of the traditional SVM classifier, classification threshold can be changed by simply shifting the signum function in equation 18 along its domain. In order to compare the performances between the traditional SVM detector with threshold tuning and the SVMA algorithm, a baseline SVM detector with a total of nineteen separate classification thresholds is implemented. The classification thresholds are chosen in a logarithmic fashion and threshold level 10 is the baseline SVM detector, it is identical to SVM1:1. Lower threshold levels are designed for increased specificity while higher threshold levels achieve increased sensitivity. The two detection schemes are tested over the same 100 VPs data set and the effect of threshold tuning on the baseline SVM detection performance is shown in figure 7. Figure 7(a) plots the mean and standard deviation of the sensitivity, specificity and total accuracy evaluated over the 100 VPs as the SVM is tuned across the nineteen detection thresholds. The performance measurements of threshold tuning exhibit similar patterns to the SVMA algorithm shown in figure 4(a). The sensitivity and specificity measurements display logistic function-like behaviors and approach limits when the detectors are tuned to the extremities, while the total accuracy measurements achieve their maximum when the detectors are tuned to level 11. Figure 7(b) plots the effect of threshold tuning on detection latencies. Again the plot shape is similar to SVMA tuning, but with major differences in the range of the detection latencies. These results support threshold tuning as an effective strategy for changing the behavior of the classifier.
Figure 7.
Threshold tuning characteristics. (a) The mean and standard deviation of the sensitivity, specificity and total accuracy across 100 VPs as the detection threshold is tuned from level 1 to 19. Level 10 is the baseline SVM = SVM1:1. Lower levels are designed for increased specificity while higher levels for increased sensitivity. The best mean total accuracy is achieved with level 11. (b) The mean and standard deviation of the detection latency as the detection threshold is tuned from level 1 to 19.
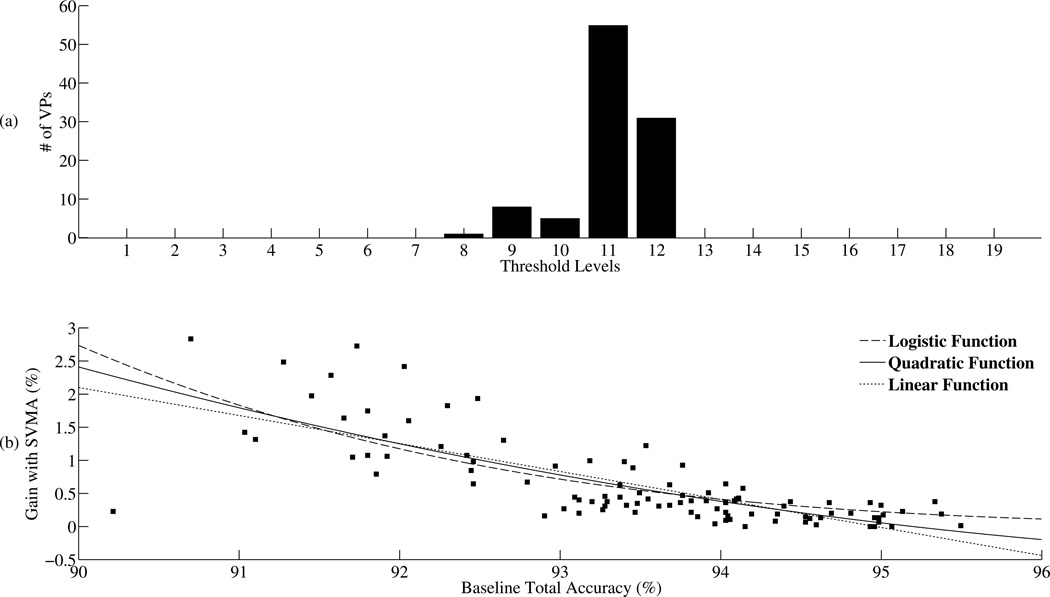
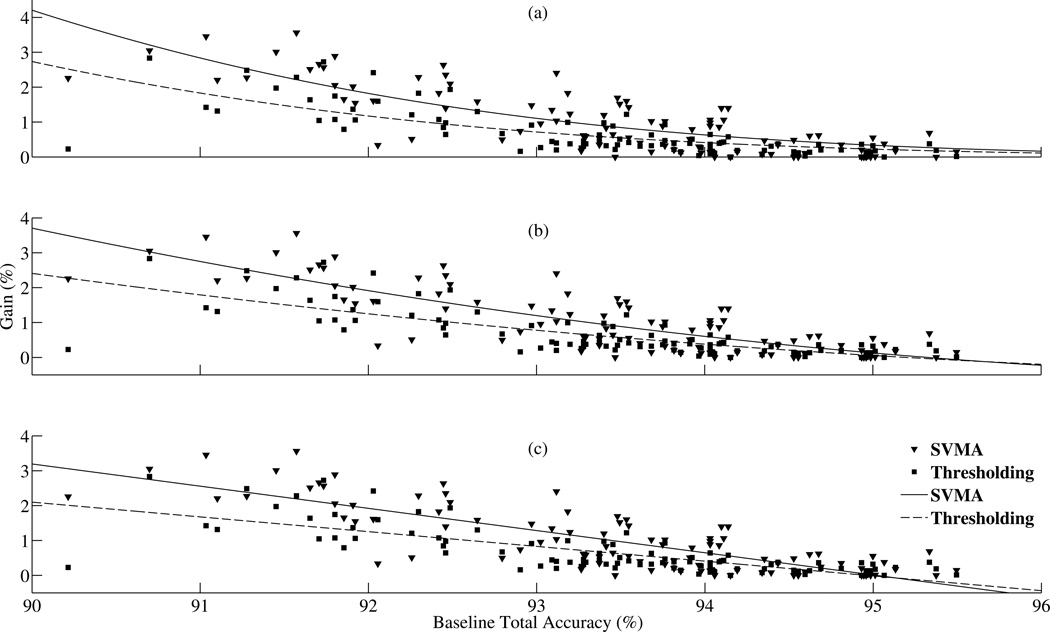
Figure 8, similarly to figure 6 for the SVMA algorithm, examines the performance effect of patient-specific tuning with threshold tuning. In figure 8(a), the number of patients receiving the best detection performance for a given classification threshold is plotted. The baseline detector, threshold level 10, was only optimum for 5 VPs out of the 100 VP population. In contrast, tuning the baseline SVM detector to threshold level 11 achieved the best performance for the most number of VPs at 55. The remaining 40 VPs are distributed between threshold levels 8 to 12. Out of the 100 VPs, 95 benefited from threshold tuning. In figure 8(b), these gains in total accuracies are plotted against the baseline total accuracies for each VP. Similarly to figure 6(b) for the SVMA detector, VPs with lower initial performances with the baseline SVM detector often benefited more from threshold tuning. This trend is illustrated by fitting the same three functions (logistic, quadratic and linear) to the plot. Comparison with the trends shown in figure 6(b) shows the SVMA detector achieves higher gains over threshold tuning across the VP population. Figure 9 shows a closer comparison of the performance gains achieved with the SVMA algorithm and threshold tuning. Figure 9(a), 9(b) and 9(c) separately compares the fitted logistic, quadratic and linear functions for the two strategies. For all three fitted functions, the SVMA algorithm obtained higher gains in total detection accuracy over threshold tuning, P < 0.001 using one-sided two sample t-tests with unequal variances. When patient-specific tuning is performed, the SVMA algorithm is able to improve the mean total accuracy for the 100 VPs to 94.46±0.69% from the baseline total accuracy of 93.48±1.17%, while threshold tuning improved the mean total accuracy to 94.11±0.80%. These results support the SVMA algorithm as a more effective tuning strategy compared to threshold tuning.
Figure 8.
Patient specific threshold tuning. (a) The number of patients with the best total accuracy for a given threshold level. Traditional SVM (level 10) is the best detector for only 5 out of 100 VPs. The remaining 95 VPs received better total accuracies when the detection threshold is tuned to other levels with level 11 achieving the best performance for the most number of VPs, N=55. (b) The gains in total accuracy with threshold tuning are plotted against the baseline total accuracy for each VP. Three separate functions (Logistic, Quadratic, Linear) are fitted to the dataset. A similar trend to SVMA is observed where higher gains are achieved with threshold tuning when the baseline detection performances are poor.
Figure 9.
Performance comparison between the SVMA algorithm and threshold tuning. (a) Comparison between the fitted logistic functions of the SVMA total accuracy gains versus the threshold tuning gains. (b) Comparison of the fitted quadratic functions of the SVMA total accuracy gains versus the threshold tuning gains. (c) Comparison of the fitted linear functions of the SVMA total accuracy gains versus the thresholds tuning gains. In all three plots, the SVMA detection performance gains are higher than the gains achieved with threshold tuning.
The improved total accuracies demonstrated with the SVMA algorithm over the traditional threshold tuning strategy could be attributed to the design of the SVMA. In threshold tuning, the classification threshold is shifted uniformly along the decision curve independent of the training data. In contrast, by constructing each decision curve with pre-defined weightings of the available data, tuning with the SVMA algorithm utilizes the information present in the training data and is less stochastic in nature compared to threshold tuning. Figure 10 illustrates this concept. In the figure, the SVMA algorithm and threshold tuning are both implemented on the same dataset. The dataset includes a training set, composed of 20% of the non-seizure data and 20% of the seizure data chosen randomly, and a testing set composed of the remaining 80 % seizure and non-seizure data. In order to allow 2-D visualization of the classification boundaries, the feature set is reduced to just the normalized median Teager energy and the power of individual epochs. Figure 10(a) plots the training data, the trained baseline SVM classification boundary and the best performing classification boundaries obtained with the SVMA algorithm as well as threshold tuning. Figure 10(b) plots the same classification boundaries but over the testing data. In both plots, the boundaries are located in the lower left corners indicated by the arrows. In this trial, the baseline SVM obtained a total accuracy of 87.97%. With threshold level 11, threshold tuning achieved its best total accuracy of 89.85%. Using the SVMA detector, a high total accuracy of 95.93% was achieved with SVM1:8. In figure 10(c) and 10(d), closer examinations of these classification boundaries are displayed by limiting the domain of the feature space to (0.05 × 0.05). The classification boundary constructed through threshold tuning is parallel to the baseline boundary but shifted to increase its seizure sensitivity. These shifts are independent of the available information in the training data and must remain orthogonal to the baseline classification boundary. In contrast, the SVMA classification boundary is constructed from a different weighting of the training data and is not limited to being parallel to the baseline classification boundary. As such, the SVMA detector is able to utilize the information in the training data and construct a new classification boundary that incorporates additional classification regions with seizure activity and offer a superior classification performance on the test set.
Figure 10.
Comparisons between the classification boundaries constructed with the baseline SVM detector, the SVMA algorithm and threshold tuning. For these plots, the 2-D feature vectors of the VPs are constructed with normalized median Teager energy and Power. (a) The feature vectors extracted from the training dataset along with the trained baseline classification boundary, the best performing SVMA classification boundary and the best threshold tuning classification boundary (the boundaries are indicated by the arrow). (b) The feature vectors extracted from the testing dataset along with the same classification boundaries in (a). (c) A closer look at (a) by limiting the domain to 0 to 0.05 for both the median Teager energy and Power. (d) A closer look at (b) by applying the same limits as in (c). With threshold tuning, the boundaries are constructed independent of the training data and are limited to surfaces parallel with the baseline classification boundary. The SVMA algorithm instead, is able to construct classification boundaries that are dependent on the training data and thus offer better detection performances.
4. DISCUSSION
The novel SVMA seizure detection algorithm presented in this study combines effective features to characterize epileptic seizure activity and a unique strategy for patient-specific tuning. When the SVMA detector was tested on the BONN epilepsy dataset, it demonstrated a higher mean classification performance of 94.46±0.69% over the traditional SVM classifier performance of 93.48±1.17% evaluated over 100 VPs, P < 0.001. The SVMA detector also achieved a higher mean classification performance when compared with the threshold tuning classification performance of 94.11±0.80% over the same VP dataset, P > 0.001. These results validate the potential classification performance of the proposed SVMA detector and its patient-specific tuning capability.
To compare the efficacy of the SVMA algorithm against these published algorithms, the SVMA detector is retrained using 50% of the available data and tested over the remaining data, resulting in 4650 epochs for training and 4650 epochs for testing. This training/testing protocol is closer to the protocols used by other published studies and results in a more accurate comparison. Table 1 lists the published algorithms, the datasets that were used, the training/testing protocols and the highest detection performances achieved. In chronological order, Kannathal et al published a seizure detector using an adaptive neuro-fuzzy inference system and entropy measures [24]. They used the datasets A and E with 57% of the data used for training and the remaining 43% for testing. While the total accuracy was not reported in their publication, it is calculated to be 92.22% from information given in the paper. Guler et al combined Lyapunov exponents with a recurrent neural network to implement their seizure detection algorithm [25]. The algorithm was tested on the datasets A, D and E with 50% of the data used for training and 50% for testing. In their study, the algorithm was designed to do multi-class classification for each dataset. In order to compare their results to the binary classification results reported in this work, the specificity and total accuracy of their detection algorithm are recalculated using the information given in their confusion matrix. Their detector achieved a binary classification total accuracy of 97.79%. Mousavi et al extracted autoregressive parameters from datasets A, C and E and combined them with a multilayer perceptron classifier for their detection algorithm [26]. While their training/testing protocol was not given, the algorithm is reported to have a total accuracy between 91 to 96%. Most recently, Chandaka et al presented a cross-correlation aided support vector machine detector that achieved a total accuracy of 95.96%, using datasets A and E and training/testing partition of 50%/50% [11]. Finally, Ubeyli implemented a detector using Lyapunov exponents, wavelet coefficients and the power spectral density with a multilayer perceptron neural network [27]. The algorithm is studied over the datasets A, D and E with a training/testing partition of 50%/50%. Similarly to [25], the algorithm is designed for multi-class classification and binary classification results are recalculated using the information in the confusion matrix presented in the paper. The total classification accuracy for binary classification is 97.33%. Finally, by implementing the proposed SVMA seizure detection algorithm with a training/testing partition of 50%/50%, a high total accuracy of 98.72% is achieved. This is the highest total accuracy within the published manuscripts compared and demonstrates the effectiveness of the SVMA seizure detector.
During this study, an interesting observation is made on the CLZ values for the different physiological sub-bands. The four lower frequency sub-bands all show a decrease in CLZ values during seizure epochs compared to non-seizure epochs, while in the Gamma sub-band, the CLZ values are larger during seizure epochs compared to non-seizure epochs. These increases in complexity in the gamma frequency band are expected and are most certainly due to the high frequency spiking waveforms that appear during seizure activities. However, the reasons for the decreases in complexity or increases in periodicity in the lower frequency sub-bands, are less clear. A plausible explanation may be non-synaptic interactions in the epileptic network. For instance, Feng et el induced non-synaptic epileptic activities in-vivo using the calcium chelator, EGTA [28]. In their work, they recorded periodic slow wave seizure activity measuring 0.69 ± 0.79 Hz. These periodic slow waves may be due to fluctuations in the extracellular potassium concentration and can themselves illicit fast epileptic spiking activities [29–30].
In conclusion, this research presents a novel SVMA seizure detection algorithm. The SVMA detector not only offers excellent classification performance but is designed to facilitate patient-specific tuning. The SVMA detector demonstrated superior detection performances when compared with traditional SVM classifiers and threshold tuning. It achieved a high detection performance when compared with other published detection strategies using the publicaly available BONN dataset. The major disadvantage of the proposed algorithm lies in its increased calculation complexity relative to single SVM classifiers. During the training phase, each member of the SVMA must be trained separately. While this process can be parallelized, the training of SVMs on large problem sets is inherently slow and training multiple SVMs can be taxing even for today’s computers. However, once trained, the SVMA detection algorithm can be applied with little effort. This study supports the proposed SVMA detector as an effective tool in monitoring epileptic EEG activities in the clinical setting and as a potential closed-loop control device for new treatment paradigms such as electrical stimulation strategies.
-
▪
Implemented a novel Support Vector Machine Assembly epileptic seizure detector.
-
▪
Demonstrated easy patient specific tuning with the detector.
-
▪
Demonstrated superior tuning performance vs. threshold tuning.
-
▪
Achieved the highest total accuracy within published results on the same dataset.
Acknowledgements
This work was supported by NIH Grant R01-NS-40894.
Footnotes
Publisher's Disclaimer: This is a PDF file of an unedited manuscript that has been accepted for publication. As a service to our customers we are providing this early version of the manuscript. The manuscript will undergo copyediting, typesetting, and review of the resulting proof before it is published in its final citable form. Please note that during the production process errors may be discovered which could affect the content, and all legal disclaimers that apply to the journal pertain.
REFERENCES
- 1.Vulliemoz S, et al. The combination of EEG Source Imaging and EEG-correlated functional MRI to map epileptic networks. Epilepsia. 2009 doi: 10.1111/j.1528-1167.2009.02342.x. [DOI] [PubMed] [Google Scholar]
- 2.Friedman D, Claassen J, Hirsch LJ. Continuous electroencephalogram monitoring in the intensive care unit. Anesth Analg. 2009;109(2):506–523. doi: 10.1213/ane.0b013e3181a9d8b5. [DOI] [PubMed] [Google Scholar]
- 3.Stefan H, Hopfengartner R. Epilepsy monitoring for therapy: challenges and perspectives. Clin Neurophysiol. 2009;120(4):653–658. doi: 10.1016/j.clinph.2009.02.160. [DOI] [PubMed] [Google Scholar]
- 4.Viglione SS, V.A.O, Risch F. A methodology for Detecting Ongoing Changes in the EEG Prior to Clinical Seizures. 21st Western Institute on Epilepsy. 1970 [Google Scholar]
- 5.Gonzalez-Vellon B, Sanei S, Chambers JA. Support vector machines for seizure detection. Signal Processing and Information Technology, 2003. ISSPIT 2003; Proceedings of the 3rd IEEE International Symposium on.2003. [Google Scholar]
- 6.Shoeb A, et al. Patient-specific seizure onset detection. Engineering in Medicine and Biology Society, 2004. IEMBS '04; 26th Annual International Conference of the IEEE; 2004. [DOI] [PubMed] [Google Scholar]
- 7.Acir N, Guzelis C. Automatic spike detection in EEG by a two-stage procedure based on support vector machines. Comput Biol Med. 2004;34(7):561–575. doi: 10.1016/j.compbiomed.2003.08.003. [DOI] [PubMed] [Google Scholar]
- 8.Acir N, et al. Automatic detection of epileptiform events in EEG by a three-stage procedure based on artificial neural networks. IEEE Trans Biomed Eng. 2005;52(1):30–40. doi: 10.1109/TBME.2004.839630. [DOI] [PubMed] [Google Scholar]
- 9.Andrew B, Gardner AMK, Vachtsevanos George, Litt Brian. One-Class Novelty Detection for Seizure Analysis from Intracranial EEG. Journal of Machine Learning Research. 2006;7:1025–1044. [Google Scholar]
- 10.Guler I, Ubeyli ED. Multiclass Support Vector Machines for EEG-Signals Classification. Information Technology in Biomedicine, IEEE Transactions on. 2007;11(2):117–126. doi: 10.1109/titb.2006.879600. [DOI] [PubMed] [Google Scholar]
- 11.Suryannarayana Chandaka AC, Munshi Sugata. Cross-correlation aided support vector machine classifier for classification of EEG signals. Expert Syst. Appl. 2009;36(2):1329–1336. [Google Scholar]
- 12.Vapnik VN. The nature of statistical learning theory. New York: Springer-Verlag; 1995. [Google Scholar]
- 13.Burges CJC. A Tutorial on Support Vector Machines for Pattern Recognition. Data Mining and Knowledge Discovery. 1998;2(2):121–167. [Google Scholar]
- 14.Qu H, Gotman J. A patient-specific algorithm for the detection of seizure onset in long-term EEG monitoring: possible use as a warning device. IEEE Trans Biomed Eng. 1997;44(2):115–122. doi: 10.1109/10.552241. [DOI] [PubMed] [Google Scholar]
- 15.Wilson SB. Algorithm architectures for patient dependent seizure detection. Clin Neurophysiol. 2006;117(6):1204–1216. doi: 10.1016/j.clinph.2006.02.014. [DOI] [PubMed] [Google Scholar]
- 16.Shoeb A, et al. Impact of patient-specificity on seizure onset detection performance. Conf Proc IEEE Eng Med Biol Soc. 2007;2007:4110–4114. doi: 10.1109/IEMBS.2007.4353240. [DOI] [PubMed] [Google Scholar]
- 17.Haas SM, Frei MG, Osorio I. Strategies for adapting automated seizure detection algorithms. Med Eng Phys. 2007;29(8):895–909. doi: 10.1016/j.medengphy.2006.10.003. [DOI] [PMC free article] [PubMed] [Google Scholar]
- 18.Saab ME, Gotman J. A system to detect the onset of epileptic seizures in scalp EEG. Clin Neurophysiol. 2005;116(2):427–442. doi: 10.1016/j.clinph.2004.08.004. [DOI] [PubMed] [Google Scholar]
- 19.Herbert M, Teager SMT. Evidence for nonlinear sound production mechanisms in the vocal tract. D. Vol. 55. France: Kluwer Acad. Publ.; 1990. pp. 241–261. [Google Scholar]
- 20.Kaiser JF. On a simple algorithm to calculate the `energy' of a signal. Acoustics, Speech, and Signal Processing, 1990. ICASSP-90; 1990 International Conference on.1990. [Google Scholar]
- 21.Amigo JM, et al. Estimating the entropy rate of spike trains via Lempel-Ziv complexity. Neural Comput. 2004;16(4):717–736. doi: 10.1162/089976604322860677. [DOI] [PubMed] [Google Scholar]
- 22.Jing H, Jianbo G, Principe JC. Analysis of Biomedical Signals by the Lempel-Ziv Complexity: the Effect of Finite Data Size. Biomedical Engineering, IEEE Transactions on. 2006;53(12):2606–2609. doi: 10.1109/TBME.2006.883825. [DOI] [PubMed] [Google Scholar]
- 23.Chih-Chung Chang C-JL. LIBSVM: a library for support vector machines. 2001 [Google Scholar]
- 24.Kannathal N, et al. Entropies for detection of epilepsy in EEG. Comput Methods Programs Biomed. 2005;80(3):187–194. doi: 10.1016/j.cmpb.2005.06.012. [DOI] [PubMed] [Google Scholar]
- 25.Nihal Fatma Guler EDU, Guler Inan. Recurrent neural networks employing Lyapunov exponents for EEG signals classification. Expert Systems with Applications. 2005;29:506–514. [Google Scholar]
- 26.Mousavi SR, Niknazar M, Vahdat BV. Epileptic Seizure Detection using AR Model on EEG Signals. Biomedical Engineering Conference, 2008; CIBEC 2008. Cairo International.2008. [Google Scholar]
- 27.Derya Ubeyli E. Statistics over features: EEG signals analysis. Comput Biol Med. 2009;39(8):733–741. doi: 10.1016/j.compbiomed.2009.06.001. [DOI] [PubMed] [Google Scholar]
- 28.Feng Z, Durand DM. Low-calcium epileptiform activity in the hippocampus in vivo. J Neurophysiol. 2003;90(4):2253–2260. doi: 10.1152/jn.00241.2003. [DOI] [PubMed] [Google Scholar]
- 29.Feng Z, Durand DM. Effects of potassium concentration on firing patterns of low-calcium epileptiform activity in anesthetized rat hippocampus: inducing of persistent spike activity. Epilepsia. 2006;47(4):727–736. doi: 10.1111/j.1528-1167.2006.00499.x. [DOI] [PubMed] [Google Scholar]
- 30.Park EH, Feng Z, Durand DM. Diffusive coupling and network periodicity: a computational study. Biophys J. 2008;95(3):1126–1137. doi: 10.1529/biophysj.108.129239. [DOI] [PMC free article] [PubMed] [Google Scholar]


