

Abstract
Two-dimensional (2D)[1H, 15N] heteronuclear single-quantum coherence (HSQC) NMR experiments of the kinetics of aquation and sulfation of the dinuclear platinum anticancer complex [{trans-PtCl(NH3)2}2(μ-NH2(CH2)6NH2)]2+ (1,1/t,t, 1) in 15 mM sulfate solution are reported using conditions (298 K, pH 5.4) identical to those previously used for other anionic systems (phosphate and acetate), allowing for a direct comparison. Sulfate is the fourth most abundant anion in human plasma. The rate constant for the aquation step (kH) is higher than that previously found in the presence of phosphate, but the anation rate constants are similar. The rate constant for sulfate displacement of the aqua ligand (kL) is approximately three times higher than that of phosphate, and a further major difference between these two anions is the very high k−L for loss of sulfate, suggesting that when formed in plasma the sulfato species will be substitution labile. We also introduce a novel (free) plug-in, ‘2D NMR analysis’, developed for the expedited integration and analysis of 2D [1H, 15N] HSQC NMR spectra. We have found that this plug-in significantly reduces the amount of time taken in the analysis of experiments with no loss to the quality of the data.
Introduction
The commonly accepted understanding of platinum anti-cancer drug mechanism is of hydrolysis prior to activation and reaction with biomolecules. The properties of the aquation products of cisplatin, cis-[Pt(H2O)2(NH3)2]2+ and cis-[PtCl-(H2O)(NH3)2]+, have been much investigated.1 Interactions with weak nucleophiles, especially if present in high concentrations, can also affect the biodistribution of platinum agents through formation of weakly bound species or even hydrogen bonding and electrostatic interactions. For example, interaction with carbonate has been implicated as a possible mechanism of cellular accumulation of cisplatin through the formation of carbonato–platinum intermediates.2,3
Inorganic sulfate (SO42−) is another example of a weak anion involved in a wide variety of metabolic and cellular processes. Surprisingly, little study of SO42− binding to Pt has been reported,4 although sulfate is the fourth most abundant anion in human plasma. Serum sulfate concentrations are reported to be typically in the range 0.3–0.4 mM5–7 but are strongly influenced by a variety of physiological factors and can be much higher than this under certain conditions.7 Estimates of intra-cellular concentrations of SO42− vary widely,7,8 and many cells have multiple transport proteins regulated in part by sulfur metabolism.7
This paper investigates the aquation and sulfation profile of a dinuclear platinum complex, fully 15N-labeled [{trans-PtCl-(15NH3)2}2(μ-15NH2(CH2)6 15NH2)]2+ (15N-1,1/t,t, 15N-1) using two-dimensional (2D) [1H, 15N] heteronuclear single-quantum coherence (HSQC) NMR spectroscopy. Polynuclear platinum-based anticancer complexes (PPCs) have been shown to have distinctly different DNA binding modes compared to cisplatin and its analogs carboplatin and oxaliplatin.9–12 The dramatic shift in structure from that of the fundamental mononuclear platinum class provides approaches to overcome inherent and acquired resistance associated with the currently used clinical agents. The dinuclear complex 1,1/t,t, (1) and the trinuclear complex, [{trans-PtCl(NH3)2}2(μ-trans-Pt(NH3)2(NH2-(CH2)6NH2)2)]4+ (1,0,1/t,t,t) are archetypal examples of PPCs and have trans geometry about the terminal {PtN3X} moieties. The dinuclear complex [{cis-PtCl(NH3)2}2(μ-H2N(CH2)6NH2)] (1,1/c,c) is representative of the cis geometry (see Figure 1). The trinuclear complex 1,0,1/t,t,t has recently undergone both phase I13 and II14,15 clinical trials and has been shown to be cytotoxic at concentrations that are 20-fold lower than that of cisplatin. This increased potency has been attributed to its unique DNA binding profile in comparison to mononuclear agents.16
Figure 1.

Polynuclear platinum complexes −1,1/t,t (1), 1,0,1/t,t,t and 1,1/c,c. Also shown is the basic repeat unit for the oligosaccaride and heparan sulfate and a general structure for a phospholipid.
We have previously used [1H, 15N] NMR spectroscopy to study the interactions of 15N-labeled 1,1/t,t, 1,0,1/t,t,t, and 1,1/c,c with the physiologically relevant anions phosphate and acetate.17 To allow for a direct comparison with the results of the experiments with these anions, the current study of the reaction of 15N-1 with sulfate was carried out under identical conditions. Reported herein are the forward and reverse rate and equilibrium constants for both the aquation and the sulfation of 15N-1 in 15 mM sodium sulfate solution, at pH 5.4 and 298 K.
Two-dimensional [1H, 15N] HSQC NMR spectroscopy is used routinely to study 15N-labeled platinum am(m)ine complexes allowing for all (relevant) species formed in solution over the course of a reaction to be monitored (see for example refs 2 and 18–22). While this technique has allowed the finer details of the behavior of these complexes in solution to be elucidated, it involves individual analysis of the 2D [1H, 15N] HSQC NMR spectra acquired and can be time consuming. A further novel aspect of this work is the development of a plug-in, ‘2D NMR analysis’ for the expedited integration and the analysis of 2D NMR data of this type, which significantly reduces the time taken in the analysis of these experiments with no affect on the quality of the results.
Experimental Section
Chemicals
The 15N-labeled dinuclear complex [{trans-PtCl-(15NH3)2}2-(μ-15NH2(CH2)6 15NH2)]2+ (15N-1,1/t,t or 15N-1) was prepared using published procedures23 and was a gift from Dr. Eva Montero.
Aquation Experiment
A freshly prepared solution of 15N-1 (0.30 mg, 0.39 mmol) dissolved in Na2SO4 solution (40 μL, 15 mM) was added to an NMR tube containing Na2SO4 (60 μL, 0.1 M), 1,4-dioxane (10 μL, 10 mM), D2O (20 μL), and H2O (310 μL), giving an initial concentration of 0.89 mM 15N-1 in 15 mM sodium sulfate in 5% D2O/95% H2O. The sample was immediately placed in the spectrometer, and a series of 2D [1H, 15N] HSQC NMR spectra recorded at 298 K until equilibrium conditions were obtained. The pH of the solution was 5.4.
pH Measurements
The pH of the solution was measured using a Shindengen ISFET (semiconductor) pH meter (pH Boy-KS723 (SU-26F)). To avoid leaching of chloride into the sample, a 10 μL aliquot of the solution was placed on the electrode and was not returned to the sample. The pH meter was calibrated using pH 4.0 and 6.9 buffer solutions. Adjustments in pH were made using 0.1 and 0.01 M solutions of H2SO4 and NaOH.
NMR Spectroscopy
The NMR spectra were recorded on a Bruker AVANCE 600 MHz spectrometer (1H, 599.92 MHz; 15N, 60.79 MHz). The 1H spectra were internally referenced to 1,4 dioxane (δ = 3.767 ppm), and the 15N chemical shifts were externally referenced to 15NH4Cl (1.0 M in 1.0 M HCl in 95% H2O/5% D2O) at δ(15N)=0.0 ppm. The 1H NMR spectra were acquired with water suppression using the WATERGATE pulse sequence.24 The 2D [1H, 15N] HSQC NMR spectra (decoupled by irradiation with the GARP-1 sequence during acquisition) optimized for 1J(15N,1H) = 72 Hz were recorded using the standard Bruker phase sensitive HSQC pulse sequence.25 One-dimensional 1H spectra were recorded with 32 transients, a spectral width of 12 kHz, and a relaxation delay of 1.5 s. For the 2D [1H, 15N] HSQC NMR spectra, 8 transients were collected for 128 increments of t1 with an acquisiton time 0.152 s and spectral widths of 2 kHz in f2 (1H) and 1.8 kHz in f1 (15N). The spectra were processed using Gaussian weighting functions in both dimensions.
Data Analysis
The concentrations of species present during the reaction were calculated from the relative volumes of the cross-peaks in the 2D [1H, 15N] HSQC NMR spectra as described previously.17 The peak volumes of the Pt–15NH3 groups were measured using the novel plug-in 2D NMR analysis developed for the program ImageJ (available free online at http://rsbweb.nih.gov/ij), allowing for the rapid integration of multiple 2D [1H, 15N] HSQC spectra. The standard Bruker software XWINNMR was also used for comparative purposes using previously described methods (see Figure S3, Supporting Information).17 ImageJ, a program developed for the analysis of microscopy data, is able to read in single 2D and 3D NMR spectra acquired on Bruker instruments via a plug-in (BrukerOpener.jar),26 developed by Bertram Manz. Using the 2D NMR analysis plug-in, multiple spectra (as 2rr files) are read-in, and a stack of these files created. Regions of interest (ROI) specified by the user in each image in the stack are integrated. Intensity values for 2D crosspeaks are calculated by summing the intensities of each pixel in the ROI (see Supporting Information, Figures S1 and S2). Relative concentrations are then calculated by normalizing peak volumes which are converted into concentrations of the individual species for kinetic analysis.17
Kinetic Model
The reaction profile and the model used in the kinetic analysis are shown in Scheme 1. The model treats 1 and its derived [trans-Pt(NH3)2(NH2(CH2)6NH2)Y]n+ species as mononuclear units.17 In this model, the total volume for each crosspeak accounts for the total concentration of the Pt–Cl (I), Pt–OH2 (II), and Pt–SO4 (III) species. The concentrations of the species of interest were then subject to kinetic analysis in the program Scientist (version 3.0) using the Euler fitting method to determine the forward and reverse rate constants for the aquation and sulfation of 1. The aquation and sulfation steps were both assumed to be reversible. The errors reported represent 1 standard deviation (SD). The model to which the data were fit in Scientist is available in Supporting Information (Model S1).
Scheme 1.

Results and Discussion
Aquation of 1 in Sulfate Medium
The 2D [1H, 15N] HSQC NMR spectra of 1 at 298 K in 15 mM sodium sulfate solution (pH 5.4) recorded 0.3 h after the start of the reaction and upon attaining equilibrium are shown in Figure 2. These conditions are identical to those used previously for reactions of 1 (1,1/t,t), 1,1/c,c, and 1,0,1/t,t,t in acetate and phosphate (15 mM), thus allowing for direct comparison.17,27 The 1H and 15N chemical shifts of the 15NH3 and 15NH2 groups of the different species are listed in Table 1. The 15N shifts of the Pt–NH3 groups are less sensitive to changes in the leaving ligand (chloro, aqua, sulfate) than the trans-NH2 group, but the 1H/15N cross-peaks are well separated from each other in the 1H dimension and are more accurately measured than the broader NH2 peaks, which lie close to the 1H2O resonance.
Figure 2.

Two-dimensional [1H, 15N] HSQC NMR spectra of 15N-labeled 1 in 15 mM sulfate (95% H2O/5% D2O) at pH 5.4 and 298 K at the start of the reaction (0.3 h) and at equilibrium (40.3 h). The resonances are assigned to the Pt–15NH2 and Pt–15NH3 groups of the Pt–Cl (I), Pt–OH2 (II), and Pt–SO4 (III) species and correspond to the mononuclear derivative of 1,1/t,t, [trans-Pt(NH3)2(NH2(CH2)6NH2)Y]n+, where Y represents any other ligand (see Scheme 1). Peak assignments are shown in Table 1. Peaks labeled ‘i’ are assigned to 15N impurities from the synthesis of 15N-1; their presence does not compromise these experiments, as discussed in detail elsewhere.23
Table 1.
1H and 15N Chemical Shifts for the Pt–15NH3 and Pt–15NH2 Groups for the Species Observed during the Aquation of 1a
|
15NH3 |
15NH2 |
|||
|---|---|---|---|---|
| 1,1/t,t species | δ1H | δ15N | δ1H | δ15N |
| I (Cl/Y) | 3.89 | −64.5 | 5.05 | −47.0 |
| II (OH(H)/Y)b | 4.12 | −62.3 | 5.12 | −63.8 |
| III (SO4/Y) | 4.04 | −60.9 | 5.14 | −65.9 |
| III (OAc/Y)c | 3.95 | −63.7 | 4.95 | −61.8 |
| III (PO4/Y)c | 3.98 | −61.1 | 4.94 | −63.9 |
In the presence of sulfate, acetate, and phosphate at pH 5.4 and 298 K. The 1H referenced internally to 1,4-dioxane at δ 3.767, and 15N referenced externally to 15NH4Cl. Roman numerals represent the mononuclear species [trans-Pt(NH3)2(NH2(CH2)6NH2)Y]n+, as shown in Scheme 1 in the kinetic model. Y represents any other ligand, Cl, H2O, SO4, OAc, or PO4.
The 1H, 15N shifts depend on the pH; for titration curves see ref 23.
From ref 17 and under identical conditions (pH 5.4 and 298 K).
The 1H/15N crosspeaks at δ 3.89/−64.5 (NH3) and 5.05/−47.0 ppm (NH2) correspond to the parent dichloro species (Pt–Cl, I), with less intense crosspeaks at δ 4.12/−62.3 (NH3) and 5.12/−63.8 ppm (NH2) attributable to the aquated species (Pt–OH2, II). The latter crosspeaks shift slightly (to δ 4.15/−62.1 and 5.20/−64.5 ppm) as the reaction proceeds, indicative of a slight drop in pH.23 Two additional peaks at δ 4.04/−60.8 (NH3) and 5.14/−65.9 ppm (NH2) become visible as the reaction proceeds and are assigned to the sulfato species (Pt–SO4, III).
Kinetic Analysis
The kinetic profile of the aquation of 1 in sulfate is shown in Figure 3, and the rate and equilibrium constants are summarized in Table 2. The system reaches equilibrium after 12 h (Figure 3), and while the profile resembles that observed for the analogous reaction of 1 in phosphate,17 there are significant differences. The forward rate constant (kH) is ~1.5–2.1 times higher than that calculated for 1 in both phosphate and acetate17 (see Table 2). It is also higher than that of 1,1/c,c in both acetate and phosphate.17 However, it is comparable to that of 1,0,1/t,t,t in phosphate.27 The anation rate constant (k−H) for the reformation of chloro species (Pt–OH2→Pt–Cl) in sulfate solution is slightly lower than that for phosphate but similar to that calculated for 1 in acetate.17 The rate constant for sulfate displacement of the aqua ligand, kL, is up to 5 times higher than the analogous rate constants for phosphate and acetate in any of the systems studied previously17 (see Table 2). Interestingly, however, the aquation of the sulfato ligand, k−L, is significantly faster; up to 2 orders of magnitude in comparison to displacement of either acetate or phosphate.
Figure 3.
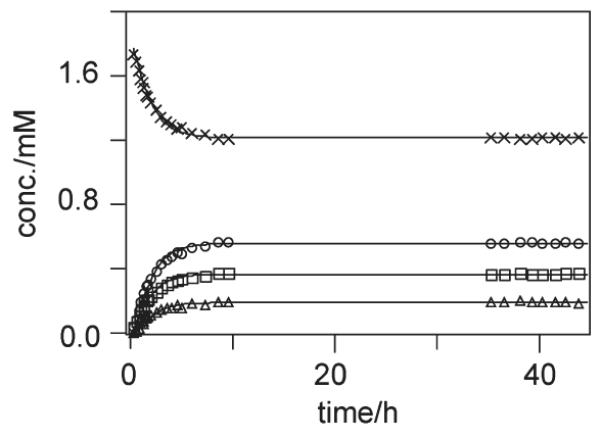
Plots of the time dependence of species observed for the aquation of 1 in the presence of 15 mM sulfate (95% H2O/5% D2O) at pH 5.4 and 298 K, according to the kinetic model as shown in Scheme 1. Concentrations were calculated based on the mononuclear [trans-Pt-(NH3)2(NH2(CH2)6NH2)Y]n+ species (see text). Key: I is “x”; Cl− is open circles (엯); II is open squares (◻); and III is open triangles (▵).
Table 2.
Rate and Equilibrium Constants for the Aquation and Ligation of 1,1/t,t,17 1,0,1/t,t,t,27 and 1,1/c,c17 in 15 mM Sulfate, Acetate, and Phosphatea
| compound | anion (L) | kH(10−5 s−1) | k−H(M−1 s−1) | kL (M−1 s−1) | k−L (10−5 s−1) | pK1 | pK2 |
|---|---|---|---|---|---|---|---|
| 1,1/t,t | SO42− | 3.85 ± 0.05 | 0.229 ± 0.04 | 0.025 ± 0.004 | 70 ± 10 | 3.77 ± 0.01 | −1.6 ± 0.1 |
| PO43− | 2.49 ± 0.04 | 0.40 ± 0.01 | 0.0086 ± 0.0002 | 3.9 ± 0.1 | 4.21 ± 0.02 | −2.34 ± 0.02 | |
| OAc− | 1.83 ± 0.03 | 0.262 ± 0.009 | 0.0086 ± 0.0001 | 0.56 ± 0.02 | 4.16 ± 0.02 | −3.19 ± 0.02 | |
| 1,1/c,c | OAc− | 1.56 ± 0.02 | 0.134 ± 0.005 | 0.0066 ± 0.0001 | 0.38 ± 0.01 | 3.93 ± 0.02 | −3.24 ± 0.02 |
| PO43− | 2.18 ± 0.03 | 0.145 ± 0.005 | 0.0071 ± 0.0001 | 0.70 ± 0.02 | 3.82 ± 0.02 | −3.01 ± 0.02 | |
| 1,0,1/t,t,t | PO43− | 3.4 ± 0.1 | 0.275 ± 0.009 | 0.0166 ± 0.0002 | 5.4 ± 0.1 | 3.73 ± 0.02 | −2.51 ± 0.01 |
According to the kinetic model shown in Scheme 1.
The derived equilibrium constants pK1 and pK2 are 3.77 and −1.6, respectively. The pK1 value is almost 0.5 log units lower compared to that of 1 in either acetate or phosphate.17 It is, however, similar to that of 1,0,1/t,t,t in phosphate buffer27 (see Table 2). At equilibrium, the majority (68.4%) of 1 remains in the chloro form (Pt–Cl, I) while the aquated (Pt–OH2, II) and the sulfato species (Pt–SO4, III) have much lower equilibrium concentrations, accounting for 20.9 and 10.7% of the total species, respectively. In summary, the dichloro species is favored in all systems, and there is a greater proportion of the aquated species present in the case of 1 in sulfate solution compared to the other systems studied.
Novel Plug-In for the Expedited Integration of 2D [1H, 15N] HSQC NMR Spectra
For studies following the pathways of reactions of platinum am(m)ine anticancer complexes (e.g., aquation reactions or DNA binding) up to 200 sequential 2D [1H, 15N] HSQC spectra are typically recorded. Thus, the analysis of each spectrum can be a time-consuming process and can also be subject to human error (as ROI cannot be saved using the available software). It was for these reasons that avenues for either partially or wholly automating the process were explored. Herein, we used the aquation of 1 in the presence in sulfate as a case study for our novel plug-in, 2D NMR analysis, for use in the program ImageJ. This option allows observation of even the most subtle of changes that are otherwise unnoticed when simply looking at individual spectra. Figure S3 in the Supporting Information compares the data from the two processing procedures, confirming the reliability of the plug-in. ImageJ is a freeware program with all the source code available free online. It also runs on Java and can be used on Windows, Linux or Mac OS/OS X operating systems.
Conclusions
The novel (free) plug-in, two-dimensional (2D) NMR analysis , introduced here is an exciting development for studies following the pathways of reactions of platinum am(m)ine anticancer complexes. It significantly reduces the time taken to integrate multiple 2D [1H, 15N] heteronuclear single-quantum coherence (HSQC) NMR spectra, without diminishing the quality of the data, and allows for a more detailed understanding of the experiment being studied. Moreover, the plug-in can be applied more generally to the analysis of different types of 2D NMR spectra.
While sulfate reactions have been reported for cis-[PtCl2-(NH3)2], the physiological relevance has not been discussed.4 The comparative data for the aquation of 1,1/t,t in the presence of phosphate and sulfate show that the rate constant for sulfate displacement of the aqua ligand (kL) is approximately three times higher than that of phosphate, while for the reverse ligation reaction (k−L) the rate constant is more than an order of magnitude of higher. Given the plasma and cellular concentrations of SO42− and the presence of many sulfonated sites on biological membranes, these reactions may have physiological significance. The rate constant for the formation of the sulfato species is sufficiently high enough to suggest that this may occur. The large rate constant for the reverse ligation reaction suggests that binding of the sulfate occurs quickly and is liberated even more quickly. Reversible reactions with weak anions of membrane components are an attractive postulate for the mechanism of cellular transport and worthy of further study with appropriate models.
Supplementary Material
Acknowledgment
The authors thank the University of Western Australia for a University Postgraduate Award (R.A.R.). This work was supported by the Australian Research Council [Discovery Grants to S.B.-P. and N.P.F. (DP0662817 and DP1095383) and to B.C. (DP0769983)] and the National Institutes for Health (ROI-CA78754).
Footnotes
Supporting Information Available: Scientist model used to fit the kinetic data (Model S1), snapshot of the 2D NMR analysis plug-in (Figure S1), snapshot of a typical ‘stack’ created using 2D NMR analysis (Figure S2), and comparison of the kinetic plots obtained with data derived using 2D NMR analysis and XWINNMR (Figure S3). ImageJ, 2D NMR analysis and instructions for its use are available online at http://rsbweb/nih.gov/ij. This material is available free of charge via the Internet at http://pubs.acs.org.
References
- (1).Berners-Price SJ, Appleton TG. In: Platinum-Based Drugs in Cancer Therapy. Kelland LR, Farrell NP, editors. Humana Press; Totowa, NJ: 2000. pp. 3–35. [Google Scholar]
- (2).Centerwall CR, Goodisman J, Kerwood DJ, Dabrowiak JC. J. Am. Chem. Soc. 2005;127:12768–12769. doi: 10.1021/ja053353c. [DOI] [PubMed] [Google Scholar]
- (3).Centerwall CR, Tacka KA, Kerwood DJ, Goodisman J, Toms BB, Dubowy RL, Dabrowiak JC. Mol. Pharmacol. 2006;70:348–355. doi: 10.1124/mol.106.023184. [DOI] [PubMed] [Google Scholar]
- (4).Appleton TG, Hall JR, Ralph SF, Thompson CSM. Inorg. Chem. 1984;23:3521–3525. [Google Scholar]
- (5).Becker EL, Heinemann HO, Igaraski K, Hodler JE, Gershberg H. J. Clin. Invest. 1960;39:1909–1913. doi: 10.1172/JCI104215. [DOI] [PMC free article] [PubMed] [Google Scholar]
- (6).Krijgsheld KR, Scholtens E, Mulder GJ. Comp. Biochem. Physiol. 1980;67A:683–686. [Google Scholar]
- (7).Cole DEC, Evrovski J. Crit. Rev. Clin. Lab. Sci. 2000;37:299–344. doi: 10.1080/10408360091174231. [DOI] [PubMed] [Google Scholar]
- (8).Mohapatra NK, Cheng P-W, Parker JC, Paradiso AM, Yankaskas JR, Boucher RC, F BT. Am. J. Physiol. 1993;264:Cl231–C1237. doi: 10.1152/ajpcell.1993.264.5.C1231. (Cell Physiol. 33) [DOI] [PubMed] [Google Scholar]
- (9).Cox JW, Berners-Price SJ, Davies MS, Qu Y, Farrell N. J. Am. Chem. Soc. 2001;123:1316–1326. doi: 10.1021/ja0012772. [DOI] [PubMed] [Google Scholar]
- (10).Hegmans A, Berners-Price SJ, Davies MS, Thomas DS, Humphreys AS, Farrell N. J. Am. Chem. Soc. 2004;126:2166–2180. doi: 10.1021/ja036105u. [DOI] [PubMed] [Google Scholar]
- (11).Kasparkova J, Zehnulova J, Farrell N, Brabec V. J. Biol. Chem. 2002;277:48076–48086. doi: 10.1074/jbc.M208016200. [DOI] [PubMed] [Google Scholar]
- (12).Ruhayel RA, Moniodis JJ, Yang X, Kasparkova J, Brabec V, Berners-Price SJ, Farrell NP. Chem.—Eur. J. 2009;15:9365–9374. doi: 10.1002/chem.200900958. [DOI] [PMC free article] [PubMed] [Google Scholar]
- (13).Sessa C, Capri G, Gianni L, Peccatori F, Grasselli G, Bauer J, Zucchetti M, Vigano L, Gatti A, Minoia C, Liati P, Van den Bosch S, Bernareggi A, Camboni G, Marsoni S. Ann. Oncol. 2000;11:977–983. doi: 10.1023/a:1008302309734. [DOI] [PubMed] [Google Scholar]
- (14).Jodrell DI, Evans TRJ, Steward W, Cameron D, Prendiville J, Aschele C, Noberasco C, Lind M, Carmichael J, Dobbs N, Camboni G, Gatti B, De Braud F. Eur. J. Cancer. 2004;40:1872–1877. doi: 10.1016/j.ejca.2004.04.032. [DOI] [PubMed] [Google Scholar]
- (15).Hensing TA, Hanna NH, Gillenwater HH, Camboni MG, Allievi C, Socinski MA. Anti-Cancer Drugs. 2006;17:697–704. doi: 10.1097/01.cad.0000215054.62942.7f. [DOI] [PubMed] [Google Scholar]
- (16).Farrell N. Met. Ions Biol. Syst. 2004;42:251–296. [PubMed] [Google Scholar]
- (17).Zhang J, Thomas DS, Davies MS, Berners-Price SJ, Farrell N. J. Biol. Inorg. Chem. 2005;10:652–666. doi: 10.1007/s00775-005-0013-5. [DOI] [PubMed] [Google Scholar]
- (18).Berners-Price SJ, Ronconi L, Sadler PJ. Prog. Nucl. Magn. Reson. Spectrosc. 2006;49:65–98. [Google Scholar]
- (19).Guo Z, Chen Y, Zang E, Sadler PJ. Dalton Trans. 1997:4107–4112. [Google Scholar]
- (20).Gibson D, Kasherman Y, Kowarski D, Freikman I. J. Biol. Inorg. Chem. 2006;11:179–188. doi: 10.1007/s00775-005-0064-7. [DOI] [PubMed] [Google Scholar]
- (21).Alvheim C, Frøystein NA, Vinje J, Intini FP, Natile G, Liu Y, Huang R, Sletten E. Inorg. Chim. Acta. 2009;362:907–914. [Google Scholar]
- (22).Di Pasqua AJ, Centerwall CR, Kerwood DJ, Dabrowiak JC. Inorg. Chem. 2009;48:1192–1197. doi: 10.1021/ic801579h. [DOI] [PubMed] [Google Scholar]
- (23).Davies MS, Cox JW, Berners-Price SJ, Barklage W, Qu Y, Farrell N. Inorg. Chem. 2000;39:1710–1715. doi: 10.1021/ic991104h. [DOI] [PubMed] [Google Scholar]
- (24).Piotto M, Saudek V, Sklenar V. J. Biomol. NMR. 1992;2:661–665. doi: 10.1007/BF02192855. [DOI] [PubMed] [Google Scholar]
- (25).McCoy MA, Mueller L. J. Magn. Reson., Ser. A. 1993;101:122–130. [Google Scholar]
- (26).Bruker NMR Files. National Institutes of Health (NIH); Bethesda, MD: available online at http://rsbweb.nih.gov/ij/plugins/bruker.html. [Google Scholar]
- (27).Davies MS, Thomas DS, Hegmans A, Berners-Price SJ, Farrell N. Inorg. Chem. 2002;41:1101–1109. doi: 10.1021/ic010851n. [DOI] [PubMed] [Google Scholar]
Associated Data
This section collects any data citations, data availability statements, or supplementary materials included in this article.