

Abstract
In cardiomyocytes, a major decrease in the level of sarco/endoplasmic reticulum Ca2+ ATPase (SERCA) can severely impair systolic and diastolic functions. In mice with cardiomyocyte-specific conditional excision of the Serca2 gene (SERCA2 KO), end-stage heart failure developed between four and seven weeks after gene deletion combined with [Na+]i elevation and intracellular acidosis. In this study, to investigate the underpinning changes in Ca2+ dynamics and metabolic homeostasis, we developed data-driven mathematical models of Ca2+ dynamics in the ventricular myocytes of the control, four-week, and seven-week SERCA2 knockout (KO) mice. The seven-week KO model showed that elevated [Na+]i was due to increased Na+ influxes through the Na+/Ca2+ exchanger (NCX) and the Na+/H+ exchanger, with the latter exacerbated by intracellular acidosis. Furthermore, NCX upregulation in the seven-week KO model resulted in increased ATP consumption for ion transport. Na+ accumulation in the SERCA KO due to NCX upregulation and intracellular acidosis potentially play a role in the development of heart failure, by initiating a reinforcing cycle involving: a mismatch between ATP demand and supply; an increasingly compromised metabolism; a decreased pHi; and, finally, an even greater [Na+]i elevation.
Introduction
Heart failure (HF) is a complex and multifactorial disease that remains poorly understood (1). Among many other pathological changes, altered cellular Ca2+ regulation is believed to be central to the genesis of cardiac diseases (2,3). Intracellular Ca2+ concentration ([Ca2+]i) is regulated by an interdependent system of ion channels and transporters. During each cardiac cycle, Ca2+ entry into the myocyte through the voltage-gated L-type Ca2+ channels activates Ca2+-induced-Ca2+ release from the sarcoplasmic reticulum (SR), resulting in a transient rise in [Ca2+]i that initiates myocardial contraction. Relaxation occurs as [Ca2+]i returns to its resting level through Ca2+ reuptake into the SR via the SR Ca2+ ATPase (SERCA) and Ca2+ extrusion through the Na+/Ca2+ exchanger (NCX) and the plasma-membrane Ca2+ ATPase (PMCA). Ca2+ extrusion through NCX (the primary mechanism for Ca2+ extrusion during most of the cardiac cycle) is closely linked to intracellular Na+ homeostasis because the concentration gradient of [Na+] across the sarcolemma, together with the membrane potential, provides the driving force for Ca2+ transport through the exchanger. The maintenance of the Na+ concentration gradient is in turn achieved via an ATP-consuming process of Na+ extrusion through the Na+/K+ ATPase (NKA).
The complexity of HF is likely to be underpinned by multiple individual mechanisms. However, genetically modified animals are widely used as experimental models to isolate these mechanisms, including, of particular relevance for this study, compromised Ca2+ handling. Our previous study of mice with conditional cardiomyocyte-specific SERCA2 knockout (KO) showed surprisingly normal cardiac function in KO mice at four weeks after gene deletion, compared to the control Serca2flox/flox mice (FF). In contrast, at the seven-weeks' time point, these animals developed end-stage HF. However, the mechanisms underlying the transition from compensated to decompensated state remained unclear.
In the previous modeling study of Ca2+ handling in the four-week KO animals (4), we identified the combined effect of the compensatory mechanisms at this time point was to maintain diastolic [Ca2+]i via NCX upregulation while optimizing systolic [Ca2+]i by increasing ICaL. In this study, we apply an integrated mathematical modeling analysis to investigate (to our knowledge, for the first time) the important changes over time in Ca2+ handling and ATP consumption for ion transport in SERCA KO cardiomyocytes that lead to the eventual progression into HF. In particular, we compare ATP consumption for ion transport per cardiac cycle in the FF, four-week, and seven-week KO mice models, investigate the mechanisms for [Na+]i elevation in the seven-week KO compared to the FF and four-week KO, and analyze the sensitivity of each model to metabolic imbalance. Finally, we examine the differential effects of compensatory mechanisms on ATP consumption for ion transport between the four-week and seven-week time points.
Methods
An expanded Materials and Methods section can be found in the Supporting Material. Briefly, Serca2flox/flox Tg(αMHC-MerCreMer) mice (KO) were employed to attain inducible, cardiomyocyte-specific disruption of the Serca2 gene (5). Serca2flox/flox mice (FF) served as controls (5,6), and gene excision was accomplished by inclusion of tamoxifen powder in the feed (7,8). Hearts were harvested at four and seven weeks after tamoxifen administration.
Cardiomyocytes were isolated as described in Andersson et al. (5) and Louch et al. (9), and intracellular [Ca2+] measured by whole-cell fluorescence or confocal microscopy in fluo-4 AM loaded cells (10). SR Ca2+ content was estimated by applying 10 mM caffeine. Contributions of SR and sarcolemmal Ca2+ fluxes were determined by comparing [Ca2+]i transients in the presence and absence of caffeine or caffeine + 5 mM Ni (11).
Patch-clamp experiments were conducted with low resistance pipettes (1–2 MΩ). Action potentials (APs) were triggered by injecting a brief depolarizing current, and L-type Ca2+ current was elicited by depolarizing voltage-clamp steps from −50 mV. Na+/K+ ATPase (NKA) currents were obtained by altering extracellular [K+] during ouabain blockade of specific NKA isoforms (8,12). Intracellular [Na+] and pH were measured as described in the Supporting Material.
Model development
An expanded section on model development can be found in the Supporting Material, detailing the justification for the subsarcolemmal framework due to thermodynamic constraints, its implementation following the approach of Shannon et al. (13) and parameterization based on experimental measurements. A full list of parameter values for the three models, FF, KO four-week, and KO seven-week are also provided. These models have been made available in the CellML repository (www.cellml.org).
Na+/K+ ATPase
For each model, α1 and α2 isoforms of the NKA were parameterized separately. Experimental measurements of INKA,α1 and INKA,α2 under voltage-clamp conditions, as well as existing published data on the voltage- and Na+-dependence of the isoforms were used for parameterization. Importantly, during parameterization of NKA for the seven-week KO model, it was found that NKA downregulation alone, at a level consistent with experimental measurements (10 and 40% decreases for α1 and α2 isoform currents, respectively), raised simulated [Na+]i from the FF value by ∼2 mmol/L. However, experimentally measured [Na+]i increased by 5.0 mmol/L from 9.6 mmol/L ± 1.4 mmol/L in the FF to 14.6 ± 1.1 mmol/L in the KO. Such increase was significantly higher than model prediction with NKA downregulation alone, indicating there might be additional mechanisms contributing to the elevation of [Na+]i. Because the magnitudes of the peak and persistent Na+ currents were not found to be increased experimentally in the KO, we investigated the impact of a decrease in the Na+ affinity of NKA and intracellular acidosis. Simulation results suggested both mechanisms could potentially explain the additional increase in [Na+]i in the KO (see the Supporting Material). Subsequent measurements of intracellular pH (pHi) revealed significant acidification in the seven-week KO cardiomyocytes (pHi 6.91 ± 0.07 vs. 7.19 ± 0.08 in FF, P < 0.05), suggesting an increased Na+/H+ exchanger (NHE) activity and hence an increased Na+ influx, which was consistent with our earlier hypothesis. We thus included additional pHi regulation system in the model, which was parameterized, as explained below, to the experimentally measured pHi and [Na+]i levels.
pHi regulation
To account for the decrease in pHi in the seven-week KO, a previously developed model of pHi regulation for rat ventricular myocytes (14) was introduced into the framework. Intracellular acidosis in the seven-week KO model was induced by the introduction of an acid flux (Jacid) from an intracellular acid-producing source. Jacid was set to be constant based on the experimental observation that changes in metabolites occur over a much longer timescale than a single heartbeat (15).
Calcium-handling mechanisms
For parameterization of NCX and PMCA for the FF and four-week KO models, the decay of experimentally measured caffeine-induced [Ca2+]i transients was fitted as shown in Fig. 1 A. For the seven-week KO model, because the magnitude of the experimentally measured caffeine-induced [Ca2+]i transient was very small, the field-stimulated [Ca2+]i transient (0.5 Hz) in the presence of caffeine was used (shown in the bottom panel of Fig. 1 A). The fitted NCX and PMCA formulations were then included during parameterization of SERCA using the experimentally measured decay of [Ca2+]i transients field-stimulated at 1 Hz, as shown in Fig. 1 B. The NCX, PMCA, and SERCA parameter values were then incorporated into the fitting of the L-type Ca2+ channels current (ICaL), as shown in Fig. 1, C and D.
Figure 1.
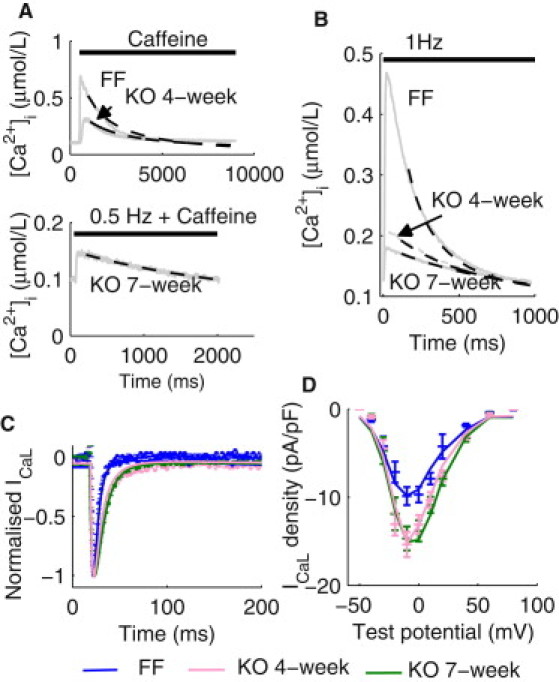
Parameterization of Ca2+ handling mechanisms. (A) (Top panel) Representative caffeine-induced [Ca2+]i transients in isolated ventricular myocytes from the FF and KO four-week mice. Simulated decay of the [Ca2+]i transients (dashed lines) using the respective final fitted parameter values for NCX and PMCA are superimposed. (Bottom panel) A representative [Ca2+]i transient paced at 0.5 Hz in the presence of caffeine in the KO seven-week cardiomyocytes. Simulated decay of the [Ca2+]i transient (dashed line) using the final fitted parameter values for NCX and PMCA are superimposed. (B) Representative [Ca2+]i transients at 1 Hz measured in the FF, KO four-week, and KO seven-week cardiomyocytes. Simulated decay of the [Ca2+]i transients using the respective final set of NCX, PMCA, and SERCA parameters are superimposed. (C) Representative normalized ICaL time courses under voltage-clamp from −50 mV holding potential to −10 mV test potential in the FF, KO four-week, and KO seven-week cardiomyocytes (dotted lines). Simulated ICaL timecourses under the voltage-clamp protocol are superimposed (solid lines). (D) Current-voltage relationship of ICaL in the FF, KO four-week, and KO seven-week cardiomyocytes. Simulated I/V relationships are superimposed.
Parameter values for the various K+ channels were kept identical between models for two reasons: 1), No changes in resting membrane potential and the transient outward current have been observed previously between FF and seven-week KO cardiomyocytes (8). 2), AP prolongation in seven-week KO was found to be removed by nifedipine, suggesting that prolongation resulted primarily from augmented ICaL.
Results
Validation
Simulated [Ca2+]i transients at 1 Hz in the FF, four-week KO, and seven-week KO models are shown in Fig. 2 A. Key characteristics are summarized in Table 1. Briefly, simulated diastolic [Ca2+]i in the FF, four-week KO, and seven-week KO models were 0.095, 0.121, and 0.124 μmol/L, respectively, compared to experimental values of 0.113 ± 0.025, 0.127 ± 0.014, and 0.108 ± 0.014 μmol/L, respectively, with no statistically significant changes. The magnitude of simulated [Ca2+]i transient (Δ[Ca2+]i) reduced by a further 31% between the four-week and the seven-week time points, leading to a total 75% reduction in Δ[Ca2+]i at seven-week compared to the FF. This is in agreement with the 85% reduction between the FF and seven-week KO measured experimentally. The time to half-decay of simulated [Ca2+]i (RT50) increased 1.2-fold between four-week and seven-week KO models, and in the seven-week KO model, RT50 was 2.5-fold longer than that in the FF model. Similarly, experimentally measured RT50 increased 1.3-fold between four-week and seven-week KO, and 2.2-fold between FF and seven-week KO.
Figure 2.
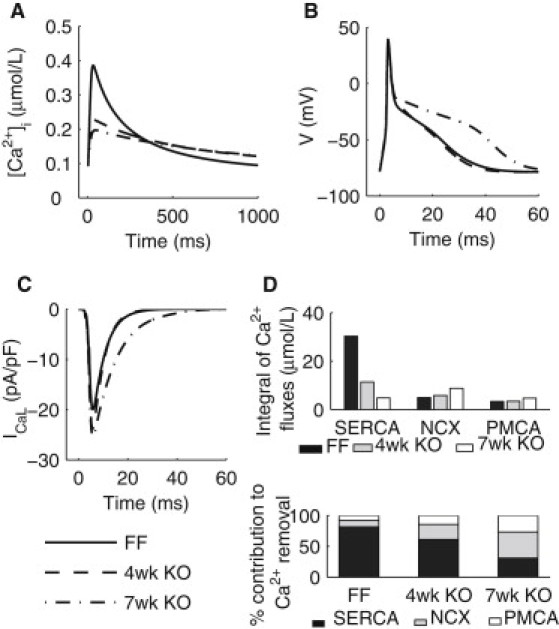
Simulation results from the FF, KO four-week, and KO seven-week models during an cardiac cycle at 1 Hz. (A) [Ca2+]i transients paced. (B) (Top panel) APs. (Bottom panel) Timecourses if ICaL during an AP. (C) Ca2+ fluxes through SERCA, NCX, and PMCA. (D) (Top panel) Integrals of Ca2+ fluxes through SERCA, NCX, and PMCA. (Bottom panel) Percentage contributions of SERCA, NCX, and PMCA to Ca2+ removal.
Table 1.
Comparison between experimental measured and simulated [Ca2+]i transients and APDs
| [Ca2+]i Transient and AP characteristics | FF |
KO four-week |
KO seven-week |
|||
|---|---|---|---|---|---|---|
| Experiment | Model | Experiment | Model | Experiment | Model | |
| Diastolic [Ca2+]i at 1 Hz (μmol/L) | 0.113 ± 0.025 | 0.095 | 0.127 ± 0.014 | 0.121 | 0.108 ± 0.014 | 0.124 |
| Magnitude at 1 Hz (μmol/L) | 0.343 ± 0.065 | 0.291 | 0.098 ± 0.031 | 0.106 | 0.051 ± 0.008 | 0.074 |
| RT50 at 1 Hz (ms) | 151 ± 14 | 137 | 285 ± 18 | 284 | 332 ± 27 | 336 |
| Δ[Ca2+]i (caffeine-induced) (μmol/L) | 0.612 ± 0.058 | 0.622 | 0.17 ± 0.04 | 0.168 | 0.025 ± 0.009 | 0.027 |
| Integral of ICaL (voltage-clamp) (pC/pF) | 0.111 ± 0.009 | 0.116 | 0.205 ± 0.020 | 0.225 | 0.243 ± 0.015 | 0.263 |
| % Contribution of SERCA | 87.7 ± 1.3 | 81.4 | 62.5 ± 7.5 | 61.2 | 33.7 ± 0.4 | 30.8 |
| % Contribution of NCX | 7 ± 0.9 | 11.0 | 23.3 ± 7.3 | 24.4 | 39.9 ± 6.0 | 42.5 |
| % Contribution of PMCA | 5.4 ± 0.7 | 7.6 | 14.3 ± 3.7 | 14.4 | 26.4 ± 3.3 | 26.7 |
| APD20 (ms) | 4.3 ± 0.2 | 4.1 | 4.1 ± 0.3 | 4.1 | 5.2 ± 0.7 | 4.0 |
| APD50 (ms) | 7.2 ± 0.8 | 6.4 | 11.4 ± 2.5 | 7.6 | 16.7 ± 3.3 | 14.9 |
| APD70 (ms) | 15.3 ± 3.2 | 19.9 | 16.8 ± 2.4 | 19.0 | 31.0 ± 5.6 | 37.8 |
| [Na+]i (mmol/L) | 9.6 ± 1.4 | 9.9 | Unchanged from FF values | 10.1 | 14.6 ± 1.1 | 14.2 |
| pHi | 7.19 ± 0.08 | 7.12 | Unchanged from FF values | 7.12 | 6.91 ± 0.07 | 6.85 |
The percentage contribution of SERCA, shown in Fig. 2 D, was calculated as the ratio between the integral of net Ca2+ uptake flux through SERCA and the integral of all Ca2+ removal fluxes through SERCA, NCX, and PMCA (Fig. 2 D, top panel). SERCA contribution decreased from 81.4% in the FF model to 61.2% in the four-week KO model and 30.8% in the seven-week KO model, compared to experimental values of 87.7, 62.5, and 33.7%, respectively (Fig. 2 D, bottom panel).
Experimentally measured [Na+]i and pHi levels were unchanged between the FF and four-week KO cardiomyocytes. In the seven-week KO cardiomyocytes, [Na+]i increased from the FF value of 9.6 ± 1.4 mmol/L to 14.6 ± 1.1 mmol/L, whereas pHi decreased from 7.19 ± 0.08 in the FF to 6.91 ± 0.07. Consistent with these observations, simulated [Na+]i and pHi were 9.9 mmol/L and 7.12 in the FF model, respectively, compared to the corresponding values of 14.2 mmol/L and 6.85 in the seven-week KO model.
In addition, a number of features not directly fitted were also quantitatively captured by the model. The magnitude of the caffeine-induced [Ca2+]i transient after 1 Hz stimulations, used experimentally to estimate SR Ca2+ content, decreased to 27% and 4% of the FF value, at the four-week and seven-week time points, respectively. In agreement with this observation, the magnitudes of the simulated caffeine-induced [Ca2+]i transients in the four-week and seven-week KO models were 27% and 4% compared to the FF model, respectively. Simulated SR Ca2+ content in the FF and seven-week models are 57.7 and 13.7 μmol/L cytosol, respectively. Simulated 1 Hz AP repolarization, shown in Fig. 2 B, was slightly prolonged in the four-week KO and became significantly slower in the seven-week KO model. The simulated time to 50% repolarization action potential duration (APD)50 was increased from 6.4 ms in the FF model to 14.9 ms in the seven-week KO model, in good agreement with the corresponding experimental values of 7.2 ± 0.8 and 16.7 ± 3.3 ms. Simulated APD70 was increased from 18.6 ms in the FF model to 35.7 ms in the seven-week KO model, respectively, compared to the corresponding experimental values of 15.3 ± 3.2 and 31.0 ± 5.6 ms. Simulated peak ICaL during an AP increased progressively from 20.0 pA/pF in the FF model to 23.8 pA/pF in seven-week KO models, as shown in Fig. 2 C. Inactivation of the current was significantly slowed in the seven-week KO, and the integral of the current during an AP increased from 0.17 pC/pF in the FF model to 0.33 pC/pF in the seven-week KO model, compared to experimental values of 0.11 and 0.38 pC/pF, respectively.
Simulated [Ca2+]i transients and [Na+]i at 6 Hz were also compared to experimental measurements. Simulated diastolic [Ca2+]i increased by 88% (0.095–0.178 μM) from 1 Hz to 6 Hz, compared to the 83% increase measured experimentally (0.113–0.207 μM). Simulated peak [Ca2+]i decreased by 38% (0.386–0.239 μM), compared to the 24% (0.456–0.346 μM) measured experimentally. Simulated RT50 of the decay of the [Ca2+]i transient decreased by 55% (137–62 ms), in agreement with the experimentally measured decrease of 61% (151–59 ms). Finally, simulated [Na+]i increased by 28% (9.9–12.7 mM) at 6 Hz, compared to experimentally measured 38% (9.6–13.3 mM).
ATP consumption per cardiac cycle
Intracellular acidosis in HF is attributed to a compromised metabolic state (16), thus prompting an analysis of simulated total amount of ATP used for ion transport per cardiac cycle in the model. The rate of ATP consumption by each of the ion transport processes was calculated from the simulated fluxes of Ca2+ through SERCA and PMCA, and the flux of Na+ through NKA, taking into account the stoichiometry of each transporter (SERCA 2Ca2+:1ATP, PMCA 1Ca2+:1ATP and NKA 3Na+:1ATP). The ATP consumption for ion transport per cardiac cycle was then calculated as the integral of the rate of ATP consumption over each cardiac cycle. As shown in Fig. 3 A, ATP consumption changed from 38.1 to 30.8–48.1 μmol/L in the FF, four-week, and seven-week KO models, respectively. The decrease between the FF and four-week KO models was primarily attributed to a decrease in ATP consumption by SERCA, while the increase between the four-week and seven-week KO models was due to a significant increase in ATP consumption by NKA in the presence of a continued decrease in ATP consumption by SERCA.
Figure 3.
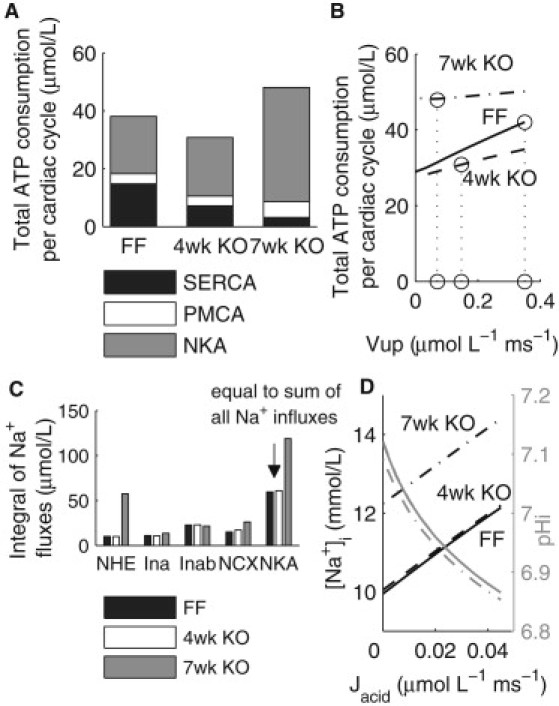
ATP consumption and Na+ homeostasis in the FF, four-week, and seven-week models. (A) ATP consumption per cardiac cycle by SERCA, PMCA, and NKA, and total consumption. (B) ATP consumption as a function of varying Vup. (C) Magnitudes of Na+ influxes and efflux. (D) Changes in [Na+]i as a function of the magnitude of Jacid.
To evaluate the dependence of ATP consumption on the maximum uptake rate of SERCA (Vup), a sensitivity analysis was performed on each model with Vup varied from the FF value (0.35 μmol·L−1 · ms−1) to zero while keeping all other parameters unchanged, as shown in Fig. 3 B. It can be seen that ATP consumption in the seven-week KO model stayed consistently higher than that in the FF and four-week KO models. Because the higher ATP consumption by NKA in the seven-week model was due to an elevated [Na+]i, we then compared the various Na+ fluxes in all three models.
Sodium homeostasis
As shown in Fig. 3 C, the simulated integrals over each cardiac cycle of Na+ influx through NCX and NHE increased by 11.1 and 47.3 μmol/L, respectively, between the four-week and seven-week time points. Therefore, almost 80% of the increase in Na+ influx in the seven-week KO was due to increased Na+ flux through NHE, activated by intracellular acidosis. In our model, the extent of acidosis was determined by the magnitude of the intracellular acid source term (Jacid), which in HF may be associated with lactic acid production from anaerobic metabolism due to a compromised metabolic state (17). To examine the effects of Jacid on Na+ homeostasis, a range of Jacid magnitudes were introduced in all three models, as shown in Fig. 3 D. For a given level of Jacid, [Na+]i in the seven-week KO remained ∼2 mmol/L higher than the FF and four-week KO values due to NCX upregulation and a reduced maximum NKA activity, indicating a reduced capacity of the seven-week KO to maintain a physiological [Na+]i in response to metabolic imbalance.
Effects of compensatory changes on ATP consumption
To examine whether a decrease in ATP production or an increase in demand contributed to acidosis in the seven-week KO, we investigated the changes in ATP consumption in the four-week and seven-week KO models as a result of adaptations in response to changes in SERCA activity. For both models, Vup was varied between 0 and 120% of the four-week value (0.148 μmol·L−1·ms−1) without metabolic imbalance, i.e., Jacid set to zero, to assess changes in ATP demand due to adaptive changes alone. For a given Vup, an adaptive change in maximum NCX or PMCA activity was introduced such that simulated diastolic [Ca2+]i remained unchanged, assuming that diastolic [Ca2+]i drives compensatory mechanisms (4). Specifically, a decrease in Vup would lead to an elevated diastolic [Ca2+]i without compensatory changes. By upregulating NCX or PMCA, diastolic [Ca2+]i could be maintained, although at a cost of a lower systolic [Ca2+]i. Furthermore, PMCA upregulation led to additional H+ influx that would be extruded via NHE in exchange for Na+. Therefore, both compensatory mechanisms directly or indirectly cause an increased Na+ influx, Na+ elevation, and thus, increased ATP consumption by NKA.
Fig. 4, A and B, shows ATP consumption as a function of Vup for the four-week and seven-week KO models, respectively, with NCX adaptation. In both cases, decreasing Vup resulted in an increase in ATP consumption by NKA, and a decrease in consumption by SERCA; relatively little change occurred for PMCA. The corresponding rates of change in ATP consumption are plotted in Fig. 4, C and D, for the four-week and seven-week time points, respectively. The rate of change in ATP consumption at a given Vup was calculated as the change in ATP consumption as Vup was decreased from its previous value to the value indicated in this article, normalized to the magnitude of reduction in Vup. Therefore, a positive value indicates a decrease in ATP consumption with decreasing Vup, whereas a negative value indicates the opposite trend. This analysis demonstrated that for both models, the rate of decrease in ATP consumption by SERCA was initially faster than the rate of increase for NKA, thus leading to an initial overall decrease in ATP consumption. As Vup continued to decrease (Vup < 0.035 μmol·L−1·ms−1 in the four-week KO model and <0.07 μmol·L−1·ms−1 in the seven-week KO model), the rate of increase in ATP consumption by NKA became increasingly faster, exceeding the rate of decrease for SERCA, and overall ATP consumption started to increase. The dotted lines on Fig. 4 indicate the experimentally observed Vup levels.
Figure 4.
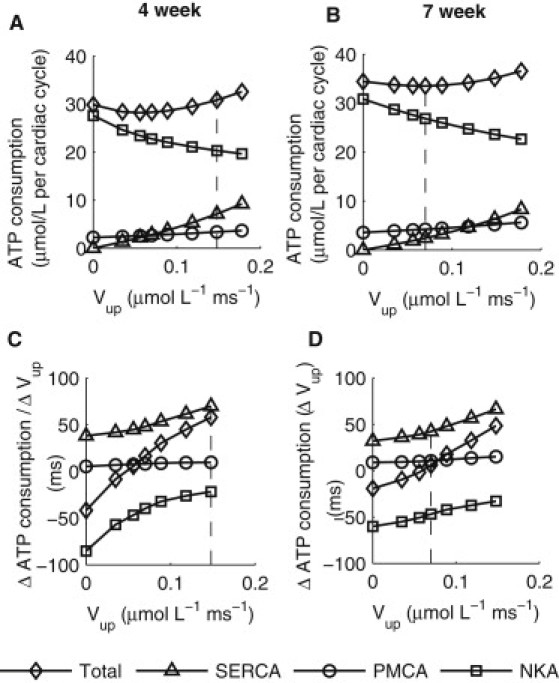
Effects of NCX adaptation to maintain constant diastolic [Ca2+]i on ATP consumption as a function of Vup. (A) ATP consumption per cardiac cycle by SERCA, PMCA, and NKA, and total consumption in the four-week KO model. (B) ATP consumption per cardiac cycle by SERCA, PMCA, and NKA and total consumption in the seven-week KO model. (C) The rates of change in ATP consumption by different processes plotted in panel A. See text for details. (D) The rates of change in ATP consumption by different processes plotted in panel B.
In the case of PMCA adaptation, as shown in Fig. 5, at four weeks ATP consumption decreased with decreasing SERCA activity, because the rate of decrease in ATP consumption by SERCA was greater than the combined rate of increases in consumption by PMCA and NKA, except at very low Vup levels (Vup < 0.035 μmol·L−1·ms−1). At seven weeks, however, ATP consumption increased monotonically with decreasing SERCA activity, because the combined rate of increases in ATP consumption by NKA and PMCA were greater than the rate of decrease in consumption by SERCA.
Figure 5.
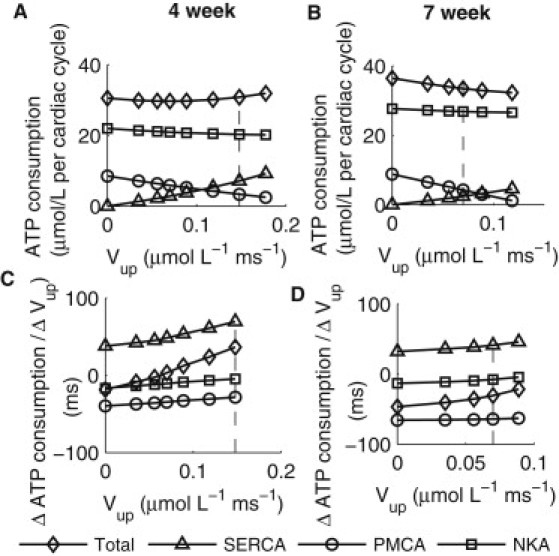
Effects of PMCA adaptation to maintain constant diastolic [Ca2+]i on ATP consumption as a function of Vup. (A) ATP consumption per cardiac cycle by SERCA, PMCA, and NKA, and total consumption in the four-week KO model. (B) ATP consumption per cardiac cycle by SERCA, PMCA, and NKA and total consumption in the seven-week KO model. (C) The rates of change in ATP consumption by different processes plotted in panel A. See text for details. (D) The rates of change in ATP consumption by different processes plotted in panel B.
Discussion
Decreased SERCA function and increased NCX function have been frequently demonstrated in studies of HF in both human and animal models. In this study, we have focused on identifying the transition into the diseased state and quantifying the interaction among early compensatory mechanisms, metabolism, and final development of HF. To provide a biophysically based framework for this analysis, we have developed our murine cardiac electrophysiology model framework, which has been fitted and validated using experimental data from the FF, four-week, and seven-week KO cardiomyocytes across a range of experimental protocols. The models were then used to quantitatively investigate changes in Na+ and Ca2+ homeostasis after gene deletion and the impact of these changes on ATP consumption for ion transport. Through this analysis, we identified the transition point from a compensated state at the four-week time point to a decompensated state at the seven-week time point, which may be key to the eventual development of HF in these animals.
It is important to note the limitations with our analysis. The model framework presented in this study did not include mitochondrial energetics, although integrated models of cardiac mitochondrial bioenergetics and Ca2+ handling have been published previously for guinea-pig ventricular myocytes (18,19). The integration of this additional component into the existing framework would add substantial complexity to the model while, to our knowledge, only limited experimental murine data exist for validation. Therefore, given the data-driven approach adopted for the parameterization of other model components, this component was not taken into account. To be consistent with the conditions used for all the other experimental measurements, the acidification of the seven-week KO cardiomyocytes was measured using a HEPES buffer. This does mean that bicarbonate exchange through the Na+HCO−3 cotransporter and the anion exchange were not accounted for. However, as the models were consistent with experimental data in terms of both experimental setup and observations, the simulation results still provide a reliable interpretation of the data under the specific experimental protocols outlined above. The magnitude of simulated Jleak in the FF model was ∼5 μM/s, which is of the same order of magnitude to the values reported by Shannon et al. (20) (12 μM/ms) and Santiago et al. (21) (7 μM/ms), although significantly greater than that reported by Shannon et al. (22) in an earlier study (0.3 μM/ms). The differences in the experimentally measured Jleak values could be due to variations in experimental conditions such as SR Ca2+ content. We have not included SERCA backflux in the model, as there was not sufficient experimental data from the animals for parameterization of this flux.
In the FF model, the addition of the reverse flux would lead to a decrease in the calculated ATP consumption for ion transport. In the seven-week KO model, the dramatic reduction in SERCA activity and SR Ca2+ content would both result in a much smaller magnitude of reverse flux, and hence a minimal reduction in the calculated ATP consumption. Therefore, the overall trend that total ATP consumption for ion transport is greater in the seven-week KO compared to the FF is highly likely to remain valid even if reverse mode function is present. Intracellular Ca2+ buffering was assumed unchanged. The validity of this assumption has been previously investigated in the study of four-week KO (4). As part of the validation, we compared the Ca2+ dynamics at 6 Hz between the model and experimental measurements in the FF mouse. The predicted changes in the [Ca2+]i transient were close to those measured experimentally. However, the model did not include CaMKII activity, which is known to increase with pacing frequency. The effects of CAMKII are not included in our model because they do not play a significant role at the pacing frequency of 1 Hz. However, the inclusion of these effects may improve the ability of the model to capture Ca2+ dynamics at higher pacing frequencies.
Finally, it is important to note that the central role of NHE in producing the measured increase in intracellular sodium was highlighted during a model validation process that revealed that NKA downregulation alone could only explain part of the increase in intracellular sodium. The study conclusions rest on the assumption that NHE function is maintained or elevated in the KO mice. Although we have not measured NHE flux directly, we expect NHE function to be at least maintained in the seven-week KO mice. This assumption is consistent with the observed acidosis and elevated [Na+]i and also with previous results where NHE has also been shown to be maintained (23) or elevated (24,25) in HF, and inhibiting NHE causes a sustained decrease in elevated [Na+]i (25). Subsequent studies will perform the necessary detailed measurements of pH buffering capacity and NHE function during ammonium prepulse required to characterize the pH dependence of NHE flux in these cells, confirming the assumption that is central to our analysis.
Effects of compensatory mechanisms on the [Ca2+]i transient
During parameterization, the maximum uptake rate of SERCA was found to be further decreased from 40% of the FF value at the four-week time point to 20% at the seven-week time point, whereas transsarcolemmal Ca2+ fluxes were found to be moderately increased at the four-week time point and significantly further upregulated at seven weeks. At the four-week time point these compensatory increases may have been sufficient to maintain both diastolic and systolic [Ca2+]i at physiologically tolerable levels, but further upregulation of NCX and PMCA to the levels seen in the seven-week KO maintains diastolic [Ca2+]i but more severely compromises systolic [Ca2+]i, thereby contributing to the progression to systolic HF.
Experimental measurements revealed that, in the seven-week KO, the maximum activity of NKA was found to be decreased by ∼10% and 40% for the α1 and α2 isoforms, respectively. NKA downregulation is thought to increase cardiac contractility by elevating [Na+]i, which in turn decreases Ca2+ extrusion through NCX and enhances SR Ca loading (26,27). Simulation results from our model (see Fig. S10 in the Supporting Material) showed that moderate reductions in NKA activity enhanced peak [Ca2+]i and the size of the [Ca2+]i transient in the FF model. However, the same level of reduction in NKA activity in the seven-week KO model resulted in a greater increase in [Na+]i and diastolic [Ca2+]i, as well as a much smaller increase in Δ[Ca2+]i—all of which are likely to have detrimental effects on diastolic function.
ATP consumption in the FF, four-week, and seven-week KO
Simulation results in Fig. 3, C and D, suggested that ATP consumption for ion transport per cardiac cycle was decreased at the four-week time point compared to the FF, due to decreased consumption by SERCA as both maximum uptake rate of SERCA and the size of the [Ca2+]i transient were dramatically decreased. However, at the seven-week time point, despite further reduction in ATP consumption by SERCA, total consumption increased. This was due to dramatically increased ATP consumption by NKA resulting from a twofold increase in total Na+ influx. Such an increase in Na+ influx was due to increased influx through NCX and NHE, with NHE contributing to 80% of the total increase.
Effects of adaptations on ATP consumption
The simulation results shown in Fig. 4 demonstrate that increased ATP demand may play a role in triggering intracellular acidosis in the seven-week KO. In the four-week KO model with a physiological pHi level, diastolic [Ca2+]i may be maintained by compensatory NCX upregulation, without incurring additional metabolic cost, as long as Vup for SERCA was >10% of the FF value. As presented above, this was because the combined rate of decrease in ATP consumption by SERCA and PMCA was greater than the rate of increase in consumption by NKA. The aforementioned minimum threshold was well below the experimentally observed SERCA activity in the four-week KO. As Vup fell below this minimum, ATP consumption increased with decreasing SERCA function, because the rate of increase in ATP consumption by NKA became greater than the combined rate of decrease in consumption by SERCA and PMCA. The parabolic shape in the relationship between ATP consumption and Vup suggested there may be a critical SERCA level, above which effective compensatory changes without a net metabolic cost are permitted. A qualitatively similar trend was observed in the seven-week model, although at this time point the experimentally observed SERCA activity was at the minimum (corresponding to 20% of FF value) of the aforementioned parabola and further decreases in SERCA level led to increased overall ATP consumption. This indicated differential effects of NCX upregulation on ATP consumption in the four-week and seven-week KO models. As a result, a decrease in SERCA activity was associated with decreasing ATP consumption at the early stage of SERCA KO and then increasing ATP consumption with further SERCA loss.
The above analysis was carried out with Jacid set to zero to assess the effects of NCX or PMCA upregulation alone. In the presence of further metabolic imbalance as observed experimentally in the seven-week KO, the increase in ATP demand would inevitably result in an even greater burden on metabolic response. Several other studies have also suggested the role of Na+ homeostasis in the regulation of mitochondrial function (28–30). Specifically, an elevated [Na+]i has been shown to blunt mitochondrial Ca2+ uptake by activating mitochondrial Na+/Ca2+ exchanger (28,30). Compromised Ca2+ accumulation in turn has been associated with net oxidation of NADH during increased work (28), and thus impaired the process of matching energy supply and demand (29).
A summary of our experimental observations and modeling results are presented in Fig. 6 as a consistent framework that, while speculative, links ionic homeostasis with cardiac energetic and pH, for describing the mechanisms that underpin our results. Experimentally we have observed an increase in [Na+]i, a sustained decrease in pHi, decreased intracellular Ca2+ cycling, and an increase in transmembrane Ca2+ transport. Our modeling study predict that these changes result in an increased NHE flux, increased NKA current, and an increase in energy cost for maintaining ionic homeostasis at the seven-week time point. To estimate how changes in ionic homeostasis energy consumption may affect cardiac efficiency, we have used the pressure volume area relationship to approximate the total energy consumption of the hearts at each time point (see the Supporting Material). By calculating the fraction of the energy used for ion transport, we can estimate changes in cardiac efficiency, with the caveat that these calculations do not account for any other changes in basal metabolism, changes in efficiency due to metabolic substrates, or efficiency of the sarcomere. Using this metric, we see very little change in efficiency at the four-week time point, but we do see a decrease at seven weeks. The decrease in efficiency at seven weeks is predicted by the model to be due to the increased cost of ionic homeostasis in the presence of metabolites, oxygen, and elevated NHE flux. This predicted change in efficiency is consistent with the NHE-dependent decrease in efficiency observed during reperfusion experiments (31,32), which was attributed to the energetic requirements to maintain ionic homeostasis, even in a well-oxygenated environment. Interestingly, this reperfusion-related drop in efficiency is also dependent on glycolysis.
Figure 6.
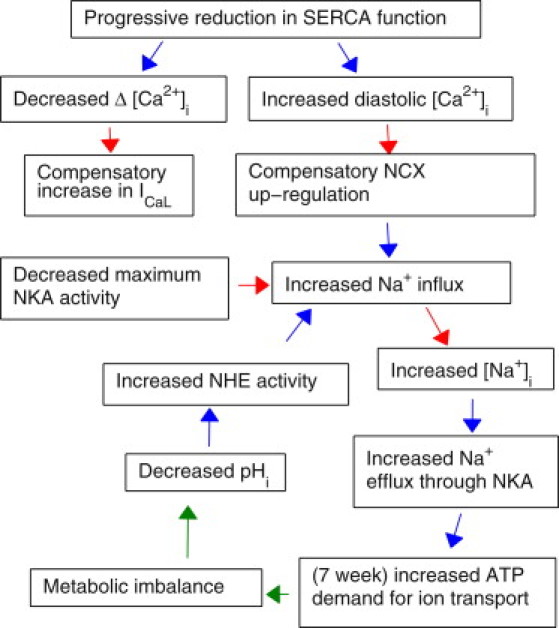
Proposed implications for decreased SERCA function on cardiac metabolism and sodium function. (Red) Experimental observations; (blue) modeling conclusions; (green) proposed mechanisms.
At the seven-week time point, our simulations predict that the fluxes through NKA and PMCA are elevated (despite NKA downregulation), significantly increasing the consumption of ATP by membrane-bound proteins, which will be supplied principally through glycolysis (33). Unlike β- or oxidative phosphorylation, glycolysis does not act as a net consumer of protons in the conversion of ADP to ATP (34). This means that, for ATP consumed within the cell that is replenished via glycolysis, there is a net production of protons (34,35). This increase in protons, associated with increased glycolysis, provides a plausible but as-yet unsubstantiated unifying mechanism to explain the sustained decrease in pHi and increased NKA and PMCA flux at the seven-week time point. If this mechanism is confirmed, any subsequent increases in NKA or PMCA flux due to further compensatory adaptations would then further increase glycolysis, resulting in increased proton production that, in turn, will drive the downward spiral proposed in Fig. 6.
Therefore, we postulate that in the seven-week KO, a reinforcing cycle may underlie the eventual development into HF. As shown in Fig. 6, adaptive increases in NCX function lead to [Na+]i elevation and increased ATP demand by NKA. Metabolic imbalance resulting in anaerobic metabolism in turn leads to proton production, thus enhancing NHE activity and hence further Na+ influx. Increased Na+ influx must be balanced by increased Na+ efflux through NKA, thereby leading to an even greater ATP consumption and further exacerbation of metabolic imbalance. One of the important links in this cycle is between metabolic imbalance and intracellular acidosis. As we have not been able to identify the exact mechanisms behind the observed acidosis, the above assumption requires further investigation. Although not within the scope of this study, a comprehensive metabolic measurement in the cardiomyocytes would help confirm our hypothesis.
In the case of PMCA adaptation, as shown in Fig. 5, ATP consumption decreased with decreasing SERCA activity at four weeks but increased at seven weeks. It can thus be reasoned that PMCA adaptation alone may initially be a feasible compensatory mechanism, but later becomes detrimental in any cells that were already metabolically compromised.
Conclusions
In this simulation study, we have found that with reduction in SERCA activity to <20% of its normal level, a critical point may have passed and the ATP demand for sustaining NCX upregulation may increase with decreasing SERCA. We showed that in the seven-week KO model, the rate of increase in ATP consumption by NKA for the extrusion of the additional Na+ brought-in through upregulated NCX eventually surpasses the rate of decrease in ATP consumption by SERCA and PMCA, thus leading to an overall increase in ATP consumption. In the event of intracellular acidosis and hence metabolic imbalance, this could play a role in the development of HF in the seven-week KO by initiating a reinforcing cycle involving Na+ accumulation, a mismatch between ATP demand and supply, an increasingly compromised metabolism, a decreased pHi, and finally an even greater [Na+]i elevation.
Acknowledgments
The authors acknowledge Pawel Swietach for insightful discussions.
L.L. thanks the Oxford University Clarendon Fund. S.A.N. and N.P.S. thank the United Kingdom Biotechnology and Biological Sciences Research Council grant (No. BB/F01080X/1), the Medical Research Council, and the Engineering and Physical Sciences Research Council. W.E.L., J.M.A., G.C., and O.M.S. thank Anders Jahre's Fund for the Promotion of Science, the Research Council of Norway, South-Eastern Norway Regional Health Authority, and Oslo University Hospital.
Supporting Material
References
- 1.Bers D.M., Eisner D.A., Valdivia H.H. Sarcoplasmic reticulum Ca2+ and heart failure: roles of diastolic leak and Ca2+ transport. Circ. Res. 2003;93:487–490. doi: 10.1161/01.RES.0000091871.54907.6B. [DOI] [PubMed] [Google Scholar]
- 2.Pieske B., Maier L.S., Hasenfuss G. Ca2+ handling and sarcoplasmic reticulum Ca2+ content in isolated failing and nonfailing human myocardium. Circ. Res. 1999;85:38–46. doi: 10.1161/01.res.85.1.38. [DOI] [PubMed] [Google Scholar]
- 3.Schmidt U., Hajjar R.J., Gwathmey J.K. Contribution of abnormal sarcoplasmic reticulum ATPase activity to systolic and diastolic dysfunction in human heart failure. J. Mol. Cell. Cardiol. 1998;30:1929–1937. doi: 10.1006/jmcc.1998.0748. [DOI] [PubMed] [Google Scholar]
- 4.Li L., Louch W.E., Smith N.P. Calcium dynamics in the ventricular myocytes of SERCA2 KO mice: a modeling study. Biophys. J. 2010;100:322–331. doi: 10.1016/j.bpj.2010.11.048. [DOI] [PMC free article] [PubMed] [Google Scholar]
- 5.Andersson K.B., Birkeland J.A.K., Christensen G. Moderate heart dysfunction in mice with inducible cardiomyocyte-specific excision of the Serca2 gene. J. Mol. Cell. Cardiol. 2009;47:180–187. doi: 10.1016/j.yjmcc.2009.03.013. [DOI] [PubMed] [Google Scholar]
- 6.Andersson K.B., Finsen A.V., Christensen G. Mice carrying a conditional Serca2flox allele for the generation of Ca2+ handling-deficient mouse models. Cell Calcium. 2009;46:219–225. doi: 10.1016/j.ceca.2009.07.004. [DOI] [PMC free article] [PubMed] [Google Scholar]
- 7.Andersson K.B., Winer L.H., Jaisser F. Tamoxifen administration routes and dosage for inducible Cre-mediated gene disruption in mouse hearts. Transgenic Res. 2009;19:715–725. doi: 10.1007/s11248-009-9342-4. [DOI] [PubMed] [Google Scholar]
- 8.Louch W.E., Hougen K., Sejersted O.M. Sodium accumulation promotes diastolic dysfunction in end-stage heart failure following Serca2 knockout. J. Physiol. 2010;588:465–478. doi: 10.1113/jphysiol.2009.183517. [DOI] [PMC free article] [PubMed] [Google Scholar]
- 9.Louch W.E., Hake J., Sejersted O.M. Control of Ca2+ release by action potential configuration in normal and failing murine cardiomyocytes. Biophys. J. 2010;99:1377–1386. doi: 10.1016/j.bpj.2010.06.055. [DOI] [PMC free article] [PubMed] [Google Scholar]
- 10.Mørk H.K., Sjaastad I., Louch W.E. Increased cardiomyocyte function and Ca2+ transients in mice during early congestive heart failure. J. Mol. Cell. Cardiol. 2007;43:177–186. doi: 10.1016/j.yjmcc.2007.05.004. [DOI] [PubMed] [Google Scholar]
- 11.Mørk H.K., Sjaastad I., Louch W.E. Slowing of cardiomyocyte Ca2+ release and contraction during heart failure progression in postinfarction mice. Am. J. Physiol. Heart Circ. Physiol. 2009;296:H1069–H1079. doi: 10.1152/ajpheart.01009.2008. [DOI] [PubMed] [Google Scholar]
- 12.Swift F., Tovsrud N., Sejersted O.M. The Na+/K+-ATPase α2-isoform regulates cardiac contractility in rat cardiomyocytes. Cardiovasc. Res. 2007;75:109–117. doi: 10.1016/j.cardiores.2007.03.017. [DOI] [PubMed] [Google Scholar]
- 13.Shannon T.R., Wang F., Bers D.M. A mathematical treatment of integrated Ca dynamics within the ventricular myocyte. Biophys. J. 2004;87:3351–3371. doi: 10.1529/biophysj.104.047449. [DOI] [PMC free article] [PubMed] [Google Scholar]
- 14.Niederer S.A., Smith N.P. A mathematical model of the slow force response to stretch in rat ventricular myocytes. Biophys. J. 2007;92:4030–4044. doi: 10.1529/biophysj.106.095463. [DOI] [PMC free article] [PubMed] [Google Scholar]
- 15.Allen D.G., Morris P.G., Pirolo J.S. A nuclear magnetic resonance study of metabolism in the ferret heart during hypoxia and inhibition of glycolysis. J. Physiol. 1985;361:185–204. doi: 10.1113/jphysiol.1985.sp015640. [DOI] [PMC free article] [PubMed] [Google Scholar]
- 16.Vaughan-Jones R.D., Spitzer K.W., Swietach P. Intracellular pH regulation in heart. J. Mol. Cell. Cardiol. 2009;46:318–331. doi: 10.1016/j.yjmcc.2008.10.024. [DOI] [PubMed] [Google Scholar]
- 17.Agnetti G., Kaludercic N., Van Eyk J.E. Modulation of mitochondrial proteome and improved mitochondrial function by biventricular pacing of dyssynchronous failing hearts. Circ. Cardiovasc. Genet. 2010;3:78–87. doi: 10.1161/CIRCGENETICS.109.871236. [DOI] [PMC free article] [PubMed] [Google Scholar]
- 18.Cortassa S., Aon M.A., O'Rourke B. An integrated model of cardiac mitochondrial energy metabolism and calcium dynamics. Biophys. J. 2003;84:2734–2755. doi: 10.1016/S0006-3495(03)75079-6. [DOI] [PMC free article] [PubMed] [Google Scholar]
- 19.Cortassa S., Aon M.A., Winslow R.L. A computational model integrating electrophysiology, contraction, and mitochondrial bioenergetics in the ventricular myocyte. Biophys. J. 2006;91:1564–1589. doi: 10.1529/biophysj.105.076174. [DOI] [PMC free article] [PubMed] [Google Scholar]
- 20.Shannon T.R., Ginsburg K.S., Bers D.M. Quantitative assessment of the SR Ca2+ leak-load relationship. Circ. Res. 2002;91:594–600. doi: 10.1161/01.res.0000036914.12686.28. [DOI] [PubMed] [Google Scholar]
- 21.Santiago D.J., Curran J.W., Shannon T.R. Ca sparks do not explain all ryanodine receptor-mediated SR Ca leaks in mouse ventricular myocytes. Biophys. J. 2010;98:2111–2120. doi: 10.1016/j.bpj.2010.01.042. [DOI] [PMC free article] [PubMed] [Google Scholar]
- 22.Shannon T.R., Ginsburg K.S., Bers D.M. Reverse mode of the sarcoplasmic reticulum calcium pump and load-dependent cytosolic calcium decline in voltage-clamped cardiac ventricular myocytes. Biophys. J. 2000;78:322–333. doi: 10.1016/S0006-3495(00)76595-7. [DOI] [PMC free article] [PubMed] [Google Scholar]
- 23.Despa S., Islam M.A., Bers D.M. Intracellular Na+ concentration is elevated in heart failure but Na/K pump function is unchanged. Circulation. 2002;105:2543–2548. doi: 10.1161/01.cir.0000016701.85760.97. [DOI] [PubMed] [Google Scholar]
- 24.Yokoyama H., Gunasegaram S., Avkiran M. Sarcolemmal Na+/H+ exchanger activity and expression in human ventricular myocardium. J. Am. Cell. Cardiol. 2000;36:534–540. doi: 10.1016/s0735-1097(00)00730-0. [DOI] [PubMed] [Google Scholar]
- 25.Baartscheer A., Schumacher C.A., Fiolet J.W. Increased Na+/H+-exchange activity is the cause of increased [Na+]i and underlies disturbed calcium handling in the rabbit pressure and volume overload heart failure model. Cardiovasc. Res. 2003;57:1015–1024. doi: 10.1016/s0008-6363(02)00809-x. [DOI] [PubMed] [Google Scholar]
- 26.Bers D.M., Barry W.H., Despa S. Intracellular Na+ regulation in cardiac myocytes. Cardiovasc. Res. 2003;57:897–912. doi: 10.1016/s0008-6363(02)00656-9. [DOI] [PubMed] [Google Scholar]
- 27.Verdonck F., Volders P.G.A., Sipido K.R. Intracellular Na+ and altered Na+ transport mechanisms in cardiac hypertrophy and failure. J. Mol. Cell. Cardiol. 2003;35:5–25. doi: 10.1016/s0022-2828(02)00280-8. [DOI] [PubMed] [Google Scholar]
- 28.Liu T., Brown D.A., O'Rourke B. Role of mitochondrial dysfunction in cardiac glycoside toxicity. J. Mol. Cell. Cardiol. 2010;49:728–736. doi: 10.1016/j.yjmcc.2010.06.012. [DOI] [PMC free article] [PubMed] [Google Scholar]
- 29.Maack C., O'Rourke B. Excitation-contraction coupling and mitochondrial energetics. Basic Res. Cardiol. 2007;102:369–392. doi: 10.1007/s00395-007-0666-z. [DOI] [PMC free article] [PubMed] [Google Scholar]
- 30.Pradhan R.K., Beard D.A., Dash R.K. A biophysically based mathematical model for the kinetics of mitochondrial Na+-Ca2+ antiporter. Biophys. J. 2010;98:218–230. doi: 10.1016/j.bpj.2009.10.005. [DOI] [PMC free article] [PubMed] [Google Scholar]
- 31.Hata K., Takasago T., Goto Y. Stunned myocardium after rapid correction of acidosis. Increased oxygen cost of contractility and the role of the Na+-H+ exchange system. Circ. Res. 1994;74:794–805. doi: 10.1161/01.res.74.5.794. [DOI] [PubMed] [Google Scholar]
- 32.Liu B., Clanachan A.S., Lopaschuk G.D. Cardiac efficiency is improved after ischemia by altering both the source and fate of protons. Circ. Res. 1996;79:940–948. doi: 10.1161/01.res.79.5.940. [DOI] [PubMed] [Google Scholar]
- 33.Dhar-Chowdhury P., Malester B., Coetzee W.A. The regulation of ion channels and transporters by glycolytically derived ATP. Cell. Mol. Life Sci. 2007;64:3069–3083. doi: 10.1007/s00018-007-7332-3. [DOI] [PMC free article] [PubMed] [Google Scholar]
- 34.Dennis S.C., Gevers W., Opie L.H. Protons in ischemia: where do they come from; where do they go to? J. Mol. Cell. Cardiol. 1991;23:1077–1086. doi: 10.1016/0022-2828(91)91642-5. [DOI] [PubMed] [Google Scholar]
- 35.Gevers W. Generation of protons by metabolic processes in heart cells. J. Mol. Cell. Cardiol. 1977;9:867–874. doi: 10.1016/s0022-2828(77)80008-4. [DOI] [PubMed] [Google Scholar]
Associated Data
This section collects any data citations, data availability statements, or supplementary materials included in this article.