

Abstract
Changes of membrane organization upon cross-linking of its components trigger cell signaling response to various exogenous factors. Cross-linking of raft gangliosides GM1 with cholera toxin (CTxB) was shown to cause microscopic phase separation in model membranes, and the CTxB-GM1 complexes forming a minimal lipid raft unit are the subject of ongoing cell membrane research. Yet, those subdiffraction sized rafts have never been described in terms of size and dynamics. By means of two-color z-scan fluorescence correlation spectroscopy, we show that the nanosized domains are formed in model membranes at lower sphingomyelin (Sph) content than needed for the large-scale phase separation and that the CTxB-GM1 complexes are confined in the domains poorly stabilized with Sph. Förster resonance energy transfer together with Monte Carlo modeling of the donor decay response reveal the domain radius of ∼8 nm, which increases at higher Sph content. We observed two types of domains behaving differently, which suggests a dual role of the cross-linker: first, local transient condensation of the GM1 molecules compensating for a lack of Sph and second, coalescence of existing nanodomains ending in large-scale phase separation.
Introduction
Plasma membrane serves as an interface between exogenous signal and cellular function. Molecular organization of the membrane landscape, such as clustering of its components, therefore plays a crucial role in the variety of membrane-associated processes. In particular, ligand-induced clustering has been related to various aspects of plasma membrane, such as signaling of immune receptors (1,2). Similarly, cross-linker-induced patching of membrane components induced signaling in cells (3–5). In addition, it was shown to affect partitioning of saturated phospholipid analogs between different lipid phases (6) and to promote large-scale phase separation accompanied with spatial redistribution of transmembrane peptides in model membranes (7). It has not been proven so far if formation of cross-linker-induced nanoscaled domains along the trajectory heading from a liquid-disordered (Ld) to liquid-ordered (Lo) phase in a phase diagram precedes the large-scale phase separation.
Direct observation of nanoscaled heterogeneities in plasma membrane by means of optical microscopy fails either due to its poor resolution or anticipated transient character of rafts. Cholera toxin β (CTxB)-induced nanosized clusters in membranes of mildly fixed resting cells have been visualized by means of near-field scanning optical microscopy (8). Its resolution depends on the size of the used subwavelength aperture, which is typically around 80 nm. The study evidences structural connectivity between raft-associating proteins and the clusters that are established even though direct redistribution of the proteins to the clusters does not occur, concluding that the resting plasma membrane is prealigned toward large-scale coalescence upon cell activation.
In living cells, dynamic characterization of lipid rafts has been achieved by the combination of fluorescence fluctuation analysis and stimulated emission depletion (STED) microscopy. Dependence of mean transition time through the STED focal area on its size reveals transient trapping of raft integrating lipids and glycosylphosphatidylinositol-anchored proteins in molecular clusters. Authors deduce that the trapped molecules dwell within areas with <20 nm diameter (9).
Cross-linking of gangliosides GM1 by its pentavalent ligand CTxB was addressed in a vast amount of studies. It has been shown that clustering of GM1 via CTxB induces microscopic Lo and Ld phase separation both in giant unilamellar vesicles (GUVs) formed by lipid mixtures consisting of dioleoylphosphatidylcholine (DOPC), sphingomyelin (Sph), and cholesterol in a certain ratio (7) and in plasma membrane spheres (10).
In agreement with commonly observed cholesterol and Sph importance for lipid raft formation (11), the cholesterol dependence of CTxB-induced clustering was demonstrated in cell membranes (8) and the Sph requirement for CTxB triggered large-scale phase separation was evidenced in the model membranes (7). These findings suggest that the cross-linker will have the greatest impact if the lipid composition approaches the phase separation boundary, most probably close to the single Ld phase as indicated by the work of de Almeida et al. (12).
In this work, we aimed to investigate early stages of the cross-linking-induced phase separation, i.e., formation, size, and dynamic properties of nanodomains in dioleoylphosphatidylcholine (DOPC)/Sph/cholesterol mixtures containing a small percentage of GM1 upon their pentamerization with CTxB. By means of z-scan fluorescence correlation spectroscopy (FCS) (13) and simulations published by Wawrezinieck et al. (14), the distribution coefficient of CTxB between the two phases and the residential time within the nanodomains are estimated. Size of the nanodomains is determined by Förster resonance energy transfer (FRET) from donor-labeled CTxB to an acceptor, a lipid tracer preferentially segregating to the Ld phase, and Monte Carlo (MC) modeling of the measured data. We demonstrate the existence of two types of nanodomains differing in size and ability to confine CTxB-GM1 complexes.
Experimental Section
DOPC, porcine brain Sph, cholesterol, 1,2-dioleoyl-sn-glycero-3-phosphoglycerol (DOPG), GM1, and 1,2-dipalmitoyl-sn-glycero-3-phosphoethanolamine-N-(cap biotinyl) (Biotinyl Cap PE) were purchased from Avanti Polar Lipids (Alabaster, AL). Bodipy FL DHPE, DiIC18 (5)-DS (DiD), Alexa Fluor 488- and Alexa Fluor 647-labeled CTxB (CTxB-488, CTxB-647) were purchased from Invitrogen (Carlsbad, CA). Perylene, streptavidin, biotin-labeled bovine serum albumin (biotin-BSA), and CTxB were purchased from Sigma (St. Louis, MO).
GUV preparation
GUVs were prepared by a gentle hydration approach described elsewhere (15). 1 mL of lipid mixture in chloroform containing 1 mg of lipids was dried with a rotary evaporator and kept for an additional 2 h under vacuum. Thin lipid film was hydrated with 3 mL of prewarmed buffer (10 mM HEPES, 150 mM NaCl, 1 mM CaCl2, 0.1 M sucrose, pH = 7) saturated with nitrogen. The tube was then sealed, heated to 60°C, kept overnight at this temperature, and slowly cooled. White cloud containing liposomes was gently vortexed before further use. All the prepared lipid mixtures contained 5 mol % of DOPG, negatively charged lipid necessary for the given preparation technique and 4 mol % of biotinyl Cap PE necessary for attaching GUVs to BSA-biotin/streptavidin-coated glass. All the measurements on GUVs were performed in a FCS2 chamber (Bioptechs, Butler, PA). The chamber with a coated coverslip was filled with 200 μL of buffer solution (10 mM HEPES, 150 mM NaCl, 1 mM CaCl2, 0.1 M glucose, pH = 7), 20 μL of the solution containing GUVs was added and after 30 min when enough liposomes were attached to the coverslip, the chamber was carefully flushed with excess of the buffer solution.
FCS and fluorescence lifetime imaging microscopy-FRET measurements
Both types of measurements were performed on a MicroTime 200 inverted confocal microscope (PicoQuant, Berlin, Germany) with a water immersion objective (1.2 NA, 60×) (Olympus, Hamburg, Germany). Pulsed diode lasers (LDH-P-C-470, 470 nm, and LDH-D-C-635, 635 nm PicoQuant) with 10 MHz repetition rate each were used. The lasers were pulsing alternatively to avoid artifacts caused by signal bleed-through. The signal was split on two single photon avalanche diodes using 515/50 and 685/50 band pass filters (Chroma, Rockingham, VT) for the green and red channel, respectively. In the case of the FCS measurements, laser intensity at the back aperture of the objective was around 5 μW for each laser line. The z-scan was performed on the top of selected unilamellar liposomes. Membrane was first placed to the laser beam waist, and then moved 1.5 μm below the waist and consequently vertically scanned in 20 steps (150 nm spaced). At every position, a 60 s measurement was performed. Details of the data analysis are given in the Supporting Material. For the fluorescence lifetime imaging microscopy (FLIM)-FRET measurements, intensities of the lasers were chosen low enough to avoid a pile-up effect, i.e., around 1 μW for 470 nm and <0.1 μW for 635 nm. Each GUV was scanned in the cross section, an image of 512 × 512 pixels (0.6 ms/pixel) was acquired.
For z-scan FCS measurements, membrane was stained with Bodipy FL DHPE (BDP-DHPE) in label/lipid ratio 1:50000. CTxB-647 was stepwise added to the immobilized GUVs. 15 min after the portion of CTxB-647 was added, the FCS2 chamber was flushed with excess of a buffer and then several z-scans FCS experiments were performed. Portions of CTxB-647 were added in the following manner: 1), 10 μL (1 μg/mL), 2), 2 μL (20 μg/mL), 3), 4 μL (20 μg/mL). The final concentrations of the CTxB-647 in the FCS2 before final flushing were 1), 0.05 μg/mL, 2), 0.2 μg/mL, and 3), 0.4 μg/mL.
For the two-color cross correlation FCS experiments, 4 μL of both CTxB-488 and CTxB-647 (20 μg/mL) was added to the immobilized GUVs, which corresponds to 0.4 μg/mL in the final solution.
For FLIM- FRET measurements, membrane was stained with DiD (acceptor) in label/lipid ratio 1:100. 20 μL of CTxB-488 (1 μg/mL) was added to the GUVs (i.e., final concentration of CTxB in FCS2 was 0.1 μg/mL), after 15 min GUVs were flushed with buffer, FLIM images of selected liposomes were taken, 10 μL of nonlabeled CTxB (2 mg/mL) were added (i.e., 100 μg/mL in final solution – complete saturation), after 15 min flushed again, and FLIM images of the same liposomes were again acquired.
All measurements presented in this work were held at 24°C.
Results and Discussion
Cross-linker and lipid dynamics characterized by z-scan FCS
Because nanodomains are expected to form in the region close to the phase separation boundary, literature available phase diagrams were inspected (see Fig. 1). The solid curve in Fig. 1 stands for the phase separation boundary obtained from an electron spin resonance experiment performed by Smith et al. as well as the tie-lines (16). The dotted curve shows the boundary observed by Farkas et al. by means of diffraction limited optical microscopy (17). Both of the two boundary lines were acquired for systems similar to the one investigated here, however differing in details such as resolution of the used observation technique, presence of a charged lipid, and GM1 or type of Sph. We would like to point out that the literature facts shown here serve only as a qualitative basis for presentation of our own data, the precise position of the boundary line as well as the exact tie-line field are beyond the scope of this contribution.
Figure 1.
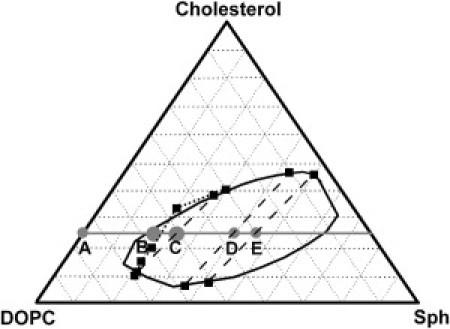
Ternary phase diagram for DOPC/Sph/Cholesterol lipid mixtures given in the literature: solid curve, tie-lines, and the dotted curve were published by Smith et al. (16) and Farkas et al. (17), respectively. The line connecting points A to E denotes constant cholesterol content. All measurements were done in marked points A to E corresponding to the lipid compositions given in Table 1.
In the system of our interest, GUVs created from a lipid mixture corresponding to the selected compositions (see Table 1) were prepared having been stained with Bodipy FL DHPE (BDP-DHPE) which preferentially resides in the Ld phase (18). Phase separation along the marked line, denoting constant content of cholesterol, was investigated. In the putative boundary region, the compositions B and partially C (see below) showed no optically resolvable phase separation. Of note, liposomes created for a given composition were not absolutely uniform, particularly in the composition C; some GUVs (minority of them) were already phase separated. To avoid ambiguity caused by the different phase states of particular GUVs at this composition, all measurements were held in the nonseparated GUVs at compositions A, B, and C (majority was nonseparated) and in the Ld phase of the separated GUVs in the remaining cases. It is a commonly observed phenomenon that individual lipids in GUVs are not evenly distributed. Thus, it is difficult to relate the observed behavior to the precise lipid composition. We experienced that in the composition C, the phase separated GUVs behaved fundamentally different (similar to the composition D) compared to those that were (optically) not separated yet. Therefore, we focused only on those nonseparated implying that their average lipid composition might have contained less Sph and/or cholesterol as claimed in the Table 1. Furthermore, we show that the chosen nonseparated GUVs are phase separated on the length scale that is beyond the optical resolution.
Table 1.
Molar fractions of lipids in GUV lipid compositions discussed in this work
| DOPC | Sph | Chol. | DOPG | GM1 | |
|---|---|---|---|---|---|
| A | 0.68 | 0 | 0.25 | 0.05 | 0.02 |
| B | 0.49 | 0.19 | 0.25 | 0.05 | 0.02 |
| C | 0.44 | 0.24 | 0.25 | 0.05 | 0.02 |
| D | 0.29 | 0.39 | 0.25 | 0.05 | 0.02 |
| E | 0.23 | 0.45 | 0.25 | 0.05 | 0.02 |
First, diffusion of BDP-DHPE was measured in the top membrane of several selected GUVs by means of z-scan FCS. The lateral diffusion coefficient for the BDP-DHPE did not significantly differ for all tested compositions giving values of around 7.1 ± 0.9 μm2.s−1 at 24°C.
Alexa Fluor 647-labeled CTxB (CTxB-647) was then added to the flow cell containing immobilized GUVs in portions so that the concentration of the cross-linker was stepwise increasing (see Material and Methods). After each addition, two-color z-scan FCS was simultaneously performed for CTxB-647 and BDP-DHPE (19). Diffusion of BDP-DHPE did not undergo any change upon CTxB-647 addition in all the investigated compositions.
The data obtained from the two-color z-scan FCS approach were evaluated in two different ways:
-
1.
The correlation curves corresponding to the situation when a membrane is located in the middle of the laser focus were fit with a model accounting for free two-dimensional diffusion (see the Supporting Material). The mean transition time τD, the average time a labeled molecule stays in the laser-illuminated area, served as a main readout parameter. The values of τD for individual lipid composition at various loads of the CTxB-647 are summarized in Table 2.
Table 2.
Mean transition times of CTxB-647 through the illuminated spot—the minimum value obtained when membrane was centered in the beam waist
| A | B – low load | B – medium load | B – high load | C – low load | C – medium load | C – high load | D | E | |
|---|---|---|---|---|---|---|---|---|---|
| τD/ms | 6.6 | 5.9 | 40.3 | 46.5 | 12.8 | 14.6 | 12.0 | 7.1 | 22.1 |
| Stdev/ms | 0.08 | 0.21 | 2.24 | 10.54 | 0.92 | 2.86 | 6.82 | 0.66 | 4.99 |
| n | 4 | 6 | 2 | 5 | 4 | 3 | 5 | 3 | 4 |
n gives number of z-scans acquired for the given composition.
Visually, the correlation curves for the investigated compositions are compared in Fig. 2.
-
2.
Because the two-color FCS measurements were performed in the z-scan manner, autocorrelation functions were measured at different positions of the model membrane with respect to the beam waist, i.e., fluctuations arising from illuminated areas differing in size were acquired. Dependence of mean transition time, the average time a molecule passes though the illuminated area, on the area size, provides information on the diffusion character of the fluorescent particles (14).
Figure 2.
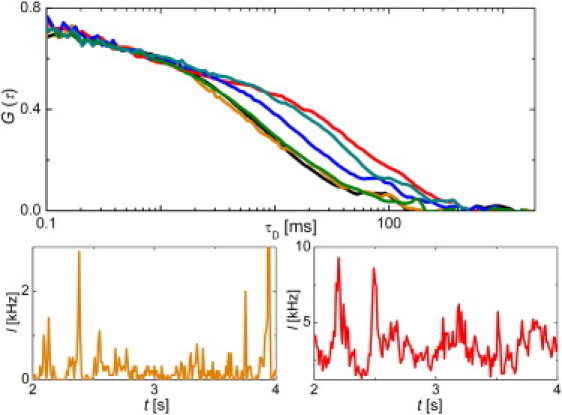
Upper part: autocorrelation curves for CTxB-647 in upper GUV membrane centered in the waist of the focal spot at different lipid compositions: A (black), B – low load of CTxB-647 (orange), B – high load of CTxB-647 (red), C (blue), D (olive), E (dark cyan). Lower part: intensity traces for CTxB-647 in B composed membranes at low (orange) and high (red) load of CTxB-647.
In Fig. 3, mean transition time is plotted versus relative size of the illuminated region, which shows a so-called apparent diffusion law (see the Supporting Material for details) for BDP-DHPE (Ld phase marker) and for CTxB-647 in differently composed GUVs.
Figure 3.
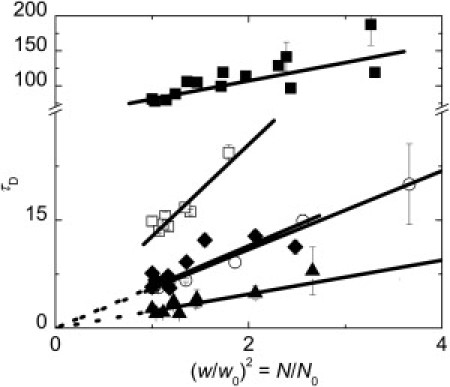
Apparent diffusion laws (dependence of the mean transition time through the illuminated spot on its relative size) obtained for diffusion of CTxB-647 in membranes composed of the lipid mixtures: A (open circles), B – low (diamonds), and high (solid squares) load of the cross-linker, and C (open squares). Diffusion law for BDP-DHPE (triangles) in B composed membrane at high cross-linker load is shown for comparison. Error bars represent standard errors of the mean. The dotted lines are guides for eyes, values of fitting parameters are given in Table S1.
Even though the z-scan FCS approach does not enable direct accessing of diffusion properties in the areas smaller than the diffraction limit, such as FCS combined with STED microscopy (9), or what zero-mode waveguides for nanometric apertures (20) can do, the slopes and the offsets of the depicted plots allow mapping of the apparent diffusion laws the molecules obey. Wawrezinieck et al. (14) have shown by means of kinetic MC simulations that the positive offset value can result from the formation of domains. The apparent diffusion law is described by a simple formula:
where τDapp stands for mean transition time, t0 is the temporal offset, ω is the beam waist radius, and Deff corresponds to the effective diffusion coefficient. According to the proposed model, a raft-associating molecule freely diffuses in the nondomain region with a diffusion coefficient Dfree, at the moment when it enters a domain its diffusion decreases and additionally, the molecule becomes confined in the domain for a certain time τconf. Following this assumption a time-based distribution coefficient α can be defined as a fraction of time a molecule spends in the domain region on average. This leads to the expression for Deff: (details are in the Supporting Material). The t0 value can be approximated by the following formula (14) .
The results obtained by the two mentioned data treatments reveal different dynamics of the molecules of interest in the investigated compositions:
Composition A is a Sph free lipid mixture that serves as a blank experiment. Diffusion behavior of the CTxB-647 is independent of its load and the apparent diffusion law (Fig. 3) suggests free diffusion both for the labeled lipid and cross-linker molecules.
Composition B lies in the phase boundary region. Although the optical microscopy does not give any evidence of the phase separation and the diffusion of the labeled lipid is similar to the value obtained in composition A, diffusion behavior of the labeled cross-linker significantly differs from the Sph free system. Diffusion behavior of CTxB-647 in B i), is dependent on its load (Fig. 2, Table 2), and ii), the apparent diffusion law (Fig. 3) for high loads shows a significant temporal offset suggesting that the molecular motion may be trapped due to putative confinement in domains.
When the cross-linker load exceeds a certain threshold, substantially prolonged fluctuations in fluorescence intensity appear (Fig. 2, lower part) and are translated to almost a sevenfold longer transition time. The long transition times can be either caused by massive aggregation of CTxB at the membrane surface, forming large, slowly diffusing protein clusters, or due to the tendency of locally condensed GM1 molecules to coalesce into nanodomains confining the cross-linker molecules.
To investigate whether the mutual cross-linker interactions or the interactions between lipid molecules rules the decreased diffusion, the following experiments were carried out: i), relative brightness (number of detected photons generated by a single molecule/cluster/s) of CTxB-647 was calculated for every concentration used. ii), Equimolar mixture of CTxB-647 and Alexa Fluor 488-labeled CTxB (CTxB-488) was applied for cross-linking of GM1 followed by a cross correlation FCS experiment. Although the relative molecular brightness of CTxB-647 increased from 2.2 ± 0.5 (low load) to 5.0 ± 1.7 (high load) kHz per particle, no detectable evidence of cross correlation between signals from the two dyes appeared (see Table S2 and Fig. S2). This suggests that CTxB-GM1 complexes were further associated, which is also supported by the FRET data (see below), however, motion and residing of the individual complexes in those assemblies is independent of one another, which indicates that it is, indeed, an interaction between lipids that drives the CTxB-GM1 complexes together.
Character of the diffusion represented by the diffusion law shown in Fig. 3 also changes at high load of the cross-linker. Analysis of the dependence of the diffusion time on the illuminated spot size according to the model proposed by Wawrezinieck et al. gives α of around 0.85, which is the time fraction when the motion of the cross-linker is trapped, the confinement time τconf was calculated to be around 30 ms.
Composition C still falls to the boundary region, because a majority of the GUVs do not show any phase separation. Upon adding CTxB-647, some GUVs become phase separated as described by Hammond et al. (7), however, there is a vast majority of liposomes where no separation is optically detectable.
Even though composition C is assumed to contain a higher amount of Sph compared to B, and thus slower diffusion in C than in B would be naturally anticipated, the observed behavior contradicted these expectations (the comparison between these two compositions was independently repeated three times with an identical result). In C, i), no concentration dependence of the CTxB-647 transition time was evidenced, ii), all obtained transition times were significantly shorter than in high-loaded composition B, however at the same time significantly longer than in A and low-loaded B, and iii), as displayed in Fig. 3, the temporal offset t0 in the apparent diffusion law is substantially smaller than in the case B (high load). Unfortunately, the t0 value obtained from the z-scan FCS is rather sensitive to the data quality and the level of photobleaching. The t0 value obtained for individual C composed GUVs oscillates in the range from 0 to 6 ms, which is clearly distinguishable from the composition B, but comparison with other compositions or drawing conclusions on the diffusion character would be too speculative.
Eventually, the composition C seems to have a tendency to form nanodomains as the apparent diffusion is substantially decreased and as FRET experiments confirm (see below). Such domains, however, have considerably different permeability for the GM1-CTxB complex. The complex is slowed down when entering a domain, but the time it stays confined in the domain is substantially shorter than in the high loaded composition B, i.e., it can leave the domain easier when approaching its boundary.
We hypothesize that compositions B and C contain two different kinds of nanodomains that confine GM1-CTxB complexes differently. The hypothesis explaining such observations assumes that i), in case B, the starting lipid mixture is homogeneous and the domains are formed when a certain cross-linker level is exceeded; and ii), in the lipid mixture C, the nanoscopic phase separation is already established before the addition of the cross-linker, which is in agreement with the fact that some GUVs are phase separated even on the large length scale and additionally it can be confirmed by FRET between perylene and DiIC18(5) (DiD) (Fig. S4, and the corresponding text). Added CTxB-647 in this case probably does not cause the separation, but only label already existing structures and/or help them coalesce.
Composition D lies in the Ld and Lo coexistence region. The notion of composition of individual phases can be obtained from the tie-lines drawn in Fig. 1. The Ld phase is depleted in cholesterol and it is probably the lack of cholesterol that prevents the Ld phase from forming nanodomains. Consequently, diffusion of CTxB-647 is almost identical to the diffusion in the composition A, which is expected to be homogeneous. This is in agreement with the documented need of cholesterol assistance for raft formation (9).
Composition E, which is similar to D, belongs to the two-phase region. Contrary to D, in the Ld phase of the composition E, additional Sph compensates for the decreased cholesterol level, and CTxB-647 diffusion again slows down similar to the case B (see Fig. 2, Table 2) and subwavelength domains within the Ld phase appear. In equilibrium however, those nanodomains would probably fuse with the microscopic Lo phase to minimize the line tension. Because this does not happen in E, we might speculate that the nanodomains do not only differ in size but also in the lipid composition. The accommodation of the two kinds of domains within single GUVs would also indicate that our hypothesis suggesting different domains in B and C is realistic.
Identification of nanodomains by FLIM-FRET using phasor analysis
Our fluorescence dynamics experiments indicate existence of subwavelength domains and allow for the estimation of dynamic parameters, such as time the raft-associating components reside in the domains. The alternative fluorescence method that can report on the existence of molecular assemblies and characterize them in terms of structure is the FLIM-FRET approach. In our experiments, energy transfer from labeled CTxB (CTxB-488, donor) to DiD (acceptor), a lipid tracer preferentially residing in the Ld phase, was monitored by changes in a fluorescence decay histogram of the donor. In the homogenous lipid bilayer, donor fluorescence decay is heavily affected by energy transfer to acceptors that are in the close vicinity of the donor. Noticeably, the donor decay is a result of broadly distributed energy transfer rates that depend on distance between the particular acceptor and the donor, which makes the decay rather complex (21). When domains are formed or a large-scale coalescence occurs, donors and acceptors with different partitioning between the lipid phases become more separated and the effect of FRET is lowered.
To avoid problems with the complexity of donor decays and the parameter compensating effects when fitting with exponential functions, for purposes of FLIM, the graphical, nonfitting phasor plot approach was employed (22). Detailed description of the method applied in this work is given in the Supporting Material. Briefly, for each donor decay acquired at every pixel of the GUV image, one frequency of the intensity normalized Fourier transform is calculated according to the formula:
where Re and Im stand for real and imaginary parts of the value obtained via Fourier transform, Ii represents fluorescence intensity in the ith time-correlated single photon counting channel, L is the number of the channels, i0 is a channel position of the decay rising edge, and n is an arbitrarily chosen frequency. Re and Im are coordinates of the position in the phasor plot that are assigned to the particular decay function reflecting the level of FRET. For all pixels in the image, these coordinates are calculated. The two-dimensional histogram of their occurrence depicts distribution of different decay functions within the image. Usually, one or more spots/clusters appear in the phasor plot corresponding to different types of decays (i.e., spatially resolvable areas with different acceptor distributions).
In our experiments, a small aliquot of CTxB-488 was added to immobilized GUVs heavily stained with DiD. The amount of CTxB-488 was chosen to correspond to the concentration level, where no significant changes in diffusion (at composition B) were observed. FLIM images were acquired for GUVs consisting of lipid compositions denoted in Fig. 1. As expected, GUVs without observable large-scale phase separation revealed one cluster of decays in the phasor plot (A, B, and C). Phase-separated GUVs showed either two components, low- and high-FRET, (D) spatially corresponding to the Lo and Ld phase, respectively, or only one component, low-FRET, assigned to the Lo phase (E). The missing high FRET component was not observed due to high partitioning of CTxB-488 to the Lo phase.
Positions of the clusters in phasor plots obtained for different GUV compositions are given in Fig. 4 (see Fig. S4 for entire plots). The most striking is the finding of entirely different decays for three microscopically homogenous compositions A, B, and C. A does not contain Sph, no lipid segregation occurs, and FRET accelerates CTxB-488 decay considerably due to a high probability of an acceptor presence in close vicinity of a donor. B and C are close to the phase separation boundary and the occurrence of nanodomains is therefore expected. In the domain, the donor molecule is separated from the acceptor so that the molecule either cannot transfer its energy to an acceptor if the domains are much greater than the Förster radius, or it transfers the energy with lower average efficiency when size of the domains is comparable to the Förster radius. Fig. 4 shows that the composition B exhibits reduced FRET already at a low dose of CTxB-488, which is even more pronounced at the composition C.
Figure 4.
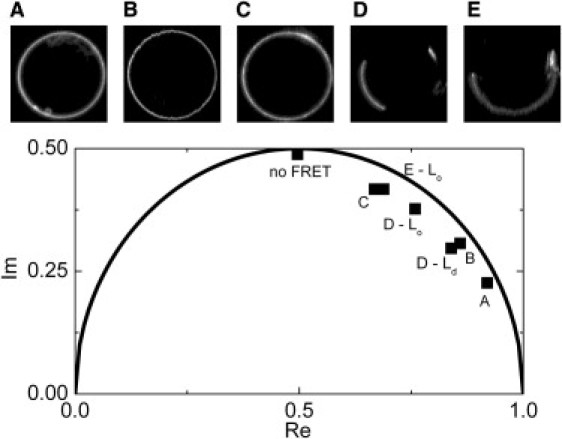
FLIM-FRET phasor diagram depicting peak positions of the two-dimensional histogram of transformed donor fluorescence decay functions measured at every pixel of the GUV image. Upper part: fluorescence intensity images of CTxB-488 (donor) stained GUVs at different lipid compositions. GUVs are colabeled with DiD (acceptor). For D, two clusters appeared in the phasor diagram, corresponding to the Lo and Ld phase. The circular line depicts positions of monoexponential decays and position of the acceptor free decay, i.e., no FRET, is marked.
GUVs consisting of compositions A, B, and C were further treated with an excess of nonlabeled CTxB and the FLIM image of the same liposome was taken again. For compositions A and C, no change occurred, whereas in the case of B, addition of cross-linker surplus led to further reduction of FRET (B′). This suggests that in the case of the mixture C, domains were already well established at low concentration of CTxB-488, whereas composition B required more cross-linker to enhance the effect (see Fig. 5). As noted previously, we performed the same experiments with a different FRET pair (perylene-DiD), which also confirms lipid clustering in C before cross-linker addition (Fig.S5).
Figure 5.
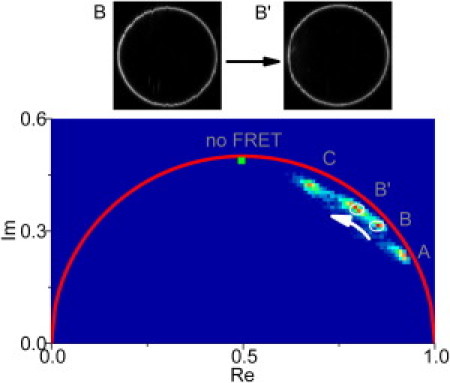
FLIM-FRET phasor diagram displaying shift of the CTxB-488 decay functions toward lower FRET when excess of a nonlabeled cross-linker is added. Upper part: CTxB-488 intensity images of the investigated GUV before and after adding of nonlabeled CTxB. No resolvable phase separation occurs.
Size determination of nanodomains by MC simulations of FLIM-FRET data
Having proved that the existence of nanodomains can be visualized by FRET, decay functions assigned to compositions A, B, B′, and C were further analyzed. We have shown in our previous work that the FRET pair we used here can reveal formation of domains that are smaller than 20 nm (23). Composition A corresponds to the situation of randomly distributed donors and acceptors in a lipid bilayer. The time-resolved energy transfer can be analyzed according to the model that was analytically derived by Baumann and Fayer (B-F model) (21). Details of the model are given in the Supporting Material. By fitting the model to the donor decay function, the concentration of the acceptor molecules was obtained as a readout parameter and kept constant also in the further analysis.
Distribution constants of the donor (KD) and the acceptor (KA), input parameters required for MC simulations of domain-containing membranes, were estimated from mean pixel intensities of donor and acceptor in the phase separated GUVs corresponding to the lipid mixture D. The values are in good agreement with the literature (18).
The donor decays corresponding to situation B and B′ (see Fig. 5), i.e., the situation with a low amount of CTxB-488 and with an excess of nonlabeled CTxB, respectively, and situation C (see Fig. 5) were modeled by means of MC simulations (24–26) (see the Supporting Material for details) and compared to the experimental decay curves. The number of fitting parameters was reduced to R, the domain radius, and Ar, the area domains take up in the bilayer. As shown in Fig. 6, the optimization routine provides a pronounced minimum for B when R = 5–5.4 nm and Ar = 6–9% and for B′ when R = 8 nm and Ar = 6%. For situation C R = 24 nm and Ar = 3%. The calculated area for the composition C is much smaller than would be expected upon the analysis of the phase diagram. This might be caused by several facts. First of all, the distribution coefficients are not known precisely and as shown further, the KD value has a nonnegligible impact on the calculated fractions, but not on the domain radius. Furthermore, the phase diagram presented in Fig. 1 has more or less an illustrative character because it applies for a system similar to ours but with few alterations as already discussed. Unfortunately, these alterations will have the greatest impact in the discussed boundary region.
Figure 6.
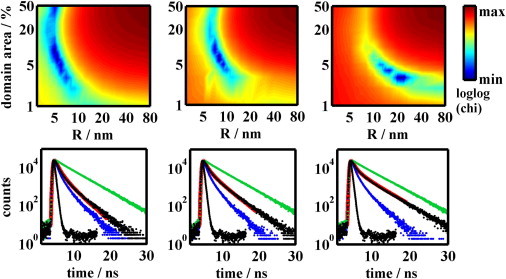
Upper part: Best fitting χ2-square parameter as a function of the domain radius and the area domains take up in the bilayer. A minimum is found at R = 5 nm and domain area 9% for composition B (on the left), R = 8 nm and domain area 6% for composition B′ (in the middle), and at R = 24 nm and domain area 3% for the composition C (on the right). Lower part: Displayed time resolved fluorescence decays of CTxB-488 serving as the donor (D) representing the bilayer containing i), D only (green line); ii), D and A (acceptors) distributed between domain and nondomain regions (black line) and iii), D and A, where both D and A are uniformly distributed in the bilayer without any domains (blue line). The red line almost coinciding with the black line is the best fit calculated by means of MC simulations. Instrument response function is displayed too. Figures in the lower part correspond to those in the upper part.
Because both KD = 6 ± 3 and KA = 0.004 ± 0.002 have been estimated with a certain error and since they are expected to moderately change across the tie-line field (Fig. 1), it is reasonable to test how the values of distribution constants influence the positions of the minima. We have realized that domain radii stay almost unaffected, whereas the domain area reflects the changes of KD. In the case of B′ for example, reduction of KD from 6 to 3 leads to R = 8 nm and Ar = 12%, whereas an increase of KD to 9 leads to R = 7 nm and Ar = 5%. It is not surprising that change of KA in the range ± 0.002 does not affect the shape of the decay because KA is so low that practically all acceptors are still excluded from the domains. Similarly, we tried to vary concentration of the acceptor molecules (which was estimated by the B-F model) in the range ± 10% for B′. The impact on both R and Ar was negligible. Therefore, it can be concluded that the domain radius increases in the order 5 → 8 → 24 nm when going from B over B′ to C, although the area the domains occupy does not significantly change.
It is worth noticing that the radius of pentameric CTxB is around 4.5 nm (27), which suggests that in situation B, a domain is formed at most by a single pentamer unit (domain radius ∼5 nm). Because the FRET contribution is lowered in case B compared to the homogenous composition A, the pentameric unit is probably encircled by a raft-lipid collar separating donor and acceptor molecules and forming a disk-like domain with a protein-cross-linked GM1 core and Sph-enriched shell.
The domain radius (∼8 nm) in the case of B′ suggests that maximum 2–3 pentameric CTxB units form the enlarged domain. Because both the FCS and FRET demonstrations of domains show dependency on the cross-linker load, coalescence of two to three units implicates the domain formation. Once a CTxB molecule would separate from the cluster, the enlarged domain would be perturbed and inevitably disappear. Therefore, the domains in case B′ are probably transient with the lifetime corresponding roughly to the residential time obtained from the z-scan FCS (30 ms). Because it is the cross-linker concentration that makes domains detectable in our experiments, we hypothesize that domain is formed upon collision between two and three CTxB disks. This implies that they can be observed if the collision rate is sufficient. We have calculated theoretical collision rates and the mean times between two collisions for the 5 nm disks diffusing freely in the planar bilayer (28) (see Table S3) and realized that while in the composition B highly loaded with CTxB-647, the mean intercollision time is around 31 ms, at low cross-linker load, this time increases to almost 1 s. At high cross-linker load, CTxB-GM1 complexes spend half of their time trapped in the domains, whereas at low load, this time is in the range of only a few percents and therefore the domains were not detected. Similar confinement times indicating trapped molecular diffusion and estimated raft sizes (i.e., <20 nm) were also reported in the STED-FCS study of glycosylphosphatidylinositol-anchored proteins (9), which might indicate the general character of the described phenomenon.
Conclusion
In this work, a detailed dynamic and structural study of a cross-linker-triggered formation of nanodomains is presented. We show evidence of such structures in the model membranes at lipid compositions closely approaching the optically resolvable phase separation boundary. It has to be noted that the phase separation boundary has been commonly determined (29) based on observation of two distinct phases in model membranes by means of optical microscopy. Recent work of Heberle et al. (30) predicts optically nonresolvable phase coexistence in ternary lipid mixtures even in the putative one-phase region.
Here, fluorescence dynamic experiments carried out in two lipid membrane compositions (B and C) slightly differing in the Sph content reveal two different types of subwavelength domains. Although the FRET analysis predicts three times larger domain radius in the liposomes composed of mixture C compared to B, apparent diffusion of the cross-linker molecules is approximately by factor three slower in the composition B (compared to C) and follows a different diffusion law. Because in B, the diffusion character changes at an increased cross-linker load, we propose that these nanodomains are transiently constituted upon collision of CTxB-GM1 complexes. In B the domain formation is therefore initiated exclusively by the cross-linker and consequently stabilized by Sph. In contrast, our data indicate that small lipid domains are already formed in the composition C before the cross-linker is added and their existence is attributed mainly to lipid-lipid interactions. We hypothesize that the addition of the cross-linker induces further coalescence into larger membrane assemblies that eventually leads to microscopic phase separation (10).
It has to be pointed out that the noncytosolic leaflet of the plasma membrane contains much more cholesterol (up to 50%) than used in this study (31). To get an idea whether the domains are still formed under biologically more relevant conditions, we explored the diffusion behavior of labeled CTxB also along the 35% cholesterol line (data not shown) and observed the very same slowing down of the apparent diffusion when approaching the phase separation boundary (at 29% of Sph). This suggests that the transiently forming domains causing the trapped diffusion may be also preserved at cholesterol contents relevant for plasma membranes. The approaches used in this study are however applicable generally, i.e., also in the living cells (see (32) for FCS-based diffusion laws).
CTxB is not only an important model of a pentavalent lipid cross-linker, but it also significantly responses to the imposed membrane curvature by strong enhancing curvature-mediated lipid sorting close to the phase separation boundary (33,34). It is believed that the reason for this behavior arises from the ability of CTxB pentamers to form clusters bending inward, which are also responsible for the cellular uptake of the toxin (35). Our results show that close to the boundary region, the CTxB-GM1 pentamers are probably enriched in Sph forming rigid disk-like (perhaps even negatively curved) platforms that would be expelled from membranes of highly positive curvature. The CTxB-induced sorting enhancement could therefore stem from association of the raft lipids with the platforms.
CTxB together with other bacterial toxins such as Shiga toxin and some viruses from the polyoma family such as simian virus 40 are involved in glycosphingolipid receptor clustering, which induces membrane curvature responsible for caveolin-independent endocytoses. It has been shown that the membrane invaginations responsible for the toxin uptake are subjected to the overall membrane tension, bending rigidity in the receptor-enriched domains related to the ability to cause the spontaneous curvature as well as the Lo of the domains responsible for the aggregation of the pentameric clusters. Therefore, understanding of the nanodomain formation on the level of a few single pentamers may also cast light on the molecular mechanism and dynamics of the previously mentioned phenomena.
Acknowledgments
M.Š. acknowledges support of the Grant Agency of Charles University (grant No. 3130/2011), Ministry of Education of the Czech Republic for a scholarship, and to specific University Research Project (grant No. 33779266), R.M., M.H., J.H., M.C., and R.Š. acknowledge support of the Czech Science Foundation (ESF EUROMEMBRANE project MEM/09/E006, P305/11/0459, and P208/10/1090). M.C. wishes to further acknowledge a Purkyne Fellowship award.
Supporting Material
References
- 1.Grakoui A., Bromley S.K., Dustin M.L. The immunological synapse: a molecular machine controlling T cell activation. Science. 1999;285:221–227. doi: 10.1126/science.285.5425.221. [DOI] [PubMed] [Google Scholar]
- 2.Schamel W.W.A., Arechaga I., Alarcón B. Coexistence of multivalent and monovalent TCRs explains high sensitivity and wide range of response. J. Exp. Med. 2005;202:493–503. doi: 10.1084/jem.20042155. [DOI] [PMC free article] [PubMed] [Google Scholar]
- 3.Holowka D., Baird B. Fc(epsilon)RI as a paradigm for a lipid raft-dependent receptor in hematopoietic cells. Semin. Immunol. 2001;13:99–105. doi: 10.1006/smim.2000.0301. [DOI] [PubMed] [Google Scholar]
- 4.Janes P.W., Ley S.C., Magee A.I. Aggregation of lipid rafts accompanies signaling via the T cell antigen receptor. J. Cell Biol. 1999;147:447–461. doi: 10.1083/jcb.147.2.447. [DOI] [PMC free article] [PubMed] [Google Scholar]
- 5.Stefanová I., Horejsí V., Stockinger H. GPI-anchored cell-surface molecules complexed to protein tyrosine kinases. Science. 1991;254:1016–1019. doi: 10.1126/science.1719635. [DOI] [PubMed] [Google Scholar]
- 6.Dietrich C., Volovyk Z.N., Jacobson K. Partitioning of Thy-1, GM1, and cross-linked phospholipid analogs into lipid rafts reconstituted in supported model membrane monolayers. Proc. Natl. Acad. Sci. USA. 2001;98:10642–10647. doi: 10.1073/pnas.191168698. [DOI] [PMC free article] [PubMed] [Google Scholar]
- 7.Hammond A.T., Heberle F.A., Feigenson G.W. Cross-linking a lipid raft component triggers liquid ordered-liquid disordered phase separation in model plasma membranes. Proc. Natl. Acad. Sci. USA. 2005;102:6320–6325. doi: 10.1073/pnas.0405654102. [DOI] [PMC free article] [PubMed] [Google Scholar]
- 8.van Zanten T.S., Gómez J., Garcia-Parajo M.F. Direct mapping of nanoscale compositional connectivity on intact cell membranes. Proc. Natl. Acad. Sci. USA. 2010;107:15437–15442. doi: 10.1073/pnas.1003876107. [DOI] [PMC free article] [PubMed] [Google Scholar]
- 9.Eggeling C., Ringemann C., Hell S.W. Direct observation of the nanoscale dynamics of membrane lipids in a living cell. Nature. 2009;457:1159–1162. doi: 10.1038/nature07596. [DOI] [PubMed] [Google Scholar]
- 10.Lingwood D., Ries J., Simons K. Plasma membranes are poised for activation of raft phase coalescence at physiological temperature. Proc. Natl. Acad. Sci. USA. 2008;105:10005–10010. doi: 10.1073/pnas.0804374105. [DOI] [PMC free article] [PubMed] [Google Scholar]
- 11.Brown D.A., London E. Structure and function of sphingolipid- and cholesterol-rich membrane rafts. J. Biol. Chem. 2000;275:17221–17224. doi: 10.1074/jbc.R000005200. [DOI] [PubMed] [Google Scholar]
- 12.de Almeida R.F.M., Loura L.M.S., Prieto M. Lipid rafts have different sizes depending on membrane composition: a time-resolved fluorescence resonance energy transfer study. J. Mol. Biol. 2005;346:1109–1120. doi: 10.1016/j.jmb.2004.12.026. [DOI] [PubMed] [Google Scholar]
- 13.Benda A., Benes M., Hof M. How to determine diffusion coefficients in planar phospholipid systems by confocal fluorescence correlation spectroscopy. Langmuir. 2003;19:4120–4126. [Google Scholar]
- 14.Wawrezinieck L., Rigneault H., Lenne P.F. Fluorescence correlation spectroscopy diffusion laws to probe the submicron cell membrane organization. Biophys. J. 2005;89:4029–4042. doi: 10.1529/biophysj.105.067959. [DOI] [PMC free article] [PubMed] [Google Scholar]
- 15.Akashi K., Miyata H., Kinosita K., Jr. Preparation of giant liposomes in physiological conditions and their characterization under an optical microscope. Biophys. J. 1996;71:3242–3250. doi: 10.1016/S0006-3495(96)79517-6. [DOI] [PMC free article] [PubMed] [Google Scholar]
- 16.Smith A.K., Freed J.H. Determination of tie-line fields for coexisting lipid phases: an ESR study. J. Phys. Chem. B. 2009;113:3957–3971. doi: 10.1021/jp808412x. [DOI] [PMC free article] [PubMed] [Google Scholar]
- 17.Farkas E.R., Webb W.W. Precise and millidegree stable temperature control for fluorescence imaging: application to phase transitions in lipid membranes. Rev. Sci. Instrum. 2010;81:093704. doi: 10.1063/1.3483263. [DOI] [PMC free article] [PubMed] [Google Scholar]
- 18.Chiantia S., Ries J., Schwille P. Combined AFM and two-focus SFCS study of raft-exhibiting model membranes. Chem. Phys. Chem. 2006;7:2409–2418. doi: 10.1002/cphc.200600464. [DOI] [PubMed] [Google Scholar]
- 19.Stefl M., Kułakowska A., Hof M. Simultaneous characterization of lateral lipid and prothrombin diffusion coefficients by z-scan fluorescence correlation spectroscopy. Biophys. J. 2009;97:L01–L03. doi: 10.1016/j.bpj.2009.05.031. [DOI] [PMC free article] [PubMed] [Google Scholar]
- 20.Wenger J., Conchonaud F., Lenne P.F. Diffusion analysis within single nanometric apertures reveals the ultrafine cell membrane organization. Biophys. J. 2007;92:913–919. doi: 10.1529/biophysj.106.096586. [DOI] [PMC free article] [PubMed] [Google Scholar]
- 21.Baumann J., Fayer M.D. Excitation transfer in disordered two-dimensional and anisotropic 3-dimensional systems - effects of spatial geometry on time-resolved observables. J. Chem. Phys. 1986;85:4087–4107. [Google Scholar]
- 22.Digman M.A., Caiolfa V.R., Gratton E. The phasor approach to fluorescence lifetime imaging analysis. Biophys. J. 2008;94:L14–L16. doi: 10.1529/biophysj.107.120154. [DOI] [PMC free article] [PubMed] [Google Scholar]
- 23.Sachl R., Humpolíčková J., Hof M. Limitations of electronic energy transfer in the determination of lipid nanodomain sizes. Biophys. J. 2011;101:L60–L62. doi: 10.1016/j.bpj.2011.11.001. [DOI] [PMC free article] [PubMed] [Google Scholar]
- 24.Engstrom S., Lindberg M., Johansson L.B.A. Monte-Carlo simulations of electronic-energy transfer in 3-dimensional systems - a comparison with analytical theories. J. Chem. Phys. 1988;89:204–213. [Google Scholar]
- 25.Johansson L.B.A., Engstrom S., Lindberg M. Electronic energy transfer in anisotropic systems. 3. Monte Carlo simulations of energy migration in membranes. J. Chem. Phys. 1992;96:3844–3856. [Google Scholar]
- 26.Šachl R., Mikhalyov I., Johansson L.B. Distribution of BODIPY-labelled phosphatidylethanolamines in lipid bilayers exhibiting different curvatures. Phys. Chem. Chem. Phys. 2011;13:11694–11701. doi: 10.1039/c1cp20608g. [DOI] [PubMed] [Google Scholar]
- 27.Dwyer J.D., Bloomfield V.A. Subunit arrangement of cholera toxin in solution and bound to receptor-containing model membranes. Biochemistry. 1982;21:3227–3231. doi: 10.1021/bi00256a030. [DOI] [PubMed] [Google Scholar]
- 28.Hardt S.L. Rates of diffusion controlled reactions in one, two and three dimensions. Biophys. Chem. 1979;10:239–243. doi: 10.1016/0301-4622(79)85012-7. [DOI] [PubMed] [Google Scholar]
- 29.Veatch S.L., Keller S.L. Separation of liquid phases in giant vesicles of ternary mixtures of phospholipids and cholesterol. Biophys. J. 2003;85:3074–3083. doi: 10.1016/S0006-3495(03)74726-2. [DOI] [PMC free article] [PubMed] [Google Scholar]
- 30.Heberle F.A., Wu J., Feigenson G.W. Comparison of three ternary lipid bilayer mixtures: FRET and ESR reveal nanodomains. Biophys. J. 2010;99:3309–3318. doi: 10.1016/j.bpj.2010.09.064. [DOI] [PMC free article] [PubMed] [Google Scholar]
- 31.van Meer G., Voelker D.R., Feigenson G.W. Membrane lipids: where they are and how they behave. Nat. Rev. Mol. Cell Biol. 2008;9:112–124. doi: 10.1038/nrm2330. [DOI] [PMC free article] [PubMed] [Google Scholar]
- 32.Humpolícková J., Gielen E., Engelborghs Y. Probing diffusion laws within cellular membranes by Z-scan fluorescence correlation spectroscopy. Biophys. J. 2006;91:L23–L25. doi: 10.1529/biophysj.106.089474. [DOI] [PMC free article] [PubMed] [Google Scholar]
- 33.Tian A., Baumgart T. Sorting of lipids and proteins in membrane curvature gradients. Biophys. J. 2009;96:2676–2688. doi: 10.1016/j.bpj.2008.11.067. [DOI] [PMC free article] [PubMed] [Google Scholar]
- 34.Sorre B., Callan-Jones A., Bassereau P. Curvature-driven lipid sorting needs proximity to a demixing point and is aided by proteins. Proc. Natl. Acad. Sci. USA. 2009;106:5622–5626. doi: 10.1073/pnas.0811243106. [DOI] [PMC free article] [PubMed] [Google Scholar]
- 35.Ewers H., Römer W., Johannes L. GM1 structure determines SV40-induced membrane invagination and infection. Nat. Cell Biol. 2010;12:11–18. doi: 10.1038/ncb1999. [DOI] [PubMed] [Google Scholar]
- 36.Palmer Iii A.G., Thompson N.L. Optical spatial intensity profiles for high order autocorrelation in fluorescence spectroscopy. Appl. Opt. 1989;28:1214–1220. doi: 10.1364/AO.28.001214. [DOI] [PubMed] [Google Scholar]
- 37.Bergenstahl B.A., Stenius P. Phase diagrams of dioleoylphosphatidylcholine with formamide, methylformamide, and dimethylformamide. J. Phys. Chem. 1987;91:5944–5948. [Google Scholar]
- 38.Margineanu A., Hotta J.I., Hofkens J. Visualization of membrane rafts using a perylene monoimide derivative and fluorescence lifetime imaging. Biophys. J. 2007;93:2877–2891. doi: 10.1529/biophysj.106.100743. [DOI] [PMC free article] [PubMed] [Google Scholar]
Associated Data
This section collects any data citations, data availability statements, or supplementary materials included in this article.