

Abstract
The noninvasive measurement of peripheral vascular reactivity, as an indicator of vascular function, provides a valuable tool for cardiovascular screening of at-risk populations. Practical and economical considerations demand that such a test be low-cost and simple to use. To this end, it is advantageous to substitute digital thermal monitoring (DTM) for the more costly and complex Doppler system commonly used for this measurement.
A signal processing model was developed to establish the basis for the relationship between finger temperature reactivity and blood flow reactivity following a transient brachial artery occlusion and reperfusion protocol (reactive hyperemia). Flow velocity signals were acquired from the radial artery of human subjects via an 8 MHz Doppler probe while simultaneous DTM signals were acquired from a distal fingertip via DTM sensors. The model transforms the DTM temperature signals into normalized flow signals via a deconvolution method which employs an exponential impulse function. The DTM normalized flow signals were compared to simultaneous, low-frequency, normalized flow signals computed from Doppler sensors. The normalized flow signals, derived from DTM and Doppler sensors, were found to yield similar reactivity responses during reperfusion. The reactivity areas derived from DTM and Doppler sensors, indicative of hyperemic volumes, were found to be within ± 15%. In conclusion, this signal processing model provides a means to measure vascular reactivity using DTM sensors, that is equivalent to that obtained by more complex Doppler systems.
I. INTRODUCTION
Cardiovascular disease (CVD) is the leading cause of death in the United States and most developed countries. Numerous studies have shown that current, factor-based, risk assessment methods for early detection and prevention of heart attack are grossly inadequate. A non-invasive, non-imaging, low-cost method is needed to screen healthy-looking (asymptomatic), at-risk populations in order to identify individuals at risk of future heart attack, who could then undergo more sophisticated diagnostic tests, local therapies (stents) or aggressive systemic drug treatments [1].
Vascular reactivity is a primary component of the circulatory system that enables the vasculature to respond to physiological and pharmacological stimuli that require adjustments of blood flow, vessel tone and vessel diameter. These vascular changes may be either vasoconstrictive or vasodilative in nature and occur on both the microvascular and macrovascular levels. In early stages of atherosclerosis, even before morphological changes impact arterial stiffness, endothelial dysfunction is evident and results in a significant decrease in vascular reactivity. Thus, vascular reactivity, may serve as a valuable screening parameter for large, at-risk populations.
Digital thermal monitoring (DTM) technology is a prime candidate for the simple, reliable, low-cost instrumentation needed to screen large at-risk populations for cardiovascular disease. This technology uses temperature probes to monitor vascular reactivity at the fingertips following a transient occlusion of flow to the arm and hand. The VENDYS® system (Endothelix Inc., Houston, TX) employs DTM technology via a brachial artery occlusion and reperfusion protocol. During a suprasystolic, brachial artery cuff occlusion of the right arm (usually 5 minutes) the right fingertip temperature decays exponentially toward ambient temperature due to the absence of warm circulating blood. With the absence of blood flow, a vasodilatory response occurs in the distal arteries and capillaries. Upon release of the brachial occlusion, blood rushes into the forearm and hand causing a transient temperature rebound (TR) in the fingertip that is proportional to the reactive hyperemia response. A greater vascular reactivity is associated with a larger temperature rebound. The VENDYS® DTM technology has been directly shown to be a valuable indicator of cardiovascular risk [2],[3],[4].
A signal processing model was developed to support the use of simple, low-cost DTM technology in place of a more complex and expensive Doppler system. This model creates a normalized, low-frequency, flow signal via deconvolution methods from a DTM sensor signal during the brachial occlusion and reperfusion protocol. This normalized flow signal is further processed to yield measurements of vascular reactivity.
II. THEORY
The applicable theory deals with flow and temperature domain signals. Temperature signals, the domain of DTM technology, can be accurately converted to flow signals, typically the domain of Doppler technology, during an arterial occlusion and reperfusion protocol for the purpose of measuring vascular reactivity.
The relationship between vascular reactivity, vessel diameter and flow is evident in Poiseuille’s law [5]. This law establishes flow as a sensitive indicator of vascular dilation. The amount of steady flow through a blood vessel is proportional to the pressure drop and the fourth power of the vessel diameter. In capillary vessels microvascular resistance, the ratio of pressure drop to flow, is inversely proportional to the fourth power of the vessel diameter. It follows that the increased vessel diameter associated with vascular reactivity during reperfusion will result in a significant decrease in microvascular resistance. Since microvascular resistance is a dominant component of peripheral resistance on the macro scale, microvascular dilation also results in decreased peripheral resistance on the larger level. Therefore, for a given arterial pressure, the vasodilation generated by vascular reactivity during reperfusion yields a significant increase in flow on both micro and macro levels.
A. Flow-Domain Signals
The flow domain signals of interest are those that have thermal effect and sufficient bandwidth to accurately track changes in vascular reactivity. Only low-frequency variations, much less than the heart rate, are of interest. The more rapid ventricular pulsatile components have little thermal impact due to the slower thermal response of the finger. Since changes in vascular reactivity occur over many seconds, the exclusion of the higher frequency ventricular activity does not compromise the reproduction of the vasoactive response. Spatially, a mean flow across the entire vessel is employed. Doppler ultrasound can provide time-varying, mean flow velocity signals within the radial artery. A wide-beam transducer fully insonifies the vessel and after demodulation provides a measure of mean flow velocity across the vessel. A flat probe profile stabilizes the transducer-artery angle which provides a constant relationship between blood velocity and Doppler shift frequency minimizing motion artifacts. A digital signal processing technique determines the mean Doppler shift frequency proportional to the mean flow velocity within the insonified target vessel.
The flow-domain, Doppler-shift signals (Hz) resulting directly from the Doppler ultrasound system may be expressed in other flow-domain units such as flow velocity (cm/sec) or flow (ml/sec) via the common Doppler equation which states that the Doppler shift frequency is proportional to the product of carrier frequency, mean flow velocity and cosine of the probe-artery angle and inversely proportional to the propagation velocity in tissue and blood. These signals may be further expressed in units of mean flow since mean flow is equal to the product of mean flow velocity and the cross-sectional area of the target artery.
Low-frequency flow signals accurately reproduce the slow vascular reactivity changes during reperfusion. A lowpass filters removes pulsatile components of ventricular origin while accurately reproducing the slower vascular changes. Heart rate components occur with a period of approximately one second, while the vascular reactivity response is typically 60 to 140 seconds in duration. A digital, linear-phase, lowpass filter applied to the mean flow velocity signals accomplishes the desired discrimination.
A measure of the strength of the vascular reactivity response is the vasoactive increase in vascular diameter and the duration of that increase. Since flow is a sensitive indicator of diameter, the peak reactivity flow in Figure 1 (a) and (b) is indicative of the reactivity increase in diameter and the decay time constant is a measure of its duration. Conveniently, the area under the exponentially-decaying, response curve greater than the control amplitude is equal to the product of the reactivity time constant, τreactivity, and the difference between the normalized exponential peak, Qnorm peak, and the control flow level, Qnorm control, as expressed in equation (1),
| (1) |
Figure 1.

Vascular reactivity in both flow and temperature domains
(a) An ideal reactivity flow signal showing the control amplitude, Qcontrol prior to cuff occlusion, zero flow during occlusion, and the reactivity response following release of occlusion. The exponential reactivity response has peak amplitude, Qpeak , and decay time constant, τreactivity.
(b) The reactivity flow curve normalized to the control flow amplitude with normalized reactivity area (shaded green). (c) Temperature domain signal with start temperature, occlusion and temperature rebound, TR, illustrated.
The reactivity area in the flow domain, as described in equation (1) and Figure 1, corresponds to an additional volume of blood added to the flow following cuff release above the steady state or control flow as indicated by the units of area, [ml/sec] x [sec] = [ml ]. This reactivity area or reactivity blood volume increases with increasing vessel diameter and increasing reactivity time constant.
B. Temperature Domain Signals
The digital thermal monitoring (DTM) signals follow from the flow-domain, reactivity characteristics above. Within mammalian species, the primary mechanism of heat transfer is blood. The reactivity blood volume, corresponds to a finite injection of both blood volume and heat which are correlated to the measure of reactivity described for flow domain signals. Typically, the finger is at thermal equilibrium with the skin temperature positioned between the blood temperature (~ 37° C.) and the ambient air temperature (~ 22 °C.). Upon occlusion, as blood flow ceases, the finger skin temperature decays exponentially from its starting temperature toward the lower temperature of the adjacent ambient air. Upon release of occlusion, the original blood flow returns to the finger plus the additional volume of blood corresponding to the measure of reactivity. The return of the original blood flow sufficiently returns the finger temperature back to the original start temperature. The speed and overshoot characteristics of the thermal rebound have been found to be a function of the additional blood volume resulting from vascular reactivity.
The thermal mass of the finger provides a lowpass filter effect in converting the flow domain signal, Figure 1 (b), into the temperature domain signal, Figure 1 (c). This effect is most evident during occlusion when the flow input drops abruptly to zero while the fingertip temperature exponentially decays toward ambient temperature.
Mathematically, the time constant of the exponential temperature decay during occlusion results from filtering the flow domain signal with an exponential impulse response having the identical time constant. The fingertip temperature may be expressed as the convolution of the flow domain signal and the exponential impulse response. Application of a calibration scalar, k1, and the addition of an offset corresponding to the ambient temperature, Ta, permits an estimate of the finger skin temperature, as illustrated mathematically in equation (2) and graphically in Figure 1 (c),
| (2) |
where Tfinger(t) is the time-varying finger skin temperature; hfinger(t) is the impulse response formed from the finger time constant; Q2(t) is the low-frequency mean flow; and * is the convolution operation.
C. Conversion from Temperature to Flow Domains
The DTM signal obtained at the fingertip may be converted to a flow domain signal by solving equation (2) for low-frequency, mean flow, QDTM(t) , as indicated in equation (3):
| (3) |
where the variables are as defined previously and the deconvolution operation deconvolves the exponential impulse response from the differential temperature signal, essentially removing the lowpass filtering effect created by the thermal mass of the finger. The result is a heat flow signal which is proportional to mass flow for warm blood. This deconvolution operation transforms the temperature domain signal into a flow domain signal.
A normalized flow signal is computed to compare flow domain signals and parameters obtained from different patients using different flow measurement systems. This signal is achieved by normalizing the entire flow domain signal with an average of the signal amplitude during the control period prior to cuff occlusion.
III. METHODS
Simultaneous flow and temperature domain signals were acquired from patients undergoing a standard VENDYS® measurement protocol.
A customized, 8 MHz Doppler system was used to obtain time-varying, mean flow velocity signals from the radial artery. The custom wide-beam, flat-profile probe was designed to fully insonify the vessel and provide a stable transducer-artery angle of approximately 60 degrees when positioned over the artery with elastic wrap. Quadrature Doppler signals were simultaneously digitized at a 22050 Hz sampling rate. A custom digital signal processing algorithm was used to determine the bidirectional, mean Doppler shift frequency in the frequency domain, proportional to the mean flow velocity across the insonified target vessel. This algorithm processed a moving window of 294 quadrature Doppler samples for each output sample, resulting in a bidirectional mean flow velocity signal with a 75 Hz sampling rate. This mean flow velocity signal was filtered with one of two finite impulse response, linear-phase, lowpass filters having 1800 coefficients. The first had a cutoff frequency of 0.25 Hz and the second had a cutoff frequency of 0.1 Hz. The first filter removed the cardiac components of the signal, retaining respiratory and thermoregulatory oscillations. The second filter option removed most respiratory components leaving only the lower frequency components attributable to vascular reactivity and thermoregulation. A low-frequency, normalized flow velocity signal, Vnorm(t), was computed from the low-frequency flow velocity signal, ν(t) , and the respective average flow velocity during the control period, Vcontrol , as shown in equation (4).
| (4) |
DTM temperature signals were acquired from the fingertip of the index finger with a VENDYS® system at a sampling rate of 1 Hz. The DTM signal was converted to the flow domain via deconvolution with an exponential impulse function having a time constant equivalent to the cooling time constant of the finger, τfinger , evident during the cuff occlusion period as indicated in equation (3).
The normalized DTM flow signal, QDTM norm(t) , was computed from the DTM flow signal, QDTM(t), and the average DTM flow, QDTM control , computed during the control period prior to arterial occlusion as shown in equation (5).
| (5) |
The relationship between flow and temperature domain signals are shown in the signal processing map of Figure 2. The convolution and deconvolution operations convert between the two domains as shown. A mathematical derivation of the incremental changes in vessel diameter, cross sectional area and incremental changes using Poiseuille’s law [5] and equations (2) through (5) yields insight into the processing. The flow domain alternative path from normalized flow velocity directly to normalized flow in Figure 2, though empirically confirmed, is not fully explained via this derivation without consideration of Doppler field and processing components.
Figure 2.
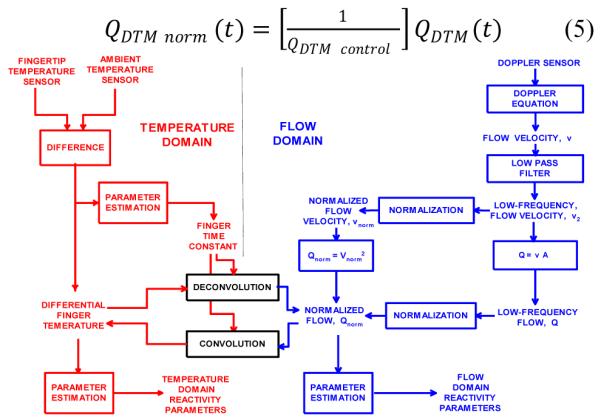
A signal processing map of temperature and flow domain signals.
IV. RESULTS
To evaluate the equivalence of normalized flow signals, the normalized Doppler flow signal and the normalized DTM flow signal were plotted simultaneously as illustrated in Figure 3 (temporally aligned via cross-correlation). The shapes of these two normalized flow waveforms are similar and the thermoregulatory oscillations are accurately reproduced in both.
Figure 3.

Comparison of normalized flow signals computed from Doppler and DTM sensors. Top: DTM signals, reactivity finger temperature (solid red), and contralateral reference finger (dashed black); Middle: Doppler low-frequency flow velocity signals, ν1(t) (green) and ν2(t) (blue); Bottom: normalized Doppler flow signal, Q2norm(t) (blue), and normalized DTM flow signal, QDTM norm(t) (red)
The normalized flow-domain signals computed from Doppler and DTM sensors were used to compute the normalized reactivity area as indicated in Figures 1(b) and 4. Table I displays reactivity areas for four records.
Figure 4.

Sample of reactivity area illustrated for normalized flow signals from Doppler (blue) and DTM (red) sensors. This region is defined as the area above the normalized control amplitude immediately following the release of cuff occlusion (shaded green).
Table I.
Comparison of vascular reactivity area computed from normalized flow signals acquired from Doppler and DTM sensor systems.
| Record No. |
Reactivity area, Doppler (sec) |
Reactivity area, DTM (sec) |
Difference (%) |
|---|---|---|---|
| 26 | 80.5 | 88.8 | 10.4 |
| 27 | 235.9 | 228.6 | −3.1 |
| 46 | 208.2 | 178.5 | −14.3 |
| 23 | 194.1 | 222.1 | 14.4 |
V. DISCUSSION
The similarity of the normalized flow signals from the Doppler and DTM sources supports the accuracy of the signal processing theory. The accurate reproduction of thermoregulatory components in both flow domain signals adds further creditability. The reactivity area in the flow domain is a useful measure of vascular reactivity because it is proportional to the hyperemic blood volume during reperfusion. Reactivity areas from Doppler and DTM sources were within ± 15%.
Future studies with sufficient patient population size are anticipated to compare the reactivity parameters derived from these flow domain signals to cardiovascular risk parameters and existing VENDYS® parameters.
VI. CONCLUSIONS
The signal processing model presented in this paper provides a theoretical and practical basis for the relationship between finger temperature reactivity and blood flow reactivity following a brachial artery occlusion and reperfusion procedure. The normalized, low-frequency flow domain signals initiated from DTM sensors, are shown to resemble the same signals calculated from Doppler sensors. Either flow-domain signal may be further analyzed to yield parameter values associated with vascular reactivity. From this model, it is apparent that vascular reactivity indices measured by DTM are strongly correlated with those measured by Doppler methods.
Contributor Information
Gary L. McQuilkin, Cardiowave, Inc., Plymouth, MN 55446, (phone: 763-504-1052, cardiowavemcq@outtech.com).
David Panthagani, (david.panthagani@endothelix.com).
Ralph W. Metcalfe, University of Houston, Houston, TX, (Ralph.Metcalfe@mail.uh.edu)
Haider Hassan, (haider.hassan@endothelix.com).
Albert A. Yen, (albert.yen@endothelix.com)
Morteza Naghavi, Endothelix, Houston, TX. (mn@vp.org).
Craig J. Hartley, Baylor College of Medicine, Houston, TX, (cjhartley@ieee.org)
REFERENCES
- [1].Naghavi M. Preventive Cardiology: The SHAPE of the future. A Synopsis from the Screening for Heart Attack Prevention and Education (SHAPE) Task Force report. Herz. 2007 Aug;32(5):356–61. doi: 10.1007/s00059-007-3038-4. [DOI] [PubMed] [Google Scholar]
- [2].Ley O, Deshpande C, Prapamcham B, Naghavi M. Lumped parameter thermal model for the study of vascular reactivity in the fingertip. J Biomech Eng. 2008 Jun;130(3):031012. doi: 10.1115/1.2913233. [DOI] [PubMed] [Google Scholar]
- [3].Dhindsa M, Sommerlad SM, DeVan AE, Barnes JN, Sugawara J, Ley O, Tanaka H. Interrelationships among noninvasive measures of postischemic macro- and microvascular reactivity. J Appl Physiol. 2008 Aug;105(2):427–432. doi: 10.1152/japplphysiol.90431.2008. [DOI] [PMC free article] [PubMed] [Google Scholar]
- [4].Ahmadi N, Tirunagaram S, Hajsadeghi F, Flores F, Saeed A, Hecht H, Naghavi M, Budoff M. Concomitant insulin resistance and impaired vascular function is associated with increased coronary artery calcification. Journal of Cardiology. 2009 Feb 4; doi: 10.1016/j.ijcard.2008.12.200. IJCA-11676. [DOI] [PubMed] [Google Scholar]
- [5].Li JK-J. Dynamics of the Vascular System, Series on Bioengineering & Biomedical Engineering - Vol. 1. World Scientific; 2004. pp. 206–207. [Google Scholar]
- [6].Sachdeva A, Cannon CP, Deedwania PC, LaBresh KA, Smith SC, Jr, Dai D, Hernandez A, Fonarow GC. Lipid levels in patients hospitalized with coronary artery disease: An analysis of 136,905 hospitalizations in Get With The Guidelines. American Heart Journal. 2009 Jan;157(1):111–117. doi: 10.1016/j.ahj.2008.08.010. [DOI] [PubMed] [Google Scholar]
- [7].Akosah KO, Schaper A, Cogbill C, Schoenfeld P. Preventing myocardial infarction in the young adult in the first place: how do the national cholesterol education panel III guidelines perform? Journal of the American College of Cardiology. 2003;41(9):1475–1479. doi: 10.1016/s0735-1097(03)00187-6. [DOI] [PubMed] [Google Scholar]