Abstract
Background and objectives
Testicular Leydig cell tumours (LCTs) are rare, steroid-secreting tumours. Elevated levels of aromatase (CYP19 or CYP19A1) mRNA have been previously described in LCTs; however, little is known about the mechanism(s) causing CYP19 over-expression. We report an LCT in a 29-year-old male with elevated plasma oestradiol caused by enhanced CYP19 transcription.
Design and methods
First, we measured the intra-tumour expression of CYP19 and determined the use of CYP19 promoters by qPCR. Secondly, we explored CYP19 and promoter II (PII) for gene amplifications and activating mutations in PII by sequencing. Thirdly, we analysed intra-tumour expression of steroidogenic factor 1 (SF-1 (NR5A1)), liver receptor homologue-1 (LRH-1 (NR5A2)) and cyclooxygenase-2 (COX2 (PTGS2)). Finally, we analysed SF-1 for promoter mutations and gene amplifications.
Results
Similar to what has been recorded in normal Leydig cells, we first found the bulk of tumour CYP19 transcripts to be PII derived, excluding promoter shift as a cause of enhanced transcription. Secondly, we excluded CYP19 and PII gene amplifications, and activating mutations in PII, as causes of elevated CYP19 mRNA. We found SF-1 mRNA to be up-regulated in the tumour, while LRH-1 and COX2 were down-regulated. The finding of elevated SF-1 levels in the tumour was confirmed by immunohistochemistry. The elevated level of SF-1 was not due to promoter mutations or amplifications of the SF-1 gene.
Conclusions
Our results strongly suggest that the elevated levels of SF-1 have induced PII-regulated CYP19 transcription in this tumour. These findings are of relevance to the understanding of CYP19 up-regulation in general, which may occur in several tissues, including breast cancer.
Introduction
Leydig cells are found adjacent to the seminiferous tubules in the testicles. These cells constitute the main androgen-synthesising compartment in adult males and are also capable of oestrogen production (reviewed in (1, 2, 3, 4)).
Leydig cell tumours (LCTs) of the testis are rare, representing about 1–3% of all testicular tumours. They are most frequently diagnosed in pre-pubertal boys between 5 and 10 years and adult men aged 30–60 years (5, 6). While usually benign, about 10% of LCTs in adult patients reveal a malignant phenotype (7).
LCTs are steroid-secreting tumours and consequently associated with endocrine disturbances. In testosterone-secreting LCTs, boys usually present symptoms of precocious puberty, whereas excess androgen rarely causes notable effects in adults. About one-fourth of all LCTs are oestrogen secreting, and the most common symptoms include gynaecomastia in addition to sexual dysfunction and infertility in adults (6, 8, 9, 10). There have also been described cases of LCTs in pre-pubertal boys, revealing symptoms of both oestrogen and androgen production, causing gynaecomastia and precocious puberty in concert (reviewed in (4)).
Local oestrogen synthesis plays a functional role in the testis (reviewed in (11, 12)). In resemblance with other oestrogen-producing compartments, androgens are converted into oestrogens by the aromatase (CYP19) enzyme. CYP19 is encoded by the CYP19A1 gene, localised at chromosome 15q21.2 (13, 14, 15). The unusually large regulatory region of this gene contains several tissue-specific promoters, and each of the promoters give rise to mRNAs with distinct untranslated first exons (16). The first exon is spliced onto a common splice junction in exon II, immediately upstream of the coding region. Thus, the different mRNA species expressed from this gene contains an identical open reading frame (exons II–X), and the translated protein is the same, regardless of the promoter used.
Elevated CYP19 expression with subsequent high plasma oestradiol (E2) levels has been reported in a few cases of testicular LCTs (17, 18, 19, 20, 21). The main regulator of normal testicular cell aromatization is the CYP19 proximal promoter II (PII), which has also been reported as the main active promoter in LCTs (18, 20).
Different response elements have been identified in PII, and both steroidogenic factor 1 (SF-1 (encoded by NR5A1)) and liver receptor homologue-1 (LRH-1 (encoded by NR5A2)) have been reported to be involved in PII-regulated CYP19 expression (22, 23, 24, 25). Moreover, several cAMP-response element (CRE)-like sequences have been identified in PII (26, 27), and cyclooxygenase-2 (COX2 (encoded by PTGS2)) was recently reported to be involved in the phosphorylation of CRE-binding proteins and thus stimulate CYP19 expression and the proliferation of Leydig tumour cells (28).
While over-expression of SF-1 was reported in Fisher rat testicular tumours (22), so far we lack information regarding what mechanism(s) may cause CYP19 over-expression in human testicular LCTs. Here, we report an oestrogen-producing LCT in a 29-year-old man. The finding of SF-1 over-expression in concert with elevated levels of the PII-derived CYP19 transcripts suggests increased SF-1 levels to play a key role in stimulating oestrogen synthesis in these tumour cells.
Materials and methods
Patient
A 29-year-old male with severe gynaecomastia and elevated plasma E2 levels (248 pM, normal upper range 130 pM) was referred to the Endocrine Unit. He was subsequently diagnosed with an oestrogen-producing LCT on the right testis. The tumour was not palpable but visualised on testicular ultrasound. He had normal pubertal growth, had developed normal secondary sex characteristics and was the father of one child. There was no clinical, biochemical (HCG and α-fetoprotein negative) or radiological sign of malignant disease.
The high serum E2 levels returned to normal after surgical removal of the tumour. Although E2, testosterone and SHBG levels normalised rapidly, LH and FSH remained elevated at follow-up, indicating impaired function of the left testicle. All serum hormone levels are summarised in Table 1. At 1-year follow-up, he felt well and the gynaecomastia had resolved.
Table 1.
Patient serum hormone levels (pmol/l).
| Normal | Before operation | 1 Month after operation | 1 Year follow-up | |
|---|---|---|---|---|
| S-oestradiol (pmol/l) | 20–130 | 248 | 112 | 124 |
| S-testosterone (nmol/l) | 6.7–31.9 | 7.8 | 15.2 | 19.0 |
| S-SHBG (nmol/l) | 13–71 | 50 | 40 | 41 |
| S-LH (IE/l) | 0.8–7.6 | 2.8 | 26.7 | 25.9 |
| S-FSH (IE/l) | 0.7–11.1 | 0.9 | 25.4 | 29.6 |
Subject to patient consent, part of the tumour specimen obtained at orchidectomy was snap-frozen and stored in liquid nitrogen for research purposes.
Histology
A part of the testis specimen was fixed in 4% formalin and representative samples including both tumour and normal tissues were embedded in paraffin. Standard haematoxylin- and eosin (H&E)-stained sections (5 μm) were made for microscopic histology evaluation.
Immunohistochemistry
Sections (5 μm) from formalin-fixed, paraffin-embedded tumours were prepared. Immunohistochemical aromatase enzyme staining was performed using the MAB Aro677 (gift from Dr Dean Evans, Novartis AG). SF-1 was stained with the mouse antihuman MAB 434200 (Invitrogen), while the oestrogen and progesterone receptors (PRs) were stained using the MABs M7047 and M3659 (Dako, Glostrup, Denmark) respectively. For the staining procedure, the DAKO Envision HRP mouse kit (Dako) with DAB as detection method was used.
RNA extraction and cDNA synthesis
Total RNA was extracted from snap-frozen biopsies using Trizol reagent (Life Technologies) according to the manufacturer's procedure and dissolved in DEPC-treated deionised water as described by Knappskog et al. (29). The RNA concentration was measured on a Nanodrop ND1000 spectrophotometer and adjusted to 1 μg/μl.
Single-strand cDNA was synthesised from 4 μg total RNA using Transcriptor reverse transcriptase (Roche) according to the manufacturer's procedure. Both oligoT (16-mers) and random hexamers were used as primers in the cDNA synthesis reaction mix.
DNA extraction
Genomic DNA was extracted from snap-frozen biopsies using QIAamp DNA Mini Kit (Qiagen) according to the manufacturer's procedure.
Quantitative PCR
Transcript levels of total CYP19, promoter-specific CYP19 transcript variants, COX2, SF-1 and LRH-1, were quantified using the Lightcycler 480 instrument (Roche). Ribosomal protein P2 (RPLP2) mRNA level was used as reference. The amplification primers and BlackBerry-quenched hydrolysis probes used are listed in Table 2.
Table 2.
Primers and probes.
| Primers/probes | Sequences |
|---|---|
| mRNA expression | |
| Total CYP19 F | 5′-ATCCTCAATACCAGGTCCTGGC |
| Total CYP19 R | 5′-AGAGATCCAGACTCGCATGAATTCT |
| Total CYP19 probe | 5′-6FAM-ACCCGGTTGTAGTAGTTGCAGGCACT-BBQ |
| RPLP2 F | 5′-GACCGGCTCAACAAGGTTAT |
| RPLP2 R | 5′-CCCCACCAGCAGGTACAC |
| RPLP2 probe | 5′-Cy5-AGCTGAATGGAAAAAACATTGAAGACGTC-BBQ |
| CYP19_exon1.3 F | 5′-GTCTAAAGGAACCTGAGACTCTACC |
| CYP19_exon1.4 F | 5′-CACTGGTCAGCCCATCAA |
| CYP19_exon1.7 F | 5′-AGAAAGGGGTGAAATCAGCAA |
| CYP19_exon1 common R | 5′-ACGATGCTGGTGATGTTATAATGT |
| CYP19_exon1 common probe | 5′-6FAM-TCGGGTTCAGCATTTCCAAAACCAT-BBQ |
| CYP19_exonII F | 5′-CCCTTTGATTTCCACAGGAC |
| CYP19_exon3 R | 5′-CCCATGCAGTAGCCAGGAC |
| CYP19_exonII probe | 5′-6FAM-CATGCCAGTCCTGCTCCTCA-BBQ |
| COX2 F | 5′-ATCACAGGCTTCCATTGACC |
| COX2 R | 5′-CAGGATACAGCTCCACAGCA |
| COX2 probe | 5′-6FAM-CCGCAAACGCTTTATGCTGA-BBQ |
| SF-1 F | 5′-TCATCCTCTTCAGCCTGGAT |
| SF-1 R | 5′-AGGTACTCCTTGGCCTGCAT |
| SF-1 probe | 5′-6FAM-ACGCTCAGGAGAAGGCCAAC-BBQ |
| LRH-1 F | 5′-GCACAGGAGTTAGTGGCAAA |
| LRH-1 R | 5′-CTGCTGCGGGTAGTTACACA |
| LRH-1 probe | 5′-6FAM-AACAAGTCAATGCCGCCCT-BBQ |
| Gene copy number analysis | |
| CYP19 gDNA F1 | 5′-TTATGGGAGCCTGGTAGTGG |
| CYP19 gDNA R1 | 5′-AGGGTGGGGTTTTCTATTGG |
| CYP19 gDNA probe 1 | 5′-6FAM-TTGGAACATCATACCCCGGG-BBQ |
| CYP19 gDNA F2 | 5′-GGTGGCTTTTGCTGATCAAT |
| CYP19 gDNA R2 | 5′-AGAAAATGGGCACGAAACTG |
| CYP19 gDNA probe 2 | 5′-6FAM-AGCTCCTGCCAGCTCCCTTT-BBQ |
| CYP19 PII gDNA F1 | 5′-TTGGTCAAAAAAGGGGAGTTG |
| CYP19 PII gDNA R1 | 5′-ATCATCTTGCCCTTGAGTGG |
| CYP19 PII gDNA F2 | 5′-TCCACCTCTGGAATGAGCTT |
| CYP19 PII gDNA R2 | 5′-TTGCAGCATTTCTGACCTTG |
| CYP19 PII gDNA probes 1 and 2 | 5′-6FAM-CTTTCAATTGGGAATGCACG-BBQ |
| CYP19 PII gDNA F3 | 5′-GGGCTTCCTTGTTTTGACTT |
| CYP19 PII gDNA R3 | 5′-GAGGGGGCAATTTAGAGTCC |
| CYP19 PII gDNA probe 3 | 5′-6FAM-CACCCTCTGAAGCAACAGGA-BBQ |
| B2M gDNA F | 5′-CATCCAGCAGAGAATGGAAAG |
| B2M gDNA R | 5′-GAAAGACCAGTCCTTGCTGAA |
| B2M gDNA probe | 5′-Cy5-TGGGTTTCATCCATCCGACA-BBQ |
| PCR/sequencing of CYP19 PII and SF-1 promoter area | |
| CYP19 PII PCR F1 | CTCAACGATGCCCAAGAAAT |
| CYP19 PII PCR R1 | CATGGACCAAAATCCCAAGT |
| CYP19 PII Seq F2 | TTGGTCAAAAAGGGGAGTTG |
| CYP19 PII Seq R2 | CTTACCTGGTATTGAGGATGTGC |
| CYP19 PII Seq F3 | GGCAAGAAATTTGGCTTTCA |
| CYP19 PII Seq R3 | GAGGGGGCAATTTAGAGTCC |
| SF-1 F2 | TCTGCCTCCCAGGTTCAAGC |
| SF-1 R8 | GGTGACTGGATCTTTTGTGTGTTCCTC |
| SF-1 F4 | GAGGAACACACAAAAGATCCAGTCACC |
| SF-1 R7 | CTTGGCCAGCTGGCTGTTG |
| SF-1 F6 | TGTCCTGACTCTACTCCAATGTCCG |
| SF-1 R2 | AACCCCTGAGAAACAAGAGCATCTG |
| SF-1 R9 (seq) | TGTGTGTGTTCCTCTGTTTGTCTCAC |
| SF-1 R10 (seq) | GGGCTTGATTTATGGGCTGCTC |
| SF-1 F6 (seq) | TGTCCTGACTCTACTCCAATGTCCG |
| SF-1 F8 (seq) | CACCAACAAAGAAGGCGAGAGG |
| SF-1 F9 (seq) | TCTGTCCCCCACCTGAGTTTC |
| SF-1 F10 (seq) | CCACTGCCACCCTCATCC |
Amplification was performed in a 20 μl reaction solution using the LC480 Probes Master (Roche) reaction mix, 0.5 μM of each primer, 0.125 μM hydrolysis probe and 0.5 μl cDNA synthesised from 4 μg total RNA. The following thermocycling conditions were used: initial denaturation/enzyme activation at 95 °C for 5 min and then 50 cycles of 95 °C for 10 s (denaturation) and 55 °C for 20 s (annealing/elongation) before a final cooling step at 40 °C for 5 s. Negative controls (water) were included in each run.
The results were converted into relative concentrations using an in-run standard curve, and then normalised for RPLP2 mRNA levels. All gene-specific data from the tumour sample were compared with the corresponding data from a reference sample consisting of pooled total RNA from healthy testis of five donors (BioChain, Newark, CA, USA).
The expression levels of the promoter-specific transcript variants were assessed using different primers and assay-specific standard curves (i.e. different qPCR efficiencies), and the data are therefore not directly comparable. However, an estimate of the differences in expression of these promoters can be made by assuming that all reactions run with the same efficacy (efficiency=2) and comparing the delta crossing points of the different assays.
Gene copy number analysis (qPCR)
In order to investigate possible gene copy number changes of the CYP19 gene and the CYP19 PII, levels of genomic DNA were quantified in duplex reactions with beta-2-microglobulin (B2M) as reference using the Lightcycler 480 instrument (Roche). Two distinct CYP19 genomic areas and three distinct areas covering the CYP19 PII region were amplified using the primers and BlackBerry-quenched hydrolysis probes listed in Table 2. Amplification was performed in a 20 μl reaction solution using the LC480 Probes Master (Roche) reaction mix, 0.5 μM of each primer, 0.125 μM of each hydrolysis probe and 2 μl gDNA as template. The following thermocycling conditions were used: initial denaturation/enzyme activation of 95 °C for 5 min and then 50 cycles of 95 °C for 15 s (denaturation) and 55 °C for 20 s (annealing/elongation) before a final cooling step at 40 °C for 5 s. Negative controls (water) were included in each run. The data obtained through quantification were normalised by adjusting for B2M levels. These normalised values were divided by the corresponding values from a reference sample (pooled DNA from six healthy donors). The concentration of the reference was set to 1.0, and we considered the samples to have reduced copy number if the sample/reference ratio was <0.65 and increased copy number if the ratio was >1.35.
PCR amplification and sequencing
The CYP19 PII and SF-1 promoter regions were amplified and sequenced using primers listed in Table 2. The SF-1 gene has two alternative, untranslated first exons. Relative to the transcription start sites of these two exons, we sequenced the area −1475/+1053 (alternative 1) and −1650/+858 (alternative 2).
PCR amplification was performed using the Kod XL DNA polymerase system (Merck) in a 50 μl reaction mix containing 1× PCR buffer, 0.2 mM of each deoxynucleotide triphosphate, 0.2 μM of each primer, 1.25 U Kod XL DNA polymerase and 1 μl genomic DNA. The thermocycling conditions used were an initial denaturation step of 5 min at 94 °C, followed by 30 cycles of denaturation (94 °C for 1 min), annealing (CYP19 PII: 54.9 °C and SF-1: 63.2 °C for 10 s) and elongation (72 °C for 30 s) and a final elongation step of 7 min at 72 °C. Following amplification, the PCR product was treated with ExoSAP-IT (USB Products, Affymetrix, Inc., Santa Clara, CA, USA) at 37 °C for 30 min and 80 °C for 15 min according to the procedure as outlined by the manufacturer. DNA sequencing was performed in a 10 μl reaction mix containing 1× sequencing buffer, 1 μM primer and 1× BigDye v.1.1 (Applied Biosystems, Carlsbad, CA, USA). Capillary electrophoresis was performed on an automated DNA sequencer (ABI 3730).
Multiplex ligation-dependent probe amplification
The multiplex ligation-dependent probe amplification (MLPA) method and the SALSA MLPA kit P185-B1 lot 0308 (MRC Holland, Amsterdam, The Netherlands) were used according to the manufacturer's instructions to identify deletions or amplifications in the SF-1 gene (NR5A1) localised on 9q33.3. Capillary electrophoresis, data collection and peak analysis were performed on an automated DNA sequencer (ABI 3730). In the patient sample, the peak areas of all MLPA products resulting from SF-1-specific probes were first normalised by the average of peak areas resulting from control probes specific for locations other than on chromosome 9q33.3. A ratio was then calculated where this normalised value was divided by the corresponding value from a sample consisting of pooled DNA from six healthy individuals. A sample was scored as having a reduced copy number at a specific location if this ratio was below 0.75 and as having an increased copy number if the ratio was above 1.25.
Results
Histology
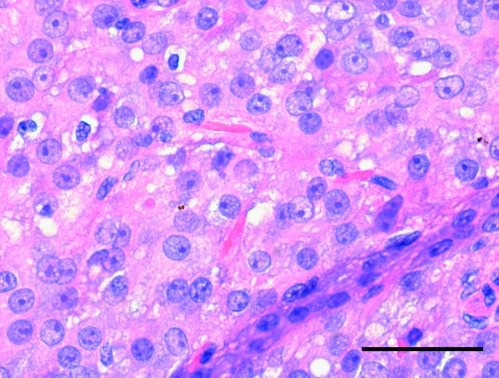
The intra-testicular tumour (largest diameter of 1.8 cm) was sharply delimited from the testicular parenchyma with a non-infiltrative ‘pushing’ border and a solid/nodular growth pattern. The tumour cells had abundant, deeply acidophilic, finely vacuolised cytoplasm with focally deposited brownish yellow lipochrome pigment and intracytoplasmic Reinke's crystalloids, as displayed by H&E staining in Fig. 1. No malignant histological features were observed, i.e. tumour diameter <5 cm, lack of infiltrating border, few mitoses (mean 1 per 10 high power fields), absence of necrosis, no vascular invasion and low tumour cell proliferation assessed with Ki-67/MIB-1 (1–2%). Immunohistochemically, vimentin and inhibin were strongly co-expressed and cytokeratin AE1/3 showed weak and focal positivity, typical for this entity. The epithelial marker (EMA) and germ cell markers (AFP, PLAP) were negative. PR was weakly positive in about 5% of tumour nuclei and oestrogen receptor alpha (ERα) was negative.
Figure 1.
Standard H&E-stained section (5 μm) of testicular Leydig cell tumour. The intra-testicular tumour (largest diameter of 1.8 cm) was sharply delimited from the testicular parenchyma. The tumour cells had abundant, deeply acidophilic, finely vacuolised cytoplasm with focally deposited brownish yellow lipochrome pigment and intracytoplasmic Reinke's crystalloids. Scale bar=50 μm.
CYP19 expression level in the tumour tissue
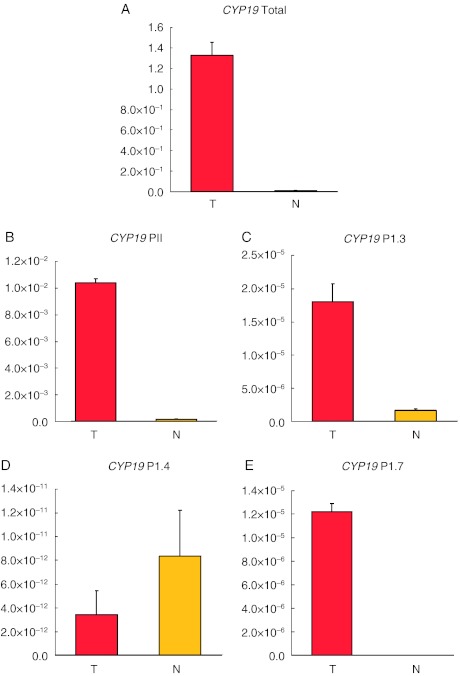
We examined the CYP19 expression level and found it to be strongly up-regulated (125-fold) in the tumour sample compared with normal testis tissue (Fig. 2A). Then, we determined promoter usage by quantifying CYP19 transcript variants specific for promoter PII, 1.3, 1.4 and 1.7 in both tumour and normal tissues (Fig. 2B, C, D and E). The expression level of the PII-specific CYP19 transcript in the tumour sample was 59-fold elevated relative to normal testis tissue. In addition, we found the transcript variants specific for promoters 1.3 and 1.7 to be up-regulated in the tumour tissue. The transcript related to promoter 1.3 displayed an 11-fold increase from normal to tumour tissue while the levels of the variant specific for promoter 1.7 became detectable in the tumour sample contrasting undetectable levels (after 50 amplification cycles) in the normal sample. Interestingly, the transcript variant specific for promoter 1.4 was down-regulated in the tumour tissue (tumour to normal tissue ratio: 0.4).
Figure 2.
mRNA levels of total CYP19 and CYP19 promoter-specific transcript variants. Transcript levels of total aromatase (CYP19) and promoter-specific CYP19 transcript variants were determined in both tumour (T) and normal (N) testes with qPCR. Triplicate runs were performed, and expression of the ribosomal protein P2 (RPLP2) was used as reference in all the reactions. Individual in-run standard curves were used in the five different assays and the relative concentrations as displayed on the y-axes are therefore not comparable between the assays A, B, C, D and E. We observed an increased transcript level of (A) total CYP19 (125-fold), (B) promoter II-specific CYP19 (59-fold), (C) promoter 1.3-specific CYP19 (11-fold) and (E) promoter 1.7-specific CYP19 (not detected in the normal sample). (D) We observed a down-regulation of promoter 1.4-specific CYP19 transcript level (tumour to normal ratio: 0.4).
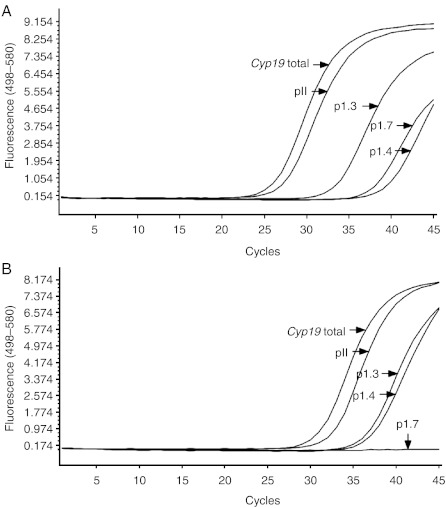
Three runs were performed per promoter assay, and the curves shown in Fig. 3 are representative for these runs. The curves for RPLP2 were removed from Fig. 3 for clarity. When assuming that the qPCRs run with the same efficacy, we found the tumour CYP19 mRNA levels deriving from promoter PII to be 77-, 1233- and 7236-fold higher than from promoters 1.3, 1.7 and 1.4 respectively.
Figure 3.
qPCR-crossing points (Cps) for total CYP19 and CYP19 promoter-specific transcript variants. The qPCR-Cp values for each of the promoters examined were compared in a common run. Three runs were performed per promoter assay, and the curves shown here are representative for these runs. All CYP19 assays were run with RPLP2 as a reference; however, the curves for RPLP2 were removed from the figure for clarity. The Cps strongly indicated that the main contribution to the total CYP19 mRNA level was from PII. (A) Tumour sample, (B) normal tissue sample.
This finding strongly indicates that PII-transcribed mRNA accounts for the majority of the total CYP19 mRNA detected. Moreover, this finding reveals PII to be the principal promoter in both normal and tumour tissue, arguing against the use of an alternative promoter as an explanation for elevated CYP19 levels.
CYP19 coding region and PII gene copy number
Addressing the potential causes for CYP19 over-expression, we analysed the gene copy number for CYP19 using qPCR. No amplifications within the CYP19 locus were observed.
In addition, due to the large contribution from PII, we speculated whether CYP19 up-regulation could be due to either a selective amplification of the PII area or to an activating mutation located in this promoter area. Hence, we performed a copy number analysis specifically for the region harbouring this promoter and sequenced the PII region. No promoter amplification, mutations or polymorphisms were detected.
CYP19 protein staining
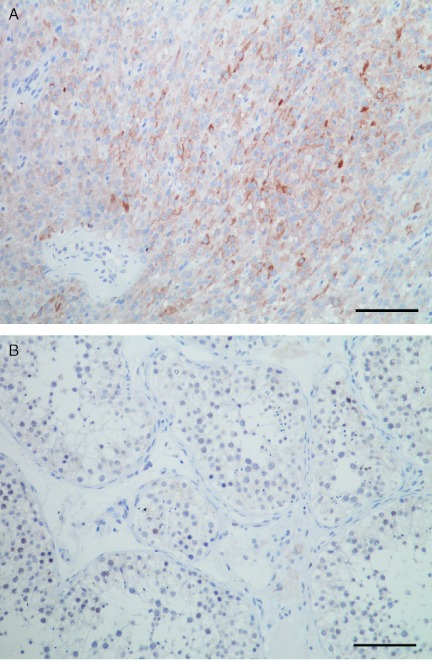
In order to validate the data obtained by qPCR, we analysed CYP19 at the protein level by immunohistochemistry (IHC). Anti-CYP19 (Aro 677)-stained sections revealed focal strong cytoplasmic staining of tumour Leydig cells and negative staining of normal tissue sections (Fig. 4).
Figure 4.
Anti-CYP19 staining of tumour and normal tissue. Anti-CYP19 (Aro 677) stained sections showed (A) strong cytoplasmic staining for tumour Leydig cells, and (B) negative staining in normal tissue. Scale bar: 100 μm.
The transcription factor SF-1 is up-regulated in the tumour
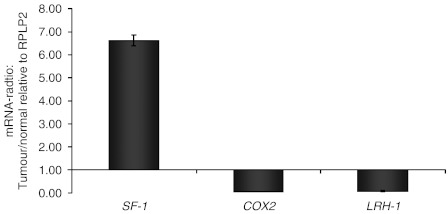
Based on the lack of copy number changes within the CYP19 gene and PII, and/or mutations in PII, we hypothesised that the CYP19 over-expression could be caused by increased levels of a trans-acting factor. Regarding the structure of PII and its known binding sites for different transcription factors, we analysed the mRNA levels of three potential ligand candidates: COX2, LRH-1 and SF-1. COX2 and LRH-1 were down-regulated in the tumour compared with normal tissue (tumour to normal ratios of 0.04 and 0.08 respectively). In contrast, we found the mRNA level of SF-1 to be 6.6-fold up-regulated in the tumour tissue compared with the normal sample (Fig. 5).
Figure 5.
The mRNA levels of SF-1, COX2 and LRH-1 (tumour/normal tissue ratio) were analysed by qPCR. COX2 and LRH-1 were down-regulated in the tumour compared with normal tissue (tumour to normal ratios of 0.04 and 0.08 respectively). In contrast, we found the mRNA level of SF-1 to be 6.6-fold up-regulated in the tumour tissue compared with the normal sample.
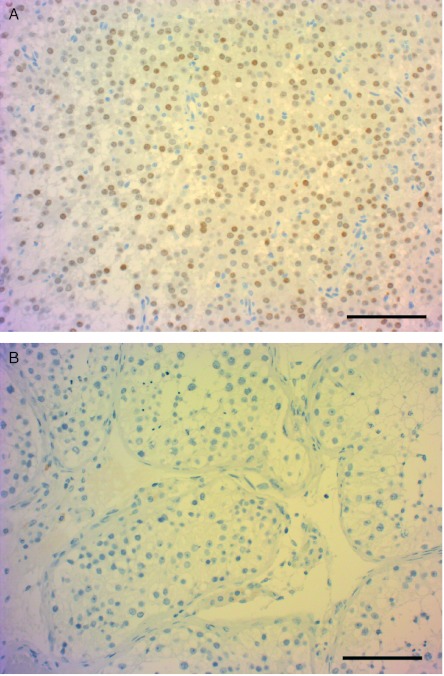
In order to validate the data obtained by qPCR, we analysed SF-1 at the protein level by IHC. Anti-SF-1-stained sections showed strong nuclear staining in tumour tissue and negative staining in normal tissue (Fig. 6).
Figure 6.
Anti-SF-1 staining of tumour and normal tissue. Anti-SF-1-stained sections showed strong nuclear staining in tumour tissue (A) and negative staining in normal tissue (B). Scale bar: 100 μm.
Finally, we explored potential causes of SF-1 over-expression by analysing the copy number of this gene using MLPA, as well as sequencing the promoter region for potential activating mutations. No promoter mutations, amplifications or deletions of SF-1 were observed.
Discussion
While most LCTs reveal benign characteristics, the elevated steroid production may cause disturbing virilising or feminising symptoms.
In this report, we describe a patient with an oestrogen-producing LCT revealing elevated CYP19 and SF-1 mRNA levels. While some previous papers reported elevated oestrogen production in LCTs to be related to enhanced CYP19 mRNA levels (17, 18, 19, 20, 21), the underlying cause of elevated CYP19 mRNA in these tumours has not been reported so far. The results presented here provide further insight into the mechanism(s) of CYP19 up-regulation in LCTs.
First, we ruled out gene amplification of the CYP19 gene as a potential cause of mRNA up-regulation.
Secondly, we evaluated the use of CYP19 promoters. While the CYP19 enzyme is coded for by a single gene, it is subject to tissue-specific regulation due to several alternative promoters (16). Further, there is evidence that CYP19 expression may be differentially regulated in tumours compared with their normal tissue of origin. Taking breast cancer as an example, CYP19 transcription in normal breast tissue is mainly regulated by promoter 1.4, while transcription in breast cancer tissue is regulated by the promoters II, 1.3, 1.7 and 1.4 (30). Here, we found that the majority of the CYP19 mRNA transcripts in both normal and tumour tissue originate from PII. Thus, the elevated CYP19 mRNA level observed in the tumour tissue was not due to alternative promoter use, in conformity with what has been described earlier in a few other cases (18, 20).
Thirdly, we measured intra-tumour mRNA levels of the ligands SF-1, LRH-1 and COX2. We found elevated mRNA levels of SF-1 in tumour compared with normal tissue, a finding validated by the observation of elevated SF-1 protein staining by IHC. While our results are in accordance with findings in experimental systems (22), to the best of our knowledge, SF-1 up-regulation in LCTs has not been demonstrated in humans earlier. Notably, the SF-1 mRNA up-regulation was neither due to NR5A1 gene amplification nor due to activating mutations in the promoter area. Moreover, we found the expression of LRH-1 and COX2 to be significantly down-regulated in tumour tissue compared with normal tissue. LRH-1, like SF-1, has been demonstrated to bind a nuclear receptor half site in PII (31) and regulate CYP19 expression in Leydig cells (23, 25). Our observation of SF-1 up-regulation in concert with LRH-1 down-regulation might indicate that there is a negative feedback loop controlling the expression of these genes.
In previous studies, local COX2 up-regulation has been discussed as a potential mechanism of elevated oestrogen synthesis in inflammation and some cancers (reviewed in (32)), but we lack evidence confirming this in vivo. To the best of our knowledge, this is the first report to demonstrate a similar effect on oestrogen synthesis through local SF-1 up-regulation.
In summary, we found elevated oestrogen synthesis in an LCT to be caused by elevated PII-transcribed CYP19 levels. Moreover, we found the enhanced CYP19 transcription to be most likely caused by elevated levels of the transcription factor SF-1. Interestingly, CYP19 up-regulation in oestrogen-dependent breast cancer has been attributed to enhanced PII activity (30). Our findings reveal pathological SF-1 up-regulation to be a potential mechanism enhancing local oestrogen synthesis in LCTs, suggesting this mechanism to be explored as a potential cause of CYP19 up-regulation in other pathological conditions as well.
Declaration of interest
The authors declare that there is no conflict of interest that could be perceived as prejudicing the impartiality of the research reported.
Funding
This work was supported by grants from the Norwegian Cancer Society and the Norwegian Health Region West. A H Straume is the recipient of a PhD grant and S Knappskog received his postdoc fellowship from the Norwegian Cancer Society. All the laboratory work was performed in Mohn Cancer Research Laboratory.
References
- Lejeune H, Habert R, Saez JM. Origin, proliferation and differentiation of Leydig cells. Journal of Molecular Endocrinology. 1998;20:1–25. doi: 10.1677/jme.0.0200001. [DOI] [PubMed] [Google Scholar]
- Svechnikov K, Landreh L, Weisser J, Izzo G, Colon E, Svechnikova I, Soder O. Origin, development and regulation of human Leydig cells. Hormone Research in Paediatrics. 2010;73:93–101. doi: 10.1159/000277141. [DOI] [PubMed] [Google Scholar]
- Young RH. Testicular tumors – some new and a few perennial problems. Archives of Pathology & Laboratory Medicine. 2008;132:548–564. doi: 10.5858/2008-132-548-TTNAAF. [DOI] [PubMed] [Google Scholar]
- Dilworth JP, Farrow GM, Oesterling JE. Non-germ cell tumors of testis. Urology. 1991;37:399–417. doi: 10.1016/0090-4295(91)80100-L. [DOI] [PubMed] [Google Scholar]
- Kim I, Young RH, Scully RE. Leydig cell tumors of the testis. A clinicopathological analysis of 40 cases and review of the literature. American Journal of Surgical Pathology. 1985;9:177–192. doi: 10.1097/00000478-198503000-00002. [DOI] [PubMed] [Google Scholar]
- Mostofi FK. Testicular tumors – epidemiologic, etiologic, and pathologic features. Cancer. 1973;32:1186–1201. doi: 10.1002/1097-0142(197311)32:5%3C1186::AID-CNCR2820320527%3E3.0.CO;2-8. [DOI] [PubMed] [Google Scholar]
- McCluggage W, Shanks JH, Arthur K, Banerjee SS. Cellular proliferation and nuclear ploidy assessments augment established prognostic factors in predicting malignancy in testicular Leydig cell tumors. Histopathology. 1998;33:361–368. doi: 10.1046/j.1365-2559.1998.00484.x. [DOI] [PubMed] [Google Scholar]
- Valensi P, Coussieu C, Pauwels A, Attali JR, Kemeny JL, Amouroux J, Sebaoun J. Feminizing Leydig cell tumor: endocrine and incubation studies. Journal of Endocrinological Investigation. 1987;10:187–193. doi: 10.1007/BF03347189. [DOI] [PubMed] [Google Scholar]
- Al-Agha OM, Axiotis CA. An in-depth look at Leydig cell tumor of the testis. Archives of Pathology & Laboratory Medicine. 2007;131:311–317. doi: 10.5858/2007-131-311-AILALC. [DOI] [PubMed] [Google Scholar]
- Zarrilli S, Lombardi G, Paesano L, Di Somma C, Colao A, Mirone V, De Rosa M. Hormonal and seminal evaluation of Leydig cell tumour patients before and after orchiectomy. Andrologia. 2000;32:147–154. doi: 10.1046/j.1439-0272.2000.00356.x. [DOI] [PubMed] [Google Scholar]
- Carreau S, Genissel C, Bilinska B, Levallet J. Sources of oestrogen in the testis and reproductive tract of the male. International Journal of Andrology. 1999;22:211–223. doi: 10.1046/j.1365-2605.1999.00172.x. [DOI] [PubMed] [Google Scholar]
- Carreau S, Wolczynski S, Galeraud-Denis I. Aromatase, oestrogens and human male reproduction. Philosophical Transactions of the Royal Society of London. Series B: Biological Sciences. 2010;365:1571–1579. doi: 10.1098/rstb.2009.0113. [DOI] [PMC free article] [PubMed] [Google Scholar]
- Simpson ER, Mahendroo MS, Means GD, Kilgore MW, Hinshelwood MM, Graham-Lorence S, Amarneh B, Ito Y, Fisher CR, Michael MD, Mendelson CR, Bulun SE. Aromatase cytochrome P450, the enzyme responsible for estrogen biosynthesis. Endocrine Reviews. 1994;15:342–355. doi: 10.1210/edrv-15-3-342. [DOI] [PubMed] [Google Scholar]
- Simpson ER, Clyne C, Rubin G, Boon WC, Robertson K, Britt K, Speed C, Jones M. Aromatase – a brief overview. Annual Review of Physiology. 2002;64:93–127. doi: 10.1146/annurev.physiol.64.081601.142703. [DOI] [PubMed] [Google Scholar]
- Chen SU, Besman MJ, Sparkes RS, Zollman S, Klisak I, Mohandas T, Hall PF, Shively JE. Human aromatase – cDNA cloning, Southern blot analysis, and assignment of the gene to chromosome-15. DNA. 1988;7:27–38. doi: 10.1089/dna.1988.7.27. [DOI] [PubMed] [Google Scholar]
- Sebastian S, Bulun SE. A highly complex organization of the regulatory region of the human CYP19 (aromatase) gene revealed by the Human Genome Project. Journal of Clinical Endocrinology and Metabolism. 2001;86:4600–4602. doi: 10.1210/jc.86.10.4600. [DOI] [PubMed] [Google Scholar]
- Carpino A, Rago V, Pezzi V, Carani C, Ando S. Detection of aromatase and estrogen receptors (ERalpha, ERbeta1, ERbeta2) in human Leydig cell tumor. European Journal of Endocrinology. 2007;157:239–244. doi: 10.1530/EJE-07-0029. [DOI] [PubMed] [Google Scholar]
- Brodie A, Inkster S, Yue W. Aromatase expression in the human male. Molecular and Cellular Endocrinology. 2001;178:23–28. doi: 10.1016/S0303-7207(01)00444-0. [DOI] [PubMed] [Google Scholar]
- Coen P, Kulin H, Ballantine T, Zaino R, Frauenhoffer E, Boal D, Inkster S, Brodie A, Santen R. An aromatase-producing sex-cord tumor resulting in prepubertal gynecomastia. New England Journal of Medicine. 1991;324:317–322. doi: 10.1056/NEJM199101313240507. [DOI] [PubMed] [Google Scholar]
- Bulun SE, Rosenthal IM, Brodie AM, Inkster SE, Zeller WP, DiGeorge AM, Frasier SD, Kilgore MW, Simpson ER. Use of tissue-specific promoters in the regulation of aromatase cytochrome P450 gene expression in human testicular and ovarian sex cord tumors, as well as in normal fetal and adult gonads. Journal of Clinical Endocrinology and Metabolism. 1993;77:1616–1621. doi: 10.1210/jc.77.6.1616. [DOI] [PubMed] [Google Scholar]
- Sasano H, Nakashima N, Matsuzaki O, Kato H, Aizawa S, Sasano N, Nagura H. Testicular sex cord-stromal lesions: immunohistochemical analysis of cytokeratin, vimentin and steroidogenic enzymes. Virchows Archiv. A, Pathological Anatomy and Histopathology. 1992;421:163–169. doi: 10.1007/BF01607050. [DOI] [PubMed] [Google Scholar]
- Sirianni R, Chimento A, Malivindi R, Mazzitelli I, Ando S, Pezzi V. Insulin-like growth factor-I, regulating aromatase expression through steroidogenic factor 1, supports estrogen-dependent tumor Leydig cell proliferation. Cancer Research. 2007;67:8368–8377. doi: 10.1158/0008-5472.CAN-06-4064. [DOI] [PubMed] [Google Scholar]
- Pezzi V, Sirianni R, Chimento A, Maggiolini M, Bourguiba S, Delalande C, Carreau S, Ando S, Simpson ER, Clyne CD. Differential expression of steroidogenic factor-1/adrenal 4 binding protein and liver receptor homolog-1 (LRH-1)/fetoprotein transcription factor in the rat testis: LRH-1 as a potential regulator of testicular aromatase expression. Endocrinology. 2004;145:2186–2196. doi: 10.1210/en.2003-1366. [DOI] [PubMed] [Google Scholar]
- Chand AL, Herridge KA, Howard TL, Simpson ER, Clyne CD. Tissue-specific regulation of aromatase promoter II by the orphan nuclear receptor LRH-1 in breast adipose stromal fibroblasts. Steroids. 2011;76:741–744. doi: 10.1016/j.steroids.2011.02.024. [DOI] [PubMed] [Google Scholar]
- Sierens J, Jakody I, Poobalan Y, Meachem SJ, Knower K, Young MJ, Sirianni R, Pezzi V, Clyne CD. Localization and regulation of aromatase liver receptor homologue-1 in the developing rat testis. Molecular and Cellular Endocrinology. 2010;323:307–313. doi: 10.1016/j.mce.2010.03.001. [DOI] [PubMed] [Google Scholar]
- Carlone DL, Richards JS. Functional interactions, phosphorylation, and levels of 3′,5′-cyclic adenosine monophosphate-regulatory element binding protein and steroidogenic factor-1 mediate hormone-regulated and constitutive expression of aromatase in gonadal cells. Molecular Endocrinology. 1997;11:292–304. doi: 10.1210/me.11.3.292. [DOI] [PubMed] [Google Scholar]
- Young M, McPhaul MJ. A steroidogenic factor-1-binding site and cyclic adenosine 3′,5′-monophosphate response element-like elements are required for the activity of the rat aromatase promoter in rat Leydig tumor cell lines. Endocrinology. 1998;139:5082–5093. doi: 10.1210/en.139.12.5082. [DOI] [PubMed] [Google Scholar]
- Sirianni R, Chimento A, De Luca A, Zolea F, Carpino A, Rago V, Maggiolini M, Ando S, Pezzi V. Inhibition of cyclooxygenase-2 down-regulates aromatase activity and decreases proliferation of Leydig tumor cells. Journal of Biological Chemistry. 2009;284:28905–28916. doi: 10.1074/jbc.M109.041020. [DOI] [PMC free article] [PubMed] [Google Scholar]
- Knappskog S, Chrisanthar R, Staalesen V, Borresen-Dale AL, Gram IT, Lillehaug JR, Lonning PE. Mutations and polymorphisms of the p21B transcript in breast cancer. International Journal of Cancer. 2007;121:908–910. doi: 10.1002/ijc.22777. [DOI] [PubMed] [Google Scholar]
- Bulun SE, Sebastian S, Takayama K, Suzuki T, Sasano H, Shozu M. The human CYP19 (aromatase P450) gene: update on physiologic roles and genomic organization of promoters. Journal of Steroid Biochemistry and Molecular Biology. 2003;86:219–224. doi: 10.1016/S0960-0760(03)00359-5. [DOI] [PubMed] [Google Scholar]
- Clyne CD, Speed CJ, Zhou J, Simpson ER. Liver receptor homologue-1 (LRH-1) regulates expression of aromatase in preadipocytes. Journal of Biological Chemistry. 2002;277:20591–20597. doi: 10.1074/jbc.M201117200. [DOI] [PubMed] [Google Scholar]
- Khan Z, Khan N, Tiwari RP, Sah NK, Prasad GB, Bisen PS. Biology of Cox-2: an application in cancer therapeutics. Current Drug Targets. 2011;12:1082–1093. doi: 10.2174/138945011795677764. [DOI] [PubMed] [Google Scholar]


