

Abstract
Prostate-Specific Antigen (PSA), a serine protease belonging to the human kallikrein family, is best known as a prostate cancer biomarker. Emerging evidence suggests that PSA may also play a salient role in prostate cancer development and progression. With large amounts of enzymatically active PSA continuously and selectively produced by all stages of prostate cancer, PSA is an attractive target. PSA inhibitors, therefore, may represent a promising class of therapeutics and/or imaging agents. PSA displays chymotrypsin-like specificity, cleaving after hydrophobic residues, in addition to possessing a unique ability to cleave after glutamine in the P1 position. In this study, we investigated the structural motifs of the PSA S1 pocket that give it a distinct architecture and specificity when compared to the S1 pocket of chymotrypsin. Using the previously described PSA substrate Ser-Ser-Lys-Leu-Gln (SSKLQ) as a template, peptide aldehyde based inhibitors containing novel P1 aldehydes were made and tested against both proteases. Glutamine derivative aldehydes were highly specific for PSA while inhibitors with hydrophobic P1 aldehydes were potent inhibitors of both proteases with Ki values < 500 nM. The crystal structure of PSA was used to generate a model that allowed GOLD docking studies to be performed to further understand the critical interactions required for inhibitor binding to the S1 pockets of PSA and chymotrypsin. In conclusion, these results provide experimental and structural evidence that the S1 specificity pocket of PSA is distinctly different from that of chymotrypsin and that the development of highly specific PSA inhibitors is feasible.
INTRODUCTION
Prostate-Specific Antigen is a member of the kallikrein family of serine proteases where it is known as kallikrein-related peptidase 3 (KLK3). The expression of PSA is highly restricted to normal and malignant prostate epithelial cells in men and, for this reason, PSA is used extensively as a biomarker to screen for prostate cancer, to detect recurrence after definitive therapy and to follow response to treatment in the metastatic disease setting (1,2). The major physiologic substrates for PSA appear to be the gel-forming proteins in freshly ejaculated semen, semenogelin I (SgI) and semenogelin II (SgII) which are synthesized and secreted by the seminal vesicles (3–5). Active PSA in the seminal fluid cleaves preferentially after tyrosyl and glutaminyl peptide bonds to generate multiple soluble fragments of SgI and SgII (3,4). PSA can also cleave a number of growth regulatory proteins that are important in cancer growth and survival. These include Insulin Growth Factor Binding Proteins (IGFBP) 2, 3, and 5, (6), PTH-related protein (7,8), latent TGF-β2 (9), and extracellular matrix components fibronectin, and laminin (10). The exclusive production of PSA by prostate cancers coupled with evidence of PSA’s role in prostate cancer progression, suggests that PSA inhibition may represent a novel therapeutic strategy for the treatment of prostate cancer.
Whereas most of the other kallikreins have trypsin-like proteolytic activity (1,2), PSA is considered a chymotrypsin-like protease based on similarities with chymotrypsin in the S1 specificity pocket of the catalytic site and its preference for cleaving after hydrophobic residues in the P1 position. While PSA has some similarity to chymotrypsin in its preference for amino acids at the P1 position, PSA also displays enzymatic properties that differentiate it from chymotrypsin and other serine proteases. These differences suggest that there may be highly specific protein substrates for PSA that are not yet identified. While a number of bacterial and viral proteases can cleave after glutamine, PSA is one of the few known mammalian serine proteases that can cleave after glutamine residues present in a known physiologic substrate (i.e. Sg I and II) (5, 11,12). PSA cleavage sites within Sg I and II have been mapped and of the 29 mapped sites, ~40% contain Gln in the P1 position (4,5). Although PSA, like chymotrypsin, can cleave the Leu358-Ser359 linkage within the serum protease inhibitor α1-antichymotrypsin (ACT) to form a stable complex, the classic chymotrypsin-inhibitors tosyl-phenylalanine chloromethylketone (TPCK) and phenylmethylsulphonyl fluoride (PMSF) are poor PSA inhibitors. PSA is also not inhibited well by the panel of protease inhibitors present in commercially available protease inhibitory cocktails such as Complete Protease Inhibitor (unpublished data).
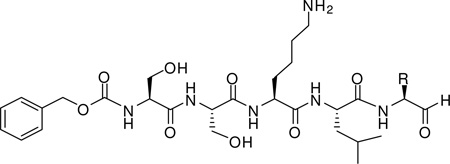
These combined results suggest that PSA has unique substrate requirements compared to chymotrypsin that would allow for the development of highly-specific inhibitors of PSA’s proteolytic activity. In this study to generate PSA specific inhibitors, peptide aldehyde inhibitors and molecular modeling were used to identify the structural differences between PSA and chymotrypsin in the S1 pocket that underlie their differences in substrate recognition. To evaluate these differences we used a previously described PSA specific substrate with the sequence Ser-Ser-Lys-Leu-Gln (SSKLQ) (13), generated from the semenogelin cleavage map, as the template for generating the peptide aldehyde based inhibitors of PSA. To probe differences in substrate recognition, we focused on the S1 subsite which determines the characteristic specificity of the protease. We generated peptide aldehydes using the SSKL-X template, substituting naturally and unnaturally occurring amino acids in the P1 position and compared their ability to inhibit PSA and chymotrypsin. Molecular models of the S1 subsite for both PSA and chymotrypsin were generated, based on previously published crystal structures, in order to evaluate the key interactions between P1 side chains and the specific amino acids lining the S1 pocket. The overarching goal of this study was to gain structural insights into the P1 specificity of PSA and determine salient structural motifs that could then be used for the further design of more potent and specific peptide (boronic acids, chloromethyl ketones) and non-peptide based inhibitors that could be used to develop targeted therapeutics and imaging agents for the treatment and detection of prostate cancer.
METHODS
Materials
PSA was purchased from Calbiochem (San Diego, CA). The fluorescent PSA substrate, Morpholinocarbonyl-Ser-Arg-Lys-Gln-Gln-Tyr-aminomethyl coumarin (Mu-SRKSQQY-AMC), was selected as the PSA substrate based on a previous characterization study (13,14) and was custom synthesized by California Peptides (Napa Valley, CA). Bovine α-Chymotrypsin and the chymotrypsin substrate, N-succinyl-Ala-Ala-Phe-aminomethyl coumarin (Suc-AAF-AMC), were purchased from Sigma-Aldrich (St. Louis, MO). All Fmoc amino acids used in standard Fmoc solid-phase peptide synthesis were purchased from AnaSpec (San Jose, CA). Cbz protected amino acids were purchased from Novabiochem (San Diego, CA). Unless noted, all other reagents were from Sigma-Aldrich (St. Louis, MO).
Peptide Aldehyde Synthesis
Compounds 1–3, 9, 10, 12, 15 – 17, were synthesized by oxidizing the corresponding Fmoc-amino alcohol to an aldehyde using IBX-PS resin (Novabiochem Tech Bulletin) and loading the resulting aldehyde onto H-Thr-Gly-NovaSyn TG resin according to the manufacturer’s conditions. Fmoc solid-phase synthesis was then performed on an AAPPTEC Apex 396 peptide synthesizer. Side chain deprotection while on the H-Thr-Gly-NovaSyn TG resin was done by treating the resin with neat TFA (2 × 45 min). The peptide aldehydes were cleaved from the resin using three treatments of AcOH/H2O/CH2Cl2/MeOH/ (10:5:64:21) for 30 min. Precursor compounds of 2–3 were synthesized as previously described by Malcolm et al. (15), compounds 4 – 8, 11, were synthesized as described by Webber et al. (16) and compounds 13–14 as described previously (14,17). The peptide aldehydes were characterized using mass spectrometry (Bruker 3000 Esquire ESI), NMR (400 MHz Bruker Ultrashield) and were HPLC purified on a Waters Delta 600 semi-prep system using a Phenomenex Luna 10u C18 250 × 10 mm semi-prep column. The HPLC gradient profile was linear starting at 100% solvent A (0.1% TFA in H2O) and changing to 100% solvent B (0.1% TFA in acetonitrile) over 25 min with a flow rate of 8 ml/min. For additional information see the Supporting Information.
Enzymatic Assays and Inhibition Kinetics
The assay for PSA activity was performed as previously described (17,18). The PSA concentration per assay was 2.5 µg/ml (2 nM active PSA) with a PSA substrate concentration of 300 µM. Substrate hydrolysis ± inhibitor over a range of concentrations was monitored by measuring fluorescence change secondary to AMC release Complete hydrolysis of the substrate was maintained below 5% to ensure that the substrate concentration was essentially constant. The inhibition constant values were determined using the method of progress curves of Nagase and Salvesen (19) as previously described (14). To assess inhibitor specificity, chymotrypsin (2 nM) was assayed with 25 µM of suc-AAF-AMC in the presence or absence of inhibitor over a range of concentrations.
Molecular Modeling & Docking
The recently solved crystal structure of PSA in complex with a substrate acyl-enzyme intermediate (PDB Code: 2ZCK) (20) was obtained from the RCSB protein data bank and prepared for molecular modeling analysis using the MOE modeling package (CCG, Montreal). The Fab antibody fragment and one of the protein chains in the PSA dimer was removed in order to extract a single molecule of PSA enzyme in complex with the peptide substrate. Furthermore, the peptide substrate, crystallographic water molecules and the carbohydrate side chain at Asn62 residue were deleted, resulting in a PSA molecule with an empty catalytic pocket. Subsequently, hydrogens were added to the heavy atoms and the residues were assigned the appropriate protonation states at pH 7.4. Specifically, the histidine residues were kept in a singly protonated state at Nε1. The catalytic Ser195 residue was deprotonated to mimic the covalent acyl-enzyme conformation as observed in the crystal structure. The resulting PSA molecule was saved in a Tripos MOL2 format and transported to GOLD software (CCDC, Cambridge) for subsequent docking calculations.
The α-chymotrypsin molecule was prepared similarly using the crystal structure (PDB code: 1YPH) obtained from the RCSB protein data bank. The resulting chymotrypsin molecule with hydrogens was saved in the MOL2 format and transported to GOLD software for subsequent docking calculations. In order to elucidate the structural and molecular differences, the final PSA and chymotrypsin molecules were structurally superposed using the Align module of the MOE software.
The aldehyde ligands with corresponding P1 residues were built in the MOE package using the Builder module. Partial charges were assigned using the CHARMM22 force field. The inhibitor ligands were acetylated at the N-terminus to mimic the peptide backbone of a larger peptide and to remove the artificial effects of a charged amine at the N-terminal. These ligands were energy minimized and saved in MOL2 format and transported into GOLD software for subsequent docking runs. The GOLD v3.2 program (CCDC, Cambridge, UK) was used to dock peptide inhibitors into the catalytic site of PSA and chymotrypsin as previously described. A scaffold constraint was used to restrict the inhibitor peptide backbone into the canonical conformation observed for the peptide substrate in the PSA and chymotrypsin crystal structure. As an internal validation of the docking methodology, the peptide substrate KGISSQY used to generate the published PSA crystal structure, was re-docked into the empty catalytic pocket of the all atom PSA structure using the same docking protocols. The conformation of the top scoring pose was compared to its crystal structure conformation in order to judge the success of the docking methodology in reproducing the crystal structure confirmation.
RESULTS
The recognition of glutamine in the P1 position of peptide substrates appears to be relatively unique to PSA. The first set of studies was designed to evaluate this specificity with glutamine containing aldehyde inhibitors using the SSKL-X template (13). The evaluation of P1 glutamine aldehyde inhibitors is problematic because the carboxamide side chain reacts with the aldehyde functional group to form a cyclic hemiaminal. While NMR analysis confirmed that the full length glutamine aldehyde 1 was in equilibrium between a cyclic hemiaminal and an aldehyde (data not shown), it was still a modest inhibitor of PSA with a Ki of 45.21 µM (Table 1). Although cyclization does occur and is thermodynamically favored, the side chain is still potent and able to form favorable interactions with the bottom of the S1 pocket. This suggested that a non-cyclizable glutamine aldehyde derivative would be an even more potent PSA inhibitor. Thus, the non-cyclizable γ-N,N-dimethyl glutamine derivative 2 had a nearly twenty fold lower Ki of 2.53 µM compared to 1. PSA inhibitor 2 still possessed the predicted desired motif: a side chain with two hydrophobic methylenes, an amide carbonyl and a nitrogen with a lone pair of electrons that were in the vicinity of other polar residues and could act as hydrogen bond acceptors. A decrease in the side chain length by one methylene, as in the case of γ-N,N-dimethyl asparagine 3, affected the ability of the amide group to reach down into the bottom of the S1 pocket, and lead to a less potent inhibitor with a Ki of 13.09 µM for PSA (Table 1).
Table 1.
The chemical structures, Ki values and GOLD scores of the PSA inhibitors used in this study.
 | |||
|---|---|---|---|
| Compound | R | Ki (µM)a | GOLD Score (PSA) |
| 1 | CH2CH2CONH2 | 45.21 ± 3.89 | 33.45 |
| 2 | CH2CH2CON(CH3)2 | 2.53 ± 0.13 | 30.66 |
| 3 | CH2CON(CH3)2 | 13.09 ± 0.88 | 19.82 |
| 4 | CH2NHCHO | 0.91 ± 0.06 | 29.54 |
| 5 | CH2NHCOCH3 | 3.91 ± 0.35 | 29.56 |
| 6 | CH2NHCOCH2CH3 | 9.84 ± 0.33 | 34.13 |
| 7 | CH2NHCOCH(CH3)2 | 13.28 ± 0.93 | 33.25 |
| 8 | CH2NHCO(C6H5) | > 25 | 27.55 |
| 9 | CH2CH2SCH3 | 3.84 ± 0.21 | 34.77 |
| 10 | CH2CH2SOCH3 | 7.25 ± 0.44 | 38.27 |
| 11 | CH2CH2CN | 8.14 ± 0.29 | 27.47 |
| 12 | CH(CH3)2 | > 100 | 16.16 |
| 13 | CH2CH(CH3)2 | 6.51 ± 0.25 | 26.37 |
| 14 | CH2CH2CH2CH3 | 11.24 ± 0.26 | 30.93 |
| 15 | (C6H5) | > 100 | 22.92 |
| 16 | CH2(C6H5) | 0.57 ± 0.04 | 38.84 |
| 17 | CH2(C6H5)OH | 0.37 ± 0.02 | 39.66 |
Value reported is for n = 3 (± S.E.).
The next series of inhibitors tested were the isostere replacement derivatives of glutamine. On the basis of the results with the non-cyclizable derivatives 2 and 3, this series included inhibitors whose side chain length was long enough to avoid any unfavorable interactions with the walls of the S1 pocket. With these derivatives, a pronounced increase in the ability to inhibit PSA was seen. The best compound of this series, the N-formyl derivative 4, had a Ki of 0.909 µM for PSA (Table 1). To determine whether bulkier side chains on the P1 substituent inhibitors produced steric clashes with the walls of the S1 pocket, compounds 5–8 were generated. Compound 5, with the acetyl group on the γ-amine, had a higher Ki of 3.91 µM. The propyl side chain of 6, made it a less effective inhibitor than 5 with a Ki nearly three times as high. In general, the Ki values for the compounds steadily increased as the alkyl chain increased in size and branching. These data highlight the importance of the interplay between sterics and electronics in the S1 pocket.
Positional scanning studies have documented the ability of PSA to cleave after methionine residues (21). Peptide aldehydes containing a P1 methionine 9 and methionine sulfoxide 10 were able to inhibit PSA, with 9 having a lower Ki of 3.84 µM and 10 possessing a nearly two fold higher Ki of 7.25 µM (Table 1). Additionally, the glutamine aldehyde derivative 11, in which the carboxamide of the glutamine side chain was replaced with a nitrile group that can act as a hydrogen bond acceptor, was also able to inhibit PSA (Ki = 8.14 µM).
The peptide aldehydes with hydrophobic P1 aldehydes containing natural and unnatural amino acids were next tested. Compound 12, the full length valine aldehyde, was not an inhibitor of PSA with a Ki > 100 µM (Table 1). By increasing the side chain of the valine by one methylene to the leucine aldehyde 13, the Ki decreased to 6.51 µM, emphasizing that while β-branching is not well-tolerated, γ-branching is allowed. The norleucine aldehyde 14, containing the longest hydrocarbon side chain out of the series, worked as an inhibitor; however, with a higher Ki of 11.24 µM. The P1 phenylglycine aldehyde derivative 15 did not inhibit PSA with a Ki > 100 µM. Moving from 15 to the phenylalanine aldehyde 16, a marked decrease in the Ki was observed yielding a sub-micromolar Ki of 0.57 µM (Table 1). The substitution of a phenolic side chain as in the tyrosine aldehyde 17 produced an even more potent PSA inhibitor with a Ki of 0.37 µM (Figure 2A.).
Figure 2.

Surface representation of the S1 pocket of PSA (left) and bovine α-chymotrypsin (right). The P1 tyrosine residue is shown as a yellow ball-and-stick model. The polar hydroxyl moiety of the bound residue is depicted in purple. Surface colors represent the following motifs: green is a mostly hydrophobic surface composed of aromatic and/or aliphatic carbons, red is a surface formed by polar oxygen atoms (backbone and side chain), blue is a polar surface formed by nitrogen atoms and yellow is a surface formed by cysteine disulfide bonds.
Structural Features of the S1 Pocket of PSA
The sequence alignment of all 15 human kallikreins and bovine α-chymotrypsin (Fig. 1.A) shows that the region spanning the S1 pocket contains a number of highly conserved residues that are critical for the structural integrity of the pocket and indirectly responsible for the maintenance of enzymatic activity. Specifically, residues such as Cys191, Cys220, Pro225 and Ser214 form crucial elements of the architecture surrounding the S1 pocket (22). Conversely, the variable regions of residues 183–190 and 221–224 within a given serine protease dictate the specificity of substrates and inhibitors for the individual protease.
Figure 1.

A, Sequence alignment of the 15 human kallikreins and bovine α-chymotrypsin. Only the residues spanning the S1 pocket of serine proteases are presented. The residues highlighted in yellow are critical for the P1 specificities of respective protease. The catalytic Ser195 residue is highlighted in red. B, Ribbon representation of the S1 specificity pocket of Prostate-Specific Antigen. The protease residues lining the pocket are shown in cyan while the catalytic histidine and serine residues are shown in magenta. The S1 tyrosine residue of peptide substrate KGISSQY is shown in yellow.
For all serine proteases, substrate and inhibitor recognition is mainly governed by the binding of the P1 residue to the S1 pocket of the enzyme (Fig. 1.B). The amino acid residue at the bottom of the S1 pocket is therefore the key determinant for the P1 preference. For the majority of the kallikreins, this residue is aspartic acid. Thus, the majority of kallikreins exhibit trypsin-like specificity, cleaving after basic amino acids such as arginine and lysine. In contrast, for PSA the residue at the bottom of the pocket is serine (i.e. Ser189). Chymotrypsin also has serine in this position and like PSA, it cleaves after hydrophobic residues. Two other kallikreins also have a unique (i.e. non-aspartic acid) amino acid in the S1 pocket with KLK7 having asparagine and KLK9 having glycine at this position.
The Ser189 residue in the PSA S1 pocket is flanked by the polar side chains of Ser226 and Thr190 (Fig. 1.B). The alignment of the polar hydroxyl moieties of these residues at the bottom of the pocket results in a cavity that is polar at the bottom, but hydrophobic on the sides due to the aliphatic parts of the side chains forming the walls of the cavity. As shown in Fig. 1.B, the aromatic ring of a P1 tyrosine residue is optimally sandwiched between the hydrophobic cavity walls while making a hydrogen bond with the backbone carbonyl of the Ser217 residue via its hydroxyl moiety. Thus, a residue like tyrosine with a medium-sized hydrophobic side chain and a polar phenolic group is ideal for binding at the S1 pocket of PSA. Other medium sized hydrophobic side chains such as leucine and norleucine can also interact favorably with this pocket. The other residues, Thr190, Thr213 and Ser226, in the vicinity of the 189-position in the PSA protein are also responsible for the subtle variations in the polarity and hydrophobic character of the S1 binding site. These residues produce a pocket that is truly unique in its binding characteristics (23).
With the crystal structure of PSA now available, it is possible to utilize the true structural information of PSA to decipher the molecular details of the interactions in the S1 pocket. This information can be used to design more specific and potent inhibitors of PSA. Towards this end, we have employed the GOLD docking methodology to explore the binding modes of the 18 synthesized peptide aldehyde inhibitors of PSA described above. The inhibitors with the highest potencies (i.e. 16 and 17) also had the highest GOLD scores of 38.84 and 39.66 (Table 1). Conversely, the compounds with the lowest inhibitory potencies (i.e. 12 and 15) ranked in the bottom tier in terms of their GOLD scores. Overall, for 17 of the peptide aldehyde inhibitors, the Ki values, when converted to their free energy values via log transformations, correlate modestly with the GOLD score as indicated by the correlation coefficient of 0.64 (Supplemental Data). The absence of a high correlation between Ki values and the GOLD scores can be explained by the fact that the strength of binding in the S1 pocket as quantified by the GOLD score does not take into account the entropic and solvation contribution of binding. Also, protein breathing at the binding site is not allowed during GOLD docking, resulting in possible inaccuracies in the exact magnitude of the energetic interactions. While it is not possible to use the GOLD score solely to differentiate between inhibitors with Ki values in a narrow range, the scores can be used to bucket the inhibitors into three different categories: those inhibitors with a GOLD score in the range of 16–24, 26–36 and =>38 with Ki values typically in the range of 100 µM, 10–100 µM and ~1µM, respectively.
Effects of PSA Inhibitors on Chymotrypsin Activity
The results obtained from the PSA inhibitor studies and the corresponding docking analysis helped to define the key interactions between the amino acids in the S1 pocket of PSA and the substituents in the P1 position of the inhibitors. In order to better understand and define the unique substrate specificity for PSA compared to chymotrypsin, the PSA peptide aldehyde inhibitors were tested for their ability to inhibit chymotrypsin. The full length glutamine aldehyde 1, had no ability to inhibit chymotrypsin with a Ki for chymotrypsin > 1000 µM (Table 2). Likewise, the non-cyclizable γ-N,N-dimethyl glutamine derivative 2 did not inhibit chymotrypsin to any degree nor did the glutamine isostere 4. Both had Ki values for chymotrypsin above 100 µM. The methionine peptide aldehyde 9 showed a similar pattern, being highly specific for PSA and not for chymotrypsin with a chymotrypsin Ki value above 100 µM. As expected, Compounds 16 and 17 which are peptide aldehydes with hydrophobic P1 residues, were almost equally potent for PSA and chymotrypsin. Since chymotrypsin is known to cleave after tryptophan residues, the tryptophan aldehyde was tested against chymotrypsin. The tryptophan aldehyde was a poor inhibitor of PSA with a Ki of > 50 µM, but a remarkably good inhibitor for chymotrypsin with a Ki below 100 nM (Table 2).
Table 2.
The specificity of six peptide aldehydes for PSA versus chymotrypsin and the corresponding GOLD scores for each protease.
| Compound | PSA Ki (µM)a |
Chymotrypsin Ki (µM)a |
Chy/PSA Ratiob | PSA GOLD Score |
Chymotrypsin GOLD Score |
|---|---|---|---|---|---|
| 1 | 45.21 ± 3.89 | > 1000 | > 22 | 33.44 | 16.53 |
| 2 | 2.53 ± 0.13 | > 100 | > 40 | 30.66 | 14.27 |
| 4 | 0.91 ± 0.06 | > 100 | > 110 | 29.54 | 19.25 |
| 9 | 3.84 ± 0.21 | > 100 | > 26 | 34.78 | 23.07 |
| 16 | 0.57 ± 0.04 | 0.62 ± 0.05 | 1.08 | 38.84 | 28.38 |
| 17 | 0.37 ± 0.02 | 0.29 ± 0.03 | 0.78 | 39.66 | 28.86 |
Value reported is for n = 3 (± S.E.).
PSA selectivity in terms of (Chymotrypsin Ki)/(PSA Ki).
To better understand the structural differences between these two proteases that underlie the differences in inhibitory potency, we used a similar GOLD docking methodology to compare the binding modes of seven peptide aldehyde inhibitors for both PSA and chymotrypsin. Table 2 presents the respective Ki values and the GOLD scores of these compounds when their P1 side chain was docked in the S1 pocket of either protease. Remarkably, the difference in the potency of 1, 2, 4 and 9 against PSA vs. chymotrypsin was consistent with the respective differences in GOLD scores. A drastic difference was especially notable for compounds 1, 2, and 4. These compounds, all highly specific for PSA, had low GOLD scores for chymotrypsin (16.53, 14.27, 19.25) and correspondingly high Ki values (> 100µM). Similarly, 16 and 17 had high GOLD scores for PSA and chymotrypsin and were equally potent inhibitors of both proteases.
DICUSSION
These results expand upon our previous study in which we defined the potency of a series of peptidyl boronic acid based inhibitors of PSA and identified an inhibitor, Z-SSKL(boro)L, that had a Ki for PSA of 65 nM (14). This lead inhibitor had a ~ 65-fold higher Ki for chymotrypsin, even though it contained a hydrophobic leucine in the P1 position. For this earlier study, we employed a three-dimensional structural model of PSA that was developed based on the crystal structure of porcine kallikrein (PDB code: 2PKA) and the human tissue kallikrein KLK1 (PDB code: 1SPJ) (14,18). This model was used to characterize the binding interactions between this “lead” inhibitor and the PSA catalytic site. Subsequently, the crystal structure of PSA bound to an antibody has been published. In the current study, we revised our earlier model based on the published crystal structure and used this more refined model to characterize peptide aldehyde inhibitor binding to the S1 pocket of PSA.
PSA and chymotrypsin have previously been considered similar in their P1 specificity because of the presence of Ser189 at the bottom of the S1 pocket in both proteases. For this reason, when describing its enzymatic activity, PSA is typically described as a “chymotrypsin-like protease”. However, here we document the important differences in the physical and electrostatic characteristics of the S1 pocket of these two serine proteases. In the case of PSA, the presence of the polar hydroxyl side chain of Ser189, Thr190, Thr213 and Ser226 provides a noticeable polar character to its shallow bottom (red region in Fig. 2). In contrast, the presence of Val213 and Gly226 produces a less polar and more spacious bottom of the S1 cavity of chymotrypsin (Fig. 2). These structural differences in the S1 pocket underlie the significant differences in Ki values observed for PSA compared to chymotrypsin for the many of the inhibitors analyzed in this study.
The preference for glutamine in the P1 position is a unique characteristic of PSA that is not shared by other mammalian serine proteases (11,12). In contrast, chymotrypsin has no ability to cleave after glutamine (13). As described here, chymotrypsin is also not inhibited appreciably by aldehyde inhibitors containing glutamine or glutamine analogs in the P1 position. A comparative analysis of the binding modes of inhibitor 1 (glutamine at P1 position) docked in the S1 pocket of PSA and chymotrypsin respectively (Fig. 3: 1A, 2A) reveals drastic differences in orientation of the glutamine side chain that underlies the marked difference in Ki values for this inhibitor for these two proteases. In the PSA-docked conformation, the amide side chain of glutamine formed a hydrogen bond with Thr190. This hydrogen bond was not observed in the chymotrypsin-docked conformation since chymotrypsin has a serine residue instead of threonine at the 190 position. The amide group of 1 adopts a different orientation in which the carbonyl moiety is pointing towards Met192. This conformation might result in the loss of a hydrogen bond and sub-optimal hydrophobic interactions between the aliphatic portion of P1 sidechain and S1 pocket hydrophobic surface of chymotrypsin.
Figure 3.

Comparison between the P1 side chains of selected inhibitors docked in the S1 pocket of PSA and chymotrypsin respectively. Panels on the left side: 1A-1D, present the binding modes of inhibitors 1, 2, 9, and 17 in the catalytic pocket of PSA. Panels on the right side: 2A-2D, present the same for inhibitors 1, 2, 9, and 17 in the catalytic pocket of chymotrypsin. Inhibitor backbones are depicted in purple. The location of key protease residues relative to the docked inhibitors is pinpointed by ‘*’. The nitrogen and oxygen heavy atoms of inhibitors are delineated by blue and red solid spheres.
Analysis of the binding modes of other inhibitors further highlights the structural differences between the two proteases. The side chain of inhibitor 2 (Fig. 3: 1B, 2B) docked in the S1 pocket with PSA and chymotrypsin showed many similarities with that of inhibitor 1. The orientation of 2 inside of PSA is similar to that of 1 in spite of the fact that the nitrogen of the tertiary amine moiety lacks the ability to function as a hydrogen bond donor. In chymotrypsin, this conformation can result in suboptimal hydrophobic interactions and steric clashes with the S1 pocket corresponding to its weak inhibitory potency. A similar rationale can be applied for inhibitor 9 (methionine at the P1 position) that also docks in a drastically different conformation. In the catalytic pocket of PSA (Fig. 3: 1C), the terminal Cε atom of 9 is oriented toward Tyr228 whereas the same atom is positioned in the vicinity of Ser189 in the catalytic pocket of chymotrypsin (Fig. 3: 2C). In contrast to inhibitor 9, the tyrosine moiety of inhibitor 17 adopts similar conformations (Fig. 3: 1D and 2D) in the S1 pocket of both PSA and chymotrypsin. This is consistent with the equal inhibitor potency of this inhibitor against both PSA and chymotrypsin. It is interesting to note that the tyrosine hydroxyl moiety makes a tight hydrogen bond with the Ser226 sidechain in the PSA catalytic pocket. Since serine at the 226-position is replaced by glycine in chymotrypsin, the hydrogen bond acceptor is supplied by the backbone carbonyl of the Ser190 residue.
In conclusion, the results presented here highlight the unique characteristics of the S1 specificity pocket of PSA that differentiate it from chymotrypsin and other members of the kallikrein family of serine proteases. Based on these unique characteristics, these results also document that the development of a highly specific inhibitor of PSA is feasible. In this regard, we are currently pursuing a strategy to design boronic acid based inhibitors of PSA that can be used to selectively target therapeutic agents to prostate cancer sites. In addition, the exclusive production of PSA by prostate cancers suggests that novel agents for imaging prostate cancer within bone and soft tissue sites can be developed through the incorporation of imaging modalities such as chelating groups into the structure of these PSA-specific inhibitors.
Supplementary Material
Acknowledgments
This work was supported by a Prostate SPORE grant (P50CA58236) to JTI and SRD and a grant from the One-in-Six Foundation, Akron, OH to SRD.
The abbreviations used are
- PSA
Prostate-Specific Antigen
- Sg
semenogelin
- IGFBP
insulin growth factor binding protein
- PTHrP
para-thyrod related protei
- TGF-β2
transforming growth factor β2
- ACT
α1-antichymotrypsin
- TPCK
tosyl-phenylalanine chloromethylketone
- PMSF
phenylmethylsulphonyl fluoride
- Fmoc
9-fluorenylmethyl chloroformate
- Cbz
benzyloxycarbonyl
- Ki
inhibition constant
REFERENCES
- 1.Yousef GM, Diamandis EP. An overview of the kallikrein gene families in humans and other species: emerging candidate tumour markers. Clin. Biochem. 2003;36:443–452. doi: 10.1016/s0009-9120(03)00055-9. [DOI] [PubMed] [Google Scholar]
- 2.Williams SA, Singh P, Isaacs JT, Denmeade SR. Does PSA play a role as a promoting agent during the initiation and/or progression of prostate cancer? Prostate. 2007;67:312–329. doi: 10.1002/pros.20531. [DOI] [PubMed] [Google Scholar]
- 3.Lilja H. A kallikrein-like serine protease in prostatic fluid cleaves the predominant seminal vesicle protein. J. Clin. Invest. 1985;76:1899–1903. doi: 10.1172/JCI112185. [DOI] [PMC free article] [PubMed] [Google Scholar]
- 4.Lilja H, Abrahamsson PA, Lundwall A. Semenogelin, the predominant protein in human semen. Primary structure and identification of closely related proteins in the male accessory sex glands and on the spermatozoa. J. Biol. Chem. 1989;264:1894–1900. [PubMed] [Google Scholar]
- 5.Malm J, Hellman J, Hogg P, Lilja H. Enzymatic action of prostate-specific antigen (PSA or hK3): substrate specificty and regulation by Zn2+, a tight-binding inhbitor. Prostate. 2000;45:132–139. doi: 10.1002/1097-0045(20001001)45:2<132::aid-pros7>3.0.co;2-3. [DOI] [PubMed] [Google Scholar]
- 6.Cohen P, Graves HC, Peehl DM, Kamarei M, Giudice LC, Rosenfeld RG. Prostate-specific antigen (PSA) is an insulin-like growth factor binding protein-3 protease found in seminal plasma. J. Clin. Endocrinol. Metab. 1992;75:1046–1053. doi: 10.1210/jcem.75.4.1383255. [DOI] [PubMed] [Google Scholar]
- 7.Iwamura M, Hellman J, Cockett AT, Lilja H, Gershagen S. Alteration of the hormonal bioactivity of parathyroid hormone-related protein (PTHrP) as a result of limited proteolysis by prostate-specific antigen. Urology. 1996;48:317–325. doi: 10.1016/S0090-4295(96)00182-3. [DOI] [PubMed] [Google Scholar]
- 8.Cramer SD, Chen Z, Peehl DM. Prostate specific antigen cleaves parathyroid hormone-related protein in the PTH-like domain: inactivation of PTHrP-stimulated cAMP accumulation in mouse osteoblasts. J. Urol. 1996;156:526–531. doi: 10.1097/00005392-199608000-00076. [DOI] [PubMed] [Google Scholar]
- 9.Dallas SL, Zhao S, Cramer SD, Chen Z, Peehl DM, Bonewald LF. Preferential production of latent transforming growth factor -2 by primary prostatic epithelial cells and its activation by prostate-specific antigen. J. Cell. Physiol. 2005;202:361–370. doi: 10.1002/jcp.20147. [DOI] [PubMed] [Google Scholar]
- 10.Lilja H, Piironen TP, Rittenhouse HG, Mikolajczyk SD, Slawin KM. Comprehensive Textbook of Genitourinary Oncology. Philadelphia: Lippincott Williams and Wilkins Publishers; 2000. pp. 638–650. [Google Scholar]
- 11.Dragovich PS, Prins TJ, Zhou R, Webber SE, Marakovits JT, Fuhrman SA, Patrick AK, Matthews DA, Lee CA, Ford CE, Burke BJ, Rejto PA, Hendrickson TF, Tuntland T, Brown EL, Meador JW, Ferre RA, Harr JE, Kosa MB, Worland ST. Tripeptide aldehyde inhibitors of human rhinovirus 3C Protease: design, synthesis, biological evaluation, and co-crystal structure solution of P1 glutamine isosteric replacements. J. Med. Chem. 1999;42:1213–1224. [Google Scholar]
- 12.Helmerhorst EJ, Sun X, Salih E, Oppenheim FG. Identification of lys-pro-gln as a novel cleavage site specificity of saliva-associated proteases. J. Biol. Chem. 2008;283:19957–19966. doi: 10.1074/jbc.M708282200. [DOI] [PMC free article] [PubMed] [Google Scholar]
- 13.Denmeade SR, Lou W, Malm J, Lovgren J, Lilja H, Isaacs JT. Specific and efficient peptide substrates for assaying the proteolytic activity of prostate-specific antigen. Cancer Res. 1997;57:4924–4930. [PMC free article] [PubMed] [Google Scholar]
- 14.LeBeau AM, Singh P, Isaacs JT, Denmeade SR. Potent and selective peptidyl boronic acid inhibitors of the serine protease prostate-specific antigen. Chem. Biol. 2008;15:665–674. doi: 10.1016/j.chembiol.2008.05.020. [DOI] [PMC free article] [PubMed] [Google Scholar]
- 15.Malcolm BA, Lowe C, Shechosky S, McKay RT, Yang CC, Shah VJ, Simon RJ, Vederas JC, Santi DV. Peptide aldehyde inhibitors of hepatitis A virus 3C proteinase. Biochemistry. 1995;34:8172–8179. doi: 10.1021/bi00025a024. [DOI] [PubMed] [Google Scholar]
- 16.Webber SE, Okano K, Little TL, Reich SH, Xin Y, Fuhrman SA, Matthews DA, Love RA, Hendrickson TF, Patrick AK. Tripeptide aldehyde inhibitors of human rhinovirus 3C protease: design, synthesis, biological evaluation, and cocrystal structure solution of P1 glutamine isosteric replacements. J. Med. Chem. 1998;41:2786–2805. doi: 10.1021/jm980071x. [DOI] [PubMed] [Google Scholar]
- 17.Kappel JC, Barany G. Backbone amide linker (BAL) strategy for N-9-fluorenylmethoxycarbonyl (Fmoc) solid-phase synthesis of peptide aldehydes. J. Peptide Sci. 2005;11:525–535. doi: 10.1002/psc.614. [DOI] [PubMed] [Google Scholar]
- 18.Singh P, Williams SA, Shah MH, Lectka T, Pritchard GJ, Isaacs JT, Denmeade SR. Mechanistic insights into the inhibition of prostate-specific antigen by β-Lactam class compounds. Proteins. 2008;70:1416–1428. doi: 10.1002/prot.21676. [DOI] [PubMed] [Google Scholar]
- 19.Salvesen GS, Nagase N. In: Proteolytic Enzymes. Second Edition. Benyon R, Bond JS, editors. Oxford: Oxford University Press; 2001. pp. 131–147. [Google Scholar]
- 20.Menez R, Michel S, Muller BH, Bossus M, Ducancel F, Jolivet-Reynaud C, Stura EA. Crystal structure of a ternary complex between human prostate-specific antigen, its substrate acyl intermediate and an activating antibody. J. Mol. Biol. 2008;376:1021–1033. doi: 10.1016/j.jmb.2007.11.052. [DOI] [PubMed] [Google Scholar]
- 21.Debela M, Magdolen V, Schechter N, Valachova M, Lottspeich F, Craik CS, Choe Y, Bode W, Goettig P. Specificity profiling of seven human tissue kallikreins reveals individual subsite preferences. J. Bio. Chem. 2006;281:25678–25688. doi: 10.1074/jbc.M602372200. [DOI] [PubMed] [Google Scholar]
- 22.Krem MM, Prasad S, Di Cera E. Ser214 is crucial for substrate binding to serine proteases. J. Biol. Chem. 2002;277:40260–40264. doi: 10.1074/jbc.M206173200. [DOI] [PubMed] [Google Scholar]
- 23.Guinto ER, Caccia S, Rose T, Futterer K, Waksman G, Di Cera E. Unexpected crucial role of residue 225 in serine proteases. Proc. Natl. Acad. Sci. U. S. A. 1999;96:1852–1857. doi: 10.1073/pnas.96.5.1852. [DOI] [PMC free article] [PubMed] [Google Scholar]
Associated Data
This section collects any data citations, data availability statements, or supplementary materials included in this article.