Abstract
Visualizing retinal photocoagulation by real-time OCT measurements may considerably improve the understanding of thermally induced tissue changes and might enable a better reproducibility of the ocular laser treatment. High speed Doppler OCT with 860 frames per second imaged tissue changes in the fundus of enucleated porcine eyes during laser irradiation. Tissue motion, measured by Doppler OCT with nanometer resolution, was correlated with the temperature increase, which was measured non-invasively by optoacoustics. In enucleated eyes, the increase of the OCT signal near the retinal pigment epithelium (RPE) corresponded well to the macroscopically visible whitening of the tissue. At low irradiance, Doppler OCT revealed additionally a reversible thermal expansion of the retina. At higher irradiance additional movement due to irreversible tissue changes was observed. Measurements of the tissue expansion were also possible in vivo in a rabbit with submicrometer resolution when global tissue motion was compensated. Doppler OCT may be used for spatially resolved measurements of retinal temperature increases and thermally induced tissue changes. It can play an important role in understanding the mechanisms of photocoagulation and, eventually, lead to new strategies for retinal laser treatments.
OCIS codes: (170.0170) Medical optics and biotechnology, (170.4470) Ophthalmology, (170.4500) Optical coherence tomography, (350.5340) Photothermal effects
1. Introduction
Since the introduction of the photocoagulation in 1959 [1], it had become one of the most successful laser therapies in medicine and the standard therapy for diabetic retinopathy [2, 3], branch vein occlusion [4] and central retinal vein occlusion [5]. Though photocoagulation is more and more replaced by drugs, it is still the usual practice for treating of neovascularization in proliferative diabetic retinopathy and after venous occlusive events [6]. Traditionally, the laser spots are manually positioned by the physician, who also sets the irradiation parameters, i.e the spot size, the applied radiant power, and the irradiation time, according to the subjective evaluation of the appearance of previous lesions. Strength and extension of the coagulated lesions do not only depend on the irradiation parameters, but also on the transmission of the ocular media and the pigmentation of the retina, which both vary between patients. The pigmentation even varies across retina and choroid a by factor up to two and three, respectively [7, 8]. Therefore with fixed irradiation parameters, variations in the coagulation strength and diameter are inevitable. Only a real-time dosimetry during the photocoagulation can guarantee predictable strength and size of the coagulations, which is expected to make the treatment safer and more reproducible. Especially near and sub-threshold therapy concepts [9, 10] would profit from an independent control of the photocoagulation strength. Earlier attempts to use the increase of tissue scattering in the retina [11] or autofluorescence [12] were not successful.
The main parameter, which determines the tissue effects in photocoagulation, is the temperature course in the treated area. Recently time-resolved temperature measurements in the treated area became possible. The non-invasive technique uses an optoacoustic signal, which is caused by a few degree temperature increase from additionally, repetitively applied nanosecond laser pulses [13, 14]. During the photocoagulation, a sensitive ultrasonic transducer, which is integrated into a contact lens, measures the acoustic transients caused by the nanosecond pulses. Due to the temperature dependence of the Grüneisen parameter, the amplitude of the acoustic transient increases with the temperature increase during the photocoagulation [15]. After proper calibration, temperature changes in the retinal tissue are calculated from changes in the acoustic transients [16].
Optoacoustic temperature measurements have no spatial resolution and are not able to show the coagulation effect itself in the different retinal layers. Optical coherence tomography (OCT) [17, 18] is a non-invasive imaging modality, which can visualize the layered structure of the retina with high resolution in-vivo. Changes of tissue morphology due to the photocoagulation were studied by OCT only after irradiation [19]. The direct response of the tissue during photocoagulation is essentially unknown. Since fast OCT can image local changes in scattering, which are caused by microscopic tissue changes as well as changes in gross morphology, it should pick up the instantaneous reaction of tissue due to laser heating. Previous work demonstrated the visualization of photocoagulation of blood [20] and of cutaneous vessels in a hamster dorsal skin flap [21] with up to 30 frames per second. Phase-sensitive OCT and speckle variance in OCT M-scans measured microscopic tissue changes with sub-millisecond time resolution in fresh laser irradiated tissue samples [22]. Also optical path lengths changes caused by heating of nanorods in water were successfully detected by fast phase-sensitive OCT [23].
Aim of this study was the use of phase-sensitive OCT to study tissue changes in porcine and rabbit retina with 1 ms time resolution during photocoagulation. Enucleated porcine eyes and, in vivo, eyes of anaesthetized rabbits were imaged with high speed phase-sensitive OCT at different irradiances, exposure times, and spot sizes. Changes of the absolute value and phase of the OCT signal were correlated with the optoacoustically measured temperature increases and the visual appearance of the lesions.
2. Material and methods
2.1. Experimental setup
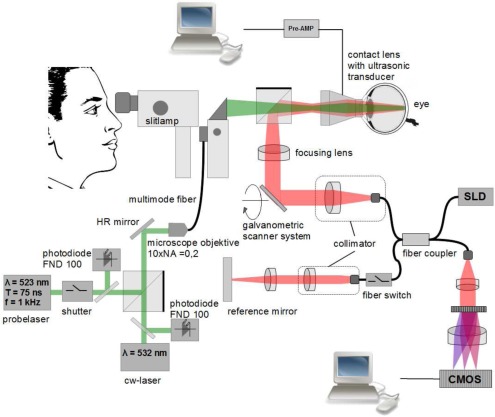
For combined high-speed OCT imaging and temperature measurements during laser irradiation of the retina a laser slit lamp (LSL 532s, Carl Zeiss Meditec, Jena, Germany) was supplemented by devices for optoacoustic temperature measurements and high speed OCT imaging (Fig. 1). A continuous-wave (cw) photocoagulation laser (Visulas 532s, Carl Zeiss Meditec, Jena, Germany) with a wavelength of 532 nm was combined via a beam splitter with a pulsed laser (QG-523-1000, CrystaLaser LC, Reno, NV, USA), which emitted at a wavelength of 523 nm pulses with 75 ns duration at 1 kHz repetition rate. With 7 μJ pulse energy, the average radiant flux (7 mW) was chosen to be low enough to keep the increase of the average temperature below a few Kelvin. Both laser beams were focused by a microscope objective (10x, NA 0.25) into a multi-mode fiber (50 μm core diameter, NA 0.1) which was connected to the laser input of the slit lamp. A rectangular irradiance profile was aimed for by imaging the output of the multi-mode fiber onto the retina. However, some smoothing out of the edges has to be expected due to scattering and aberrations.
Figure 1.
Experimental setup for simultaneous OCT and temperature measurements during photocoagulation. The 532 nm cw coagulation laser was combined with a high-speed OCT using a slit lamp as common basis for visualization of the retina. For detailed description of the setup see main text.
OCT measurements were done with a modified Hyperion OCT system (Thorlabs GmbH, Munich, Germany), which used an external 20 mW super luminescent light source (SLD-371-HP3-DBUT-SM-PD, Superlum, Cork, Ireland) at a wavelength of 840 nm. A spectral width of 50 nm provided a depth resolution of 6 μm in the tissue. Diffraction limited lateral resolution at the retina was calculated to be 14 μm. OCT images with 250 columns per B-scan were recorded continuously at a rate of 215,000 A-scans/s. The B-scans covered a range of 1 mm with a frame rate of 860 images/s. Imaging parameters were a compromise between speed and image quality. The measured spectra from the Hyperion OCT system were streamed with up to 205 MB/s down to a raid-zero hard disk system with 4 connected drives. The processing and the calculations of the datasets were done afterwards. At 10% of the depth range, signal-to-noise ratio (SNR) and sensitivity were 56 dB and 76 dB, respectively. Both dropped by 16 dB at 90% depth range.
OCT and the laser beams for coagulation and optoacoustic measurements were combined with a dichroic beam splitter cube, which was positioned between the slit lamp and the Mainster-type contact lens. The foci of all beams were adjusted to the same plane in front of the contact lens, from which an image was formed onto the retina. The custom made contact lens (based on Mainster Focal/Grid contact lens from Ocular Instruments, Bellevue, Washington, USA) contained also a piezo electric acoustic transducer, which measured the pressure transients caused by the pulsed laser. Electronic signals were amplified (5660B, Panametrics Olympus, Waltham, MA, USA), digitized (Octopus CompuScope CS 8347, Gage Applied Technologies, Lockport, IL, USA) and processed by a PC. After calibration, which was obtained by continuous slow heating of explanted porcine retina with direct temperature measurement, the relative increase of the optoacoustic signal was converted to the temperature increase. Details of the optoacoustic temperature measurements can be found elsewhere [14].
Before each measurement, OCT and laser beams were adjusted on a common axis by volumetric OCT scans of test lesions, from which the center of the coagulation lesion was determined. For the ex-vivo measurements with porcine eyes, coagulations with increasing radiant flux (3 mW to 130 mW), varying exposure times (50 ms to 400 ms) and spot sizes (50 μm to 200 μm) were applied in a grid-like pattern to the cornea. The radiant flux was measured directly in front of the entrance of the contact lens. The spot size was adjusted by a control at the laser slit lamp. Due to similar optical properties of human and porcine eyes, the nominal spot diameter of the laser slit lamp was assumed for these experiments. When irradiating rabbit eyes the nominal diameter was multiplied by 2/3, because of their shorter focal length [24]. Temporal synchronization of OCT and optoacoustic temperature measurements was either done by a fast fiber switch, which activated the reference arm at a known time point or a software trigger via a serial PC port. OCT and optoacoustic temperature measurements started together approximately 100 ms before switching on the coagulation laser and continued until a few hundred milliseconds after the exposure.
The porcine eyes were obtained from the local slaughter house and experiments were done within 6 hours of the death of the animal. The contact lens with the transducer was fixed to the cornea of the eye with a specially designed stage. Both, the eye and the contact lens, were firmly attached to the slit lamp. After enucleation, the retina of the porcine eyes lost nearly all of their structures in the OCT image. Only the blood vessels on top of the retina, the retinal pigment epithelium (RPE) and some blood vessels in the choroidea were distinguishable. In total, twelve porcine eyes were investigated.
In-vivo measurements were done in one Grey Chinchilla rabbit, which was anaesthetized before the beginning of the experiment. The animal was held by a fixation stage which was attached to the same optical table as the slit-lamp. The contact lens was also fixed with a clamp to the animal fixation stage. Animal experiments were approved by the Government of Schleswig-Holstein under the application number V312-72241.121-11.
2.2. Data evaluation
The raw data, i.e. the measured spectra, were processed by using background and spectral shape corrections and a resampling to a linear wave number scale. After Fourier transform the absolute value S of the complex A-scans was displayed on a logarithmic scale to visualize changes in tissue scattering. For the evaluation of small tissue movements the phase of the complex A-scans was analyzed. Because of the fast imaging speed, phase changes between neighbouring A-scans were too small to provide relevant information about the movement of the tissue. Therefore, the phase difference was evaluated between the corresponding A-scans in consecutive B-scans. The time difference Δt over which the phase difference was calculated was 1.2 ms. This phase difference Δφ was used to calculate the velocity vz by which the optical path length changed due to local tissue movement parallel to the beam direction (i.e. the z-direction):
| (1) |
λ0 is the center wavelength of the OCT device. Using a mirror a phase stability between the frames of ±0.1 rad corresponding to ±5.6 nm/ms was determined. For movements larger than λ0/4 between two B-scans, which corresponded to a velocity higher than 175 nm/ms, phase wrapping introduced an ambiguity in the velocity calculation. These phase jumps were corrected by locally detecting spatial discontinuities in the phase and adding or subtracting 2π. The relatively simple symmetry of the tissue movement avoided possible ambiguities, which may need more sophisticated unwrapping algorithms.
By integration of the calculated velocity vz(t) over the time course of the laser irradiation the total local displacement Δz(t) of the tissue, measured in optical path lengths, was calculated.
| (2) |
For comparison with the average temperature, which was measured by optoacoustics, the calculated local displacement was averaged over the irradiated spot and plotted over time.
2.3. Calculation of temperature and thermal expansion of laser irradiated retina
The axial profile of temperature increase ΔT(r⃗,*****t) in the retina was calculated by an analytical solution of the heat diffusion equation
| (3) |
Values of water were assumed for the thermal diffusivity α = k/(cpρ0), thermal conductance k, heat capacity cp, and density ρ0 of the tissue. The power density generated in the tissue by absorption was given by q(r⃗,t). Cooling by choroidal perfusion was not considered in this temperature calculation, because it is not relevant for exposure times below one second [37].
For simplicity of the analytical solution, a square irradiated region with an identical area to the circular irradiated spot, which is embedded in a very large volume, was assumed. In this case the temperature increase is given by [25, 26]:
| (4) |
The temperature increase depends on the size of the heated square 2a, the absorbing tissue layer thickness d, the absorption coefficient μa, the irradiation time τ and the radiant flux Φ. The integral is evaluated over the Heaviside step function Θ and all terms including the error functions . The porcine retina was modeled in accordance with the human eye by two absorbing layers, the RPE with a thickness of 6 μm and the 200 μm thick choroid [27]. In between was a non-absorbing 4 μm thick layer, which represented Bruch’s membrane. Absorption coefficients of 1204 mm and 270 mm were used for RPE and choroid, respectively [28]. The temperature increase was calculated for each layer according to Eq. 4 and then all values were added:
| (5) |
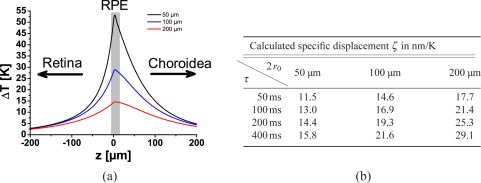
The temperature increase was highest in the RPE and showed a slightly unsymmetrical distribution with a steeper temperature drop off to the retina than to the choroid (Fig. 2(a)). This reflects the choroidal absorption which was roughly a quarter of the RPE absorption.
Figure 2.
a.) Spatially resolved temperature increase ΔT calculated after 400 ms irradiation with 10 mW at spot diameters D of 50 μm, 100 μm, and 200 μm. b.) Expected specific displacement ζ at 25°C for various spot sizes and irradiation times, calculated from the temperature profiles and the density change of water. Variations in ζ are caused by different axial temperature profiles.
A local temperature increase ΔT changes the tissue density ρ which leads to a volume change of ΔV /V = (ρ(T0) – ρ(T0 + ΔT))/ρ(T0). For small isotropic expansion the relative volume change ΔV /V is approximately three times the relative length change Δl/l in one dimension. The total displacement of the neuronal retina was calculated by integrating the temperature-dependent linear thermal expansion over the whole depth of the retina. Assuming isotropic expansion, the linear thermal expansion was calculated as one third of the volumetric expansion:
| (6) |
Density and volume of water and tissue are not linearly related to the temperature. For a water temperature in the range of 25°C to 50°C, the thermal expansion coefficient γ = ∂V /∂T /V increases from 2.5 × 10⁻⁴ K−1 to 4.5 × 10⁻⁴ K−1. The specific displacement ζ = Δz/ΔTend was calculated in Fig. 2(b) according to Eq. (6) for small temperature increases starting at 25°C. ζ changes with spot diameters 2r0 and exposure times τ, as the relative axial temperature distribution in the retina changes with these parameters. Highest specific displacements were calculated for largest spot size and longest exposure time. Values of ζ varied between 11 nm/K for the smallest spot and 50 ms irradiation time and 29 nm/K at 200 μm and 400 ms. As the spot size or the irradiation time increased the longitudinal temperature profile broadened, which led to a larger displacements at same peak temperature.
3. Results and discussion
3.1. Ex-vivo measurements on porcine eyes
3.1.1. Changes of tissue scattering
Series of laser exposures with decreasing irradiance were applied under OCT imaging to the retina of the enucleated eyes. Tissue effects were documented by fundus images and optoacoustic temperature measurements.
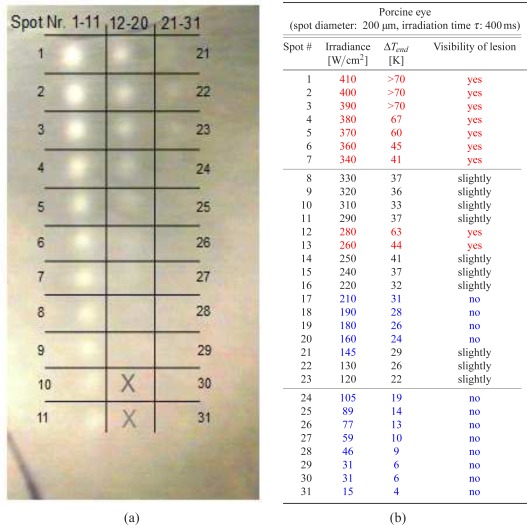
Tissue changes due to photocoagulation were visible as whitish lesions in fundus photography (Fig. 3). Three irradiance regions were identified. At 200μm spot size and 400 ms exposure time no tissue changes were visible in the fundus image below 120 W/cm2. In a transition zone between 120 W/cm2 and 340 W/cm2 invisible, slightly visible as well as a few clearly visible lesions were observed. Above 340 W/cm2 strong, well defined coagulations appeared with the edges of whitening clearly visible against the surrounding tissue. Due to the uneven pigmentation, no strict correlation between irradiance and appearance of the lesions was observed. E.g. lesions #12 and #13 with 280 W/cm2 and 260 W/cm2 appear stronger than the higher irradiance lesions #8 to #11 (330 W/cm2 and 290 W/cm2). Here, in the upper part of the coagulation grid the coagulation effects were more pronounced than in the lower part, which correlates with a darker appearance of the fundus. Tissue effects were divided according to their visual appearance in well visible lesions, slightly and non visible lesions.
Figure 3.
a.) Image of the fundus of an enucleated porcine eye after laser coagulations at different irradiances (left). The spot size was 200 μm, the exposure time 400 ms. The two bottom areas in the center row marked by the crosses were not irradiated. b.) Irradiance E, optoacoustically measured peak temperature ΔTend and visibility of the lesions are listed in the table. Clearly visible lesions are marked in red, slightly visible lesions in black, and invisible lesions in blue.
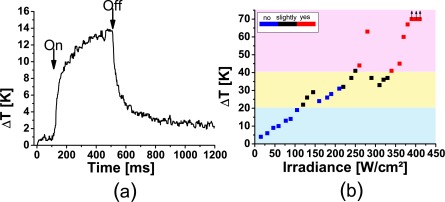
The measured temperatures showed the expected rising part, leading to a plateau and an exponential-like cooling, when the laser was switched off (Fig. 4(a)). At irradiances above 380 W/cm2 the tissue temperatures exceeded the range which could be measured by optoacoustics, because the massive tissue changes and the increased scattering voided the calibration of the optoacoustic temperature measurement. As expected, a better correlation of the coagulation strength was seen with the temperature increase ΔTend, which was calculated from the temperature curves at the end of the irradiation. A temperature increase of 41K separates clearly visible from slightly lesions (Fig. 4(b)). The transition from slightly to invisible lesions is around 25 K. Below 21 K no tissue changes were visible. Background colours mark these three regions.
Figure 4.
a.) Temperature at the RPE during laser irradiation measured by optoacoustics. Begin and end of the irradiation are marked by a strong increase and decrease of the temperature, respectively. b.) Maximum temperature at the end of the irradiation versus irradiance. The blue, black and red colors indicate invisibility, slight and full visibility of the lesions, respectively. Coloured background indicates the temperature ranges, below 21 K and above 41 K, in which all lesions are invisible or have a good visibility, respectively.
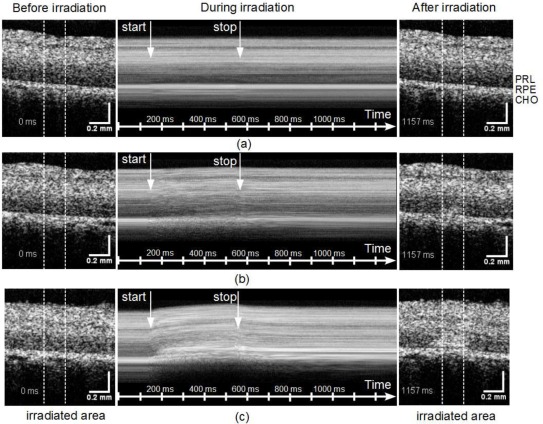
The whitening of the slightly and clearly visible lesions correlates well to the changes of the OCT signal S (Fig. 5), as shown here for three representative lesions, one invisible lesion with 89 W/cm2, one slightly visible lesion with 220 W/cm2 and one clearly visible lesion with 400 W/cm2. In the invisible lesion with a maximum temperature increase of 14 K no significant differences in the OCT image before and after irradiation were observed in the irradiated area, which is marked by two white lines (Fig. 5(a) and [ Media 1 (3.8MB, MPG) ]). In the slightly visible lesion (32 K temperature increase) the OCT signal increased at the end of the irradiation in a small region just above the RPE layer. In addition to a signal increase, the time series of the B-scans indicates, that directly after irradiation started, the tissue contracted in lateral direction towards the center of the irradiated area [ Media 2 (3.8MB, MPG) ]. After 400 ms the movement stopped and the scattering increased in the center of the heated region above the RPE and progressed laterally as well as upwards towards the neural layer. In the strongest lesion (ΔT > 67 K), increase of the scattering started only a few milliseconds after the start of the laser exposure [ Media 3 (3.8MB, MPG) ]. The tissue seems to move rapidly towards the center and in the irradiated region a massive upwards distortion of the retina above the RPE is seen. Here, the dynamic tissue changes continued even after the end of the irradiation.
Figure 5.
OCT images before (left) and after (right) the irradiation for three representative lesions 89 W/cm2 [ Media 1 (3.8MB, MPG) ] (a), 220 W/cm2 [ Media 2 (3.8MB, MPG) ] (b), and 400 W/cm2 [ Media 3 (3.8MB, MPG) ] (c). The region of the laser exposure is marked by two vertical lines. The dynamics of the tissue changes are visualized in the corresponding movies, which show the whole time sequence of B-scans. By laterally averaging A-scans in the irradiated region (within the white lines) an M-scan (averaged A-scan versus time) was calculated (center). Starting and end point of the irradiation are marked by arrows. Retinal layers are marked by PRL: photoreceptor layer, RPE: retinal pigment epithelium, CHO: choroid.
For studying the dynamics of the OCT signal changes during the irradiation, all A-scans in the irradiated area were averaged. The sequence of averaged A-scans over time (M-scan) shows depth resolved scattering changes in the irradiated region (Fig. 5, center column). In addition to an increase of the OCT signal in the photoreceptor layer (PRL) above RPE, changes of the speckle pattern in the neuronal retina are seen. In the strongest lesions also a significant displacement of the retinal surface was visible (Fig. 5 (c)).
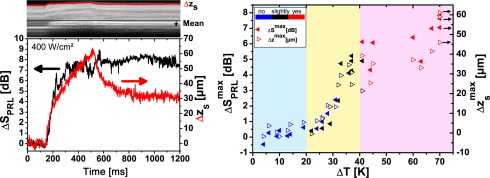
The change of the OCT signal in the photoreceptor layer PRL (ΔSPRL) and the displacement of the retinal surface (Δzs) were calculated from the M-scans. For strong lesions both scattering and displacement started during the pulse (Fig. 6(a)). After the pulse a certain retraction of the surface was observed; the scattering stayed at an elevated level. Maximum scattering change and displacement were generally observed at the end of the irradiation. Their values ( and ) correlated fairly well with the visibility of the lesions (Fig. 6(b)). For a temperature rise of more than 27 K scattering changes and maximum displacement increased more or less in parallel with increasing temperature. In the region of strongly visible lesions (ΔTend > 41 K) both values saturated around 5 dB and 50 μm, respectively. The correlation with temperature is better than with the individual assessment of the lesions. Therefore we conclude that the main source of variance is the visual grading of the lesions. Below 190 W/cm2 the OCT signal change ΔSend and displacement Δzs are dominated by system noise, which was approximately 5 μm for Δzs. Subtle tissue changes, which would be expected in sub-threshold photocoagulation, could not be visualized.
Figure 6.
a) Change of the OCT signal ΔSPRL in the in the photoreceptor layer (PRL) and displacement Δzs of the retinal surface during irradiation with 400 W/cm2 (ΔT > 69 K). b) Signal change and displacement at the end of the irradiation for different irradiances. Visibility of the lesion is indicated by the color of the symbol going from blue (invisible) over black (slightly visible) to red (clearly visible lesion). Coloured background indicates the temperature ranges for the visibility of the lesions.
3.1.2. Evaluation of tissue displacement by the Doppler phase
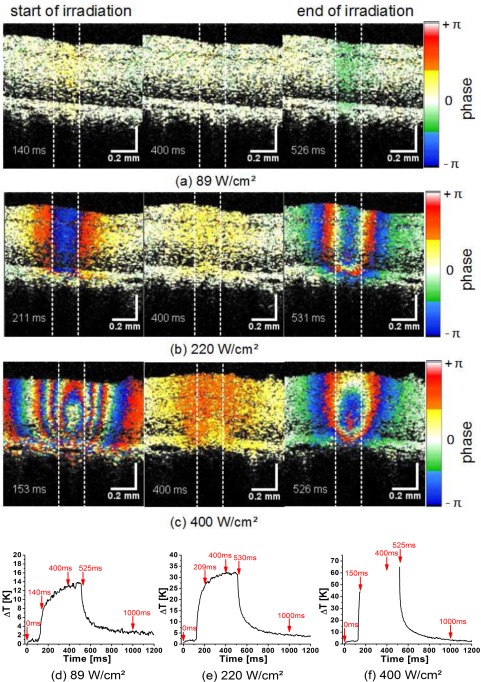
A more precise evaluation of the longitudinal tissue movement was possible by OCT Doppler imaging. The phase differences were calculated between adjacent B-Scans at a time difference of 1.2 ms. Immediately after the coagulation laser was switched on, tissue movement of the whole retina above the RPE towards the OCT beam was observed in the Doppler images (Fig. 7). When the laser was switched off, the tissue moved back. Tissue motion due to the heating was even seen in non-visible lesions (89 W/cm2, 14 K, Fig. 7(a), [ Media 4 (3.8MB, MPG) ]) and got stronger with increasing irradiance. For the slightly visible coagulation (220 W/cm2, 32 K) the Doppler shift appeared already as a strong signal which sometimes exceeded ±π. Phase wrapping was observed across the irradiated area (Fig. 7(b), [ Media 5 (3.8MB, MPG) ]). Phase wrapping was even more pronounced at 400 W/cm2 (ΔT > 70 K, Fig. 7 (c), [ Media 6 (3.8MB, MPG) ]). In general, the largest phase differences and, according to Eq. (1), the highest velocities were observed when the laser was switched on or off, i.e., when the temperature increase is maximum (Fig. 7).
Figure 7.
Color-Doppler OCT images of the coagulation process shortly after the start (150 ms, 1st column), during (400 ms, 2nd column), and at the end of the irradiation (525 ms, 3rd column). Images were taken from three movies which show the time sequence at three different irradiations of 89W/cm2 [ Media 4 (3.8MB, MPG) ] (a), 220W/cm2 [ Media 5 (3.8MB, MPG) ] (b), and 400W/cm2 [ Media 6 (3.8MB, MPG) ] (c). In optoacoustically measured temperature curves the time points, at which the Doppler images are here displayed, are marked by arrows (d–f).
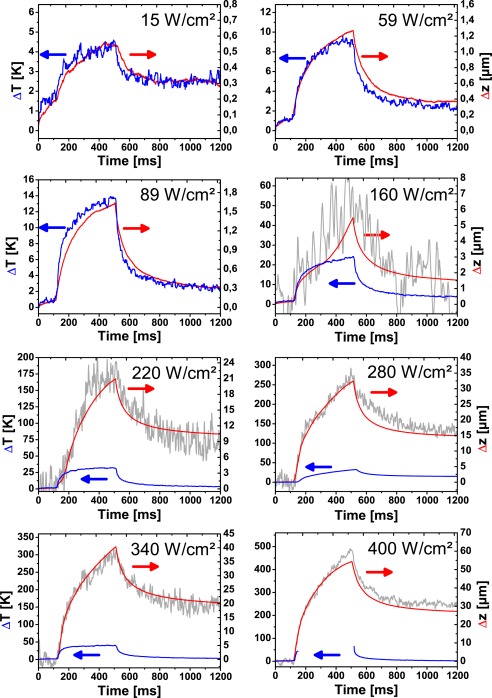
When, after phase unwrapping, the displacement velocity vz was integrated over time to yield the time-dependent displacement Δz according to Eq. 2, the total time course of expansion and contraction could be compared to the temperature increase ΔT and the surface displacement Δzs. For an irradiance below 130 W/cm2 (ΔTend < 27 K) temperature increase ΔT and displacement Δz matched quite well (Fig. 8). The slight temperature increase of 1 – 2 K at the beginning of the measurements is caused by the pulsed laser, which is used for the optoacoustic temperature measurements. In this range the displacement was below 2 μm, which was too small to be measured by tracking the retinal surface. With 125 nm/K the specific expansion ζ = Δz/ΔT in this measurement with 200 μm spot size and 400 ms exposure time, was more than 4 times larger than the expected value of 29 nm/K, which was calculated from the thermal expansion of water (Fig. 2(b)). Obviously, the additional biological components in the tissue contribute to the observed thermal expansion. However, the available data on thermal tissue expansion and the related Grüneisen coefficient suggest no large differences between water and tissue [29, 30, 31, 32]. Only fat tissue has a several times higher thermal expansion coefficient [29]. Errors in the temperature calculation in the retina, which could be caused by uncertainties in the optical and thermal parameters used, are not expected to introduce that large deviation between calculated and measured displacement. Effectively only the longitudinal temperature distribution enters the calculation. In modelling the expansion of the tissue we assumed an isotropic tissue expansion. However the retinal tissue is highly organized in a layered structure. If Bruch’s membrane is stabilizing the heated volume around the RPE cells, the volume increase due to thermal expansion would result in a sole movement in z-direction perpendicular to Bruch’s membrane. In this case a three times larger specific expansion, 87 nm/K, which is within 50% of the measured value, is expected. Also the high content of lipids in the RPE and the photoreceptor layer (PRL) could significantly increase the expansion. Both effects could explain the unexpectedly high thermal expansion which was measured. Doppler OCT was sensitive enough to measure quantitatively the thermal expansion of retinal tissue at a few Kelvin temperature increase. Changes of the tissue temperature during laser irradiation were visualized with good accuracy. A direct calculation of the temperature increase needs the thermal expansion coefficient of the retina, which is at the moment not available. Experiments are under way for an independent determination of the thermal expansion coefficient of retinal tissues.
Figure 8.
Temperature increase ΔT (blue), displacement in the irradiated area Δz (red), and displacement of the retina surface Δzs (grey) at different irradiances. Below 89 W/cm2 surface displacement Δzs is not shown, because the noise (approximately 4 μm) was larger than the displacement.
At higher irradiances the tissue displacement starts to deviate from the temperature curves. An additional contribution to the tissue motion is observed (Fig. 8, 160 W/cm2, 24 K). As the irradiance is increased, the displacement reaches values of more than 50 μm. At this point the surface of the retina bulged upwards, which was also picked up by the measurement of the surface motion. Where measurable, the surface displacement Δzs, which was calculated directly from the the B-scans, and tissue displacement ΔzD, which was calculated from the OCT phase, matched quite well. This proves the validity of our unwrapping algorithm. The advantage of Doppler OCT versus the direct measurement of the tissue displacement is the excellent sensitivity and the large measurement range from below one hundred nanometer to tens of micrometers.
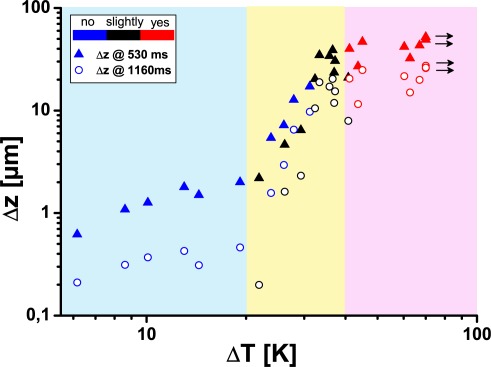
In contrast to the thermal expansion, which was observed at low temperature increases, the additional component of tissue displacement was irreversible. A residual displacement was observed even when the tissue has cooled down. Deviations of the displacement from the temperature course were already observed in non-visible lesions, where changes of the OCT signal were not seen (compare Fig. 8, 160 W/cm2 with Figs. 3 and 5). Both, the displacements at the end of the irradiation and at the end of the measurement were sensitive markers for irreversible tissue changes (Fig. 9). A good correlation of the two displacement values with the temperature was observed at an increase of nearly one order of magnitude over a temperature increases from 20 K to 40 K (yellow area in Fig. 9). Already, above 120 W/cm2 (22 K) irreversible tissue changes associated with a thermal denaturation of the tissue were visible with at high signal-to-noise ratio. The correlation between displacement and visibility was less good. Macroscopically visible whitening of the tissue was a less reliable parameter for the grading of near-threshold lesions.
Figure 9.
Displacement Δz of the retina in the irradiated region at the end of the irradiation (530 ms) and the end of the OCT recording (1160 ms) versus the maximum temperature increase ΔTend.
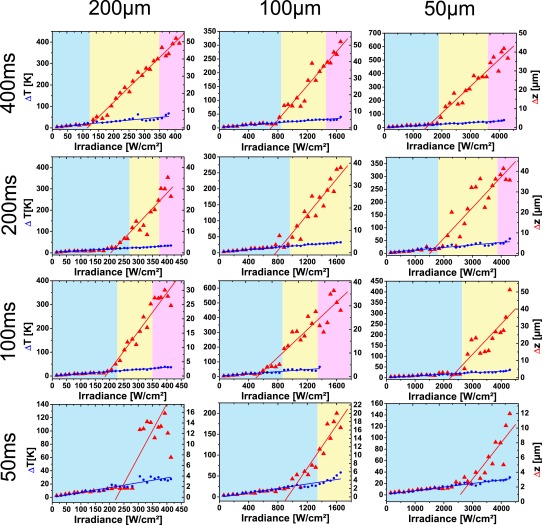
Experiments were repeated for 12 eyes with 12 different irradiation parameters. Three different spot sizes (50 μm, 100 μm, and 200 μm) and four different irradiation times (50 ms, 100 ms, 200 ms, and 400 ms) were investigated. From the optoacoustic measurements the maximum temperature increase ΔTend, when the laser was switched off, and from Doppler OCT the corresponding displacement Δzend of the retina were calculated for different irradiances (Fig. 10). As expected, a linear increase of the peak temperature ΔTend with the irradiance E was measured up to 50 K by optoacoustics. For the tissue displacement basically two regions existed with a more or less linear dependence on the irradiance. At low irradiance the specific expansion ζ varied between 60 nm/K and 160 nm/K (Tab. 1). These values were already considerably higher, than the specific displacement, which was calculated for water in Fig. 2(b). The large variation of ζ may be caused by varying overlap of the OCT B-scan with the center of the coagulation spot.
Figure 10.
Displacement Δzend of the retina in the irradiated region and the temperature increase ΔTend at the end of the irradiation in dependence on the irradiances. The spot diameters were varied from 50 μm to 200 μm, the irradiation time from 50ms to 400ms. Underlayed colors indicate irradiation ranges for invisible (blue), slightly (yellow) and clearly visible lesions (pink).
Above a certain threshold Eth the slopes increased one order of magnitude to up to 20 μm/K, as thermal tissue alterations set in. The intersection of two linear fits to Δzend defined a threshold irradiance Eth for the onset of the tissue changes (Tab.1). In general, for smaller spot diameters or shorter exposure times the threshold Eth was higher. Nevertheless, considerable scattering of the data was observed because of varying pigmentation in the different eyes. Comparing Eth with tissue changes visible by optical fundus inspection as in Fig. 4 revealed a good correlation with the change from invisible tissue changes (blue background) to slightly visible lesions (yellow background). The change to clearly visible lesions (red background) did not further change the slope of the displacement dependence.
3.1.3. Depth resolved calculation of the tissue expansion
Temperature increase and tissue denaturation cause a local tissue expansion, which adds up from the different depths to the observed tissue displacement Δz. If Δz is determined as a function of depth z, the local expansion in z-direction εz(z) is therefore recovered by differentiation of the displacement with respect to z:
| (7) |
For isotropic expansion, ∂Δz/∂z is the derivative of the displacement from Eq. 6 and is directly related to relative changes of the density ρ with temperature:
| (8) |
Thermoelastic tissue expansion depends on the local temperature. If the linear thermal expansion coefficient α = ∂εz(z)/∂T is known and the temperature stays below the coagulation threshold, it should in principle be possible to calculate the local temperature increase. As mentioned, in our experiments the observed thermal specific displacement ζ was several times higher than expected from water (see Table 1) or published values of thermal tissue expansion [29]. Therefore quantitative, spatially resolved temperature measurements, which are in principle feasible, need a calibration with retinal tissue. A similar calibration is done for the optoacoustic temperature measurements [14, 15, 16].
Table 1.
Characteristic parameters of tissue reactions, calculated from the OCT measurements at different irradiation times and spot sizes*
| Irradiation of porcine eyes ex-vivo | |||||||
|---|---|---|---|---|---|---|---|
| Irradiation time [ms] |
Spot diameter [μm] |
ΔT/E [K/(Wcm−2)] |
ζwater [nm/K] |
ζ [nm/K] |
ζth [nm/K] |
Eth [W /cm2] |
ΔTend (Eth) [K] |
| 400 | 200 | 130 | 29.1 | 130 | 1300 | 128 | 19.4 |
| 400 | 100 | 19 | 22.6 | 160 | 2700 | 763 | 17.4 |
| 400 | 50 | 12 | 15.5 | 81 | 1300 | 1570 | 20.3 |
| 200 | 200 | 73 | 25.3 | 110 | 2100 | 217 | 19.2 |
| 200 | 100 | 18 | 19.3 | 170 | 2100 | 839 | 18.4 |
| 200 | 50 | 9.9 | 14.4 | 150 | 1600 | 1682 | 20.7 |
| 100 | 200 | 88 | 21.4 | 85 | 1500 | 198 | 20.4 |
| 100 | 100 | 36 | 16.9 | 63 | 810 | 576 | 26.9 |
| 100 | 50 | 7.2 | 13.0 | 63 | 1500 | 2372 | 18.7 |
| 50 | 200 | 73 | 17.7 | 83 | 980 | 248 | 18.7 |
| 50 | 100 | 27 | 14.6 | 73 | 920 | 1030 | 25.3 |
| 50 | 50 | 6.3 | 11.5 | 60 | 720 | 2889 | 20.3 |
The specific temperature increase ΔT /E was calculated from the slope of maximum temperature versus irradiance. The irradiance Eth is the intersection of the two linear functions, which were fitted to the maximum displacement Δzend. ΔTend (Eth) is the corresponding maximum temperature increase. Specific displacements ζ and ζth below and above Eth were calculated from slopes of these two linear functions. The specific displacement ζwater, which was calculated for the thermal expansion coefficient of water, was taken from Fig. 2.
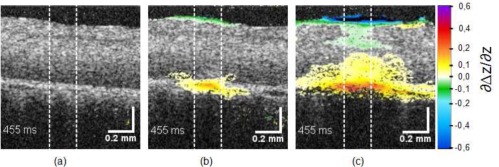
Applying Eq. (8) to the measured displacements revealed that the expansion occurred as expected near the RPE (Fig. 11). Unfortunately, the differentiation introduced additional noise. Therefore at the subthreshold lesions the expansion value remained below the noise floor and no local temperature increase could be visualized. Only at the slightly visible coagulations (Fig. 11(b), [ Media 7 (3.8MB, MPG) ], 220 W/cm2, 32 K) local expansion was clearly visible in the irradiated region of 200 μm in diameter. In the strongest lesions (400 W/cm2, ΔT > 67 K, [ Media 8 (3.8MB, MPG) ]) the whole image area and even the upper neural layer are affected. Increasing the sensitivity of the OCT system and using better motion correction, signal quality can be improved and it is expected that pure thermal expansion can be visualized, as it was already successfully done in silicone phantoms (data not shown).
Figure 11.
Expansion of the RPE at the end of the irradiation at 89 W/cm2 (a), 220 W/cm2 [ Media 7 (3.8MB, MPG) ] (b), and 400 W/cm2 [ Media 8 (3.8MB, MPG) ] (c).
3.2. In-vivo measurements
For transferring the ex-vivo results to an in-vivo application two main issues have to be addressed. Firstly, additional tissue motion which is caused by choroidal perfusion, global motion of the eye or the experimental setup has to be compensated. Secondly, effects related to the in-vivo situation, i.e. physiological reactions of neuronal retina and choroid to the elevated temperature, which may occur and obscure the thermal tissue expansion, have to be identified.
To address the first point and to demonstrate the feasibility of measuring thermal tissue expansion in vivo, irradiation experiments were repeated with an anaesthetized rabbit. As expected longitudinal as well as lateral movements of the retina over several tens of a micrometer were observed during the irradiation (Fig. 12). In a time series which shows the displacement, the retina literally moved under the irradiation beam ([ Media 9 (3.4MB, MPG) ]). The frequency of the motion was in the range of the breathing frequency. The head of the animal was not completely fixed. Hence breathing caused slight movements of the eye. The OCT measurements are orders of magnitude more sensitive for longitudinal motion, i.e. the direction of the measuring beam, than to lateral motion. Longitudinal motion was therefore most disturbing and affected the whole field of view. A constant phase offset was observed, when the motion velocity did not change over the two frames, which were used to calculate the phase difference. If the motion velocity was not constant over this time, the phase difference varied as the retina was scanned. With 1 kHz the frame rate was considerably higher than the average frequencies of tissue motion and the phase changed more or less linearly over the image (Fig. 13).
Figure 12.
Studying photocoagulation in-vivo. OCT images before irradiation (left), M-scan calculated by averaging all A-scans in the irradiated area (center) and OCT image after the irradiation (right). Starting and end point of the irradiation with 55 W/cm2 are marked by arrows. A movie of the sequence of B-scans during the irradiation is shown in [ Media 9 (3.4MB, MPG) ]. Spot size was 133 μm, the exposure time 500 ms.
Figure 13.
Correction of the longitudinal tissue motion by subtraction a linear varying phase function. a.) Uncorrected Doppler image. b.) Phase averaged over the depth of the retina and linear fit. c.) Corrected average phase. d.) Corrected Doppler image.
On the background of this linearly varying phase differences, the irradiation of the retina caused a localized phase change in the center of the image. In order to subtract the phase background, the average phase of each A-scan was calculated in a certain region-of-interest across the whole width of the image (Fig. 13 (b)), a line was fitted to the calculated values and then subtracted from the phase in each A-Scan (Fig. 13 (c,d)). Lateral bulk tissue motion was not corrected, though it may introduce significant errors in calculating the displacement Δz, by incorrectly integrating the phase differences from different locations of the image. In principle lateral motion can be corrected by tracking the speckles in the image. However, information on the motion perpendicular the B-scan was not available. Only fast volumetric scanning could provide the full lateral motion information, which is needed for a lateral motion correction.
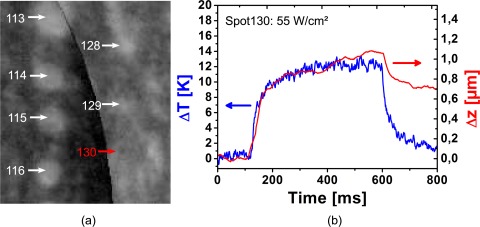
With our simple approach, it was also possible to measure thermal tissue expansion during photocoagulation in vivo. Despite the severe retinal movement, thermally induced tissue displacements below 1 μm were measured for a non-visible lesion with 12 K temperature increase (Fig. 14). The calculated curve for the displacements Δz did not exactly match the expected heating and cooling behaviour of the retina as Δz did not go back to zero. This non-reversibility may be an artifact from the tissue motion. If the heated area moves outside the region of interest from which the phases are integrated, the contraction phase is lost and Δz will stay high. The non-reversibility of Δz could also result from an early biological reaction, e.g. oedema formation. With 74 nm/K, the specific expansion ζ is in the range of what was measured for porcine eyes. Considering the strong lateral motion of the retina, the poorer quality of the measurements is not unexpected. Displacement measurements by Doppler OCT integrate the local velocity. Movement to a slightly different location at one time point will influence all following measurements. Volumetric scanning or on-the-fly correction of eye movements with an eye tracker could reduce the artifacts of transverse movements.
Figure 14.
a) Fluorescence angiography of the rabbit retina after photocoagulation. No increased fluorescence was observed at the sub-threshold lesion #130 after irradiation with 160 W/cm2 for 500 ms. b) Temperature increase ΔT (blue) and displacement Δz in the irradiated area (red) measured in vivo. The spot size was 133 μm.
This first experiment demonstrates the feasibility of measuring thermal tissue expansion during photocoagulation in vivo. Experiments are under way, which shall optimize the motion correction and address the physiological reactions of neuronal retina and choroid under laser heating.
4. Conclusion
Optical coherence tomography is essential for the diagnosis of retinal diseases. Besides diagnostics, the increase of the imaging speed, which was demonstrated in the last years, opens opportunities for OCT to directly support medical interventions. Coupled to a surgical microscope OCT can assist microsurgery [33, 34, 35, 36]. Here we demonstrated that OCT combined with a retinal photocoagulator can visualize the reaction of the tissue to laser irradiation. In addition to depth resolved changes of tissue scattering, OCT measured tissue movement over more than 40 μm with a few tens of a nanometer resolution. With a sensitivity which is high enough to follow the reversible thermal expansion at below one Kelvin temperature increase, phase resolved OCT was able to measure non-invasively, spatially-resolved and without contact temperature changes of the retina. Possible applications are not limited to dosimetry of photocoagulation or the investigation of the underlying mechanisms. In-vivo measurements of retinal temperature rises can be envisioned for studies on laser safety. A spatially-resolved determination of the specific tissue movement ζ can lead to maps of the retinal pigmentation. The heating and cooling time constants, which can be easily determined from the temperature time course, could provide direct information on the perfusion of the choroid [37].
In addition to reversible thermal expansion phase-sensitive OCT also measured heat-induced tissue alteration which, in vitro lead to an additional displacement of the retinal tissue. A discrimination from the thermal expansion is possible by magnitude, reversibility or spatial extent of the effect. In addition to the optoacoustic temperature measurements, OCT can measure the coagulation effect itself. Experiments with enucleated eyes suggest, that the mechanical alteration of the tissue is a more sensitive marker for coagulation than a change in tissue scattering. However, this has to be validated in in-vivo experiments which are under way. Preliminary results demonstrated the possibility of sensitive displacement measurements, but also stressed the importance of a correction of longitudinal and lateral motion.
In future, OCT may play an important role in laser treatment of the retina by combining pre-, and post-treatment diagnosis with an on-line control of the laser-induced tissue effects. This shall lead to a more precise and less damaging treatment of retinal diseases.
Acknowledgments
This work was funded via the “ Zukunftsprogramms Wirtschaft (ZPW)” of Landes Schleswig-Holstein, Germany, (Competence Center for Technology and Engineering in Medicine (TANDEM), 122-09-024) and the European Union (EFRE 636 and FP7 HEALTH, Contract No. 201880–FUN OCT). Support of the Carl Zeiss Meditec by providing the coagulation laser is gratefully acknowledged.
References
- 1.Meyer-Schwinckerath G., “Lichtkoagulationen,” Arch. Ophthalmol. 156, 2–34 (1954). [PubMed] [Google Scholar]
- 2.Early Treatment Diabetic Retinopathy Study Research Group , “Early photocoagulation for diabetic retinopathy. ETDRS report number 9,” Ophthalmology 98, 766–785 (1991). [PubMed] [Google Scholar]
- 3.Early Treatment Diabetic Retinopathy Study Research Group , “Photocoagulation for diabetic macular edema. early treatment diabetic retinopathy study report number 1,” Arch. Ophthalmol. 103, 1796–1806 (1985). [PubMed] [Google Scholar]
- 4.Branch Vein Occlusion Study Group , “Argon laser scatter photocoagulation for prevention of neovascularization and vitreous hemorrhage in branch vein occlusion. a randomized clinical trial,” Arch. Ophthalmol. 104, 34–41 (1986). [DOI] [PubMed] [Google Scholar]
- 5.Branch Vein Occlusion Study Group , “Natural history and clinical management of central retinal vein occlusion,” Arch. Ophthalmol. 115, 486–491 (1997). [DOI] [PubMed] [Google Scholar]
- 6.Shah A. M., Bressler N. M., Jampol L. M., “Does laser still have a role in the management of retinal vascular and neovascular diseases?” Am. J. Ophthalmol. 152, 332–339.e1 (2011). 10.1016/j.ajo.2011.04.015 [DOI] [PubMed] [Google Scholar]
- 7.Geeraets W. J., Williams R. C., Chan G., Ham J., Jr., T. W., Guerry D., III, Schmidt F. H., “The relative absorption of thermal energy in retina and choroid,” Invest. Ophthalmol. 1, 340–347 (1962). [PubMed] [Google Scholar]
- 8.Schmidt S. Y., Peisch R. D., “Melanin concentration in normal human retinal pigment epithelium. regional variation and age-related reduction,” Invest. Ophthalmol. Vis. Sci. 27, 1063–1067 (1986). [PubMed] [Google Scholar]
- 9.Luttrull J. K., Musch D. C., Mainster M. A., “Subthreshold diode micropulse photocoagulation for the treatment of clinically significant diabetic macular oedema,” Br. J. Ophthalmol. 89, 74–80 (2005). 10.1136/bjo.2004.051540 [DOI] [PMC free article] [PubMed] [Google Scholar]
- 10.Giudice G. L., de Belvis V., Tavolato M., Galan A., “Large-spot subthreshold transpupillary thermotherapy for chronic serous macular detachment,” Clin. Ophthalmol. 5, 355–560 (2011). 10.2147/OPTH.S16014 [DOI] [PMC free article] [PubMed] [Google Scholar]
- 11.Inderfurth J., Ferguson R., Frish M., Birngruber R., “Dynamic reflctometer for control of laser photocoagulations on the retina,” Laser Surg. Med. 15, 54–61 (1994). 10.1002/lsm.1900150108 [DOI] [PubMed] [Google Scholar]
- 12.Framme C., Brinkmann R., Birngruber R., Roider J., “Autofluorescence imaging after selective rpe laser treatment in macular diseases and clinical outcome: a pilot study,” Br. J. Ophthalmol. 86, 1099–1106 (2002). 10.1136/bjo.86.10.1099 [DOI] [PMC free article] [PubMed] [Google Scholar]
- 13.Schlott K., Stalljohann J., Weber B., Kandulla J., Herrmann K., Birngruber R., Brinkmann R., “Optoacoustic online temperature determination during retinal laser photocoagulation,” Proc. SPIE 6632, 66321B (2007). 10.1117/12.728291 [DOI] [Google Scholar]
- 14.Brinkmann R., Koinzer S., Schlott K., Ptaszynski L., Bever M., Baade A., Luft S., Miura Y., Roider J., Birngruber R., “Realtime temperature determination during retinal photocoagulation on patients,” J. Biomed. Opt. (to be published). [DOI] [PubMed]
- 15.Schüle G., Hüttmann G., Framme C., Roider J., Brinkmann R., “Noninvasive optoacoustic temperature determination at the fundus of the eye during laser irradiation,” J. Biomed. Opt. 9, 173–179 (2004). 10.1117/1.1627338 [DOI] [PubMed] [Google Scholar]
- 16.Kandulla J., Elsner H., Birngruber R., Brinkmann R., “Noninvasive optoacoustic online retinal temperature determination during continuous-wave laser irradiation.” J. Biomed. Opt. 11, 041111 (2006). 10.1117/1.2236301 [DOI] [PubMed] [Google Scholar]
- 17.Huang D., Swanson E., Lin C., Schuman J. S., Stinson W. G., Chang W., Hee M. R., Flotte T., Gregory K., Puliafito C. A., Fujimoto J. G., “Optical coherence tomography,” Science 254, 1178–1181 (1991). 10.1126/science.1957169 [DOI] [PMC free article] [PubMed] [Google Scholar]
- 18.Sakata L. M., Deleon-Ortega J., Sakata V., Girkin C. A., “Optical coherence tomography of the retina and optic nerve - a review,” Clin. Experiment. Ophthalmol. 37, 90–99 (2009). 10.1111/j.1442-9071.2009.02015.x [DOI] [PubMed] [Google Scholar]
- 19.Framme C., Walter A., Prahs P., Regler R., Theisen-Kunde D., Alt C., Brinkmann R., “Structural changes of the retina after conventional laser photocoagulation and selective retina treatment (SRT) in spectral domain OCT,” Curr. Eye. Res. 34, 568–579 (2009). 10.1080/02713680902964892 [DOI] [PubMed] [Google Scholar]
- 20.Black J. F., Wade N., Barton J. K., “Mechanistic comparison of blood undergoing laser photocoagulation at 532 and 1,064 nm,” Lasers Surg. Med. 36, 155–165 (2005). 10.1002/lsm.20134 [DOI] [PubMed] [Google Scholar]
- 21.Barton J. K., Rollins A., Yazdanfar S., Pfefer T. J., Westphal V., Izatt J. A., “Photothermal coagulation of blood vessels: a comparison of high-speed optical coherence tomography and numerical modelling,” Phys. Med. Biol. 46, 1665–1678 (2001). 10.1088/0031-9155/46/6/306 [DOI] [PubMed] [Google Scholar]
- 22.Vakoc B. J., Tearney G. J., Bouma B. E., “Real-time microscopic visualization of tissue response to laser thermal therapy,” J. Biomed. Opt. 12, 020501 (2007). 10.1117/1.2714027 [DOI] [PubMed] [Google Scholar]
- 23.Adler D. C., Huang S. W., Huber R., Fujimoto J. G., “Photothermal detection of gold nanoparticles using phase-sensitive optical coherence tomography,” Opt. Express 16, 4376–4393 (2008). 10.1364/OE.16.004376 [DOI] [PubMed] [Google Scholar]
- 24.Birngruber R., Drechsel E., Hillenkamp F., Gabel V. P., “Minimal spot size on the retina formed by the optical system of the eye,” Int. Ophthalmol. 1, 175–178 (1979). 10.1007/BF00137496 [DOI] [PubMed] [Google Scholar]
- 25.Birngruber R., “Thermal modeling in biological tissues,” in Lasers in Biology and Medicine, Hillenkamp F., Pratesi R., Sacchi C. A., eds. (Plenum Press, New York, 1980), 77–97 [Google Scholar]
- 26.Freund D. E., McCally R. L., Farrell R. A., Sliney D. H., “A theoretical comparison of retinal temperature changes resulting from exposure to rectangular and gaussian beams,” Laser Life Sci. 7, 71 – 89 (1996). [Google Scholar]
- 27.Gabel V.-P., Birngruber R., Hillenkamp F., Die Lichtabsorption im Augenhintergrund: Mikrospektralphotometrische Bestimmung der wellenabhängigen Lichtabsorption in Pigmentepithel und Chorioidea von Mensch, Rhesusaffe und Chinchillakaninchen, GSF-Bericht A (GSF, München, 1976). [Google Scholar]
- 28.Hammer M., Roggan A., Schweitzer D., Müller G., “Optical properties of ocular fundus tissues–an in vitro study using the double-integrating-sphere technique and inverse monte carlo simulation,” Phys. Med. Biol. 40, 963–978 (1995). 10.1088/0031-9155/40/6/001 [DOI] [PubMed] [Google Scholar]
- 29.Duck F. A., Physical Properties of tissue—a Comprehensive Reference Book (Academic, London, 1990).2562372 [Google Scholar]
- 30.Seip R., Ebbini E. S., “Noninvasive estimation of tissue temperature response to heating fields using diagnostic ultrasound,” IEEE Trans. Biomed. Eng. 42, 828–839 (1995). 10.1109/10.398644 [DOI] [PubMed] [Google Scholar]
- 31.Dark M. L., Perelman L. T., Itzkan I., Schaffer J. L., Feld M. S., “Physical properties of hydrated tissue determined by surface interferometry of laser-induced thermoelastic deformation,” Phys. Med. Biol. 45, 529–539 (2000). 10.1088/0031-9155/45/2/318 [DOI] [PubMed] [Google Scholar]
- 32.Soroushian B., Whelan W. M., Kolios M. C., “Study of laser-induced thermoelastic deformation of native and coagulated ex-vivo bovine liver tissues for estimating their optical and thermomechanical properties,” J. Biomed. Opt. 15, 065002 (2010). 10.1117/1.3517455 [DOI] [PubMed] [Google Scholar]
- 33.Geerling G., Müller M., Winter C., Hoerauf H., Oelckers S., Laqua H., Birngruber R., “Intraoperative 2-dimensional optical coherence tomography as a new tool for anterior segment surgery,” Arch. Ophthalmol. 123, 253–257 (2005). 10.1001/archopht.123.2.253 [DOI] [PubMed] [Google Scholar]
- 34.Böhringer H. J., Lankenau E., Stellmacher F., Reusche E., Hüttmann G., Giese A., “Imaging of human brain tumor tissue by near-infrared laser coherence tomography,” Acta Neurochir. (Wien) 151, 507–517; discussion 517 (2009). [DOI] [PMC free article] [PubMed] [Google Scholar]
- 35.Müller M., Steven P., Lankenau E., Krug M., Acidereli E., Oelkers S., Birngruber R., Grisanti S., Hüttmann G., “OCT-camera assisted intraoperative anterior and posterior segment surgery—first results of the new intraoperative OCT,” presented at World Ophthalmology Congress 2010, XXXII International Congress of Ophthalmology, 108th DOG Congress, Berlin, 5–9 June 2010 [Google Scholar]
- 36.Ehlers J. P., Tao Y. K., Farsiu S., Maldonado R., Izatt J. A., Toth C. A., “Integration of a spectral domain optical coherence tomography system into a surgical microscope for intraoperative imaging,” Invest. Ophthalmol. Vis. Sci 52, 3153–3159 (2011). 10.1167/iovs.10-6720 [DOI] [PMC free article] [PubMed] [Google Scholar]
- 37.Sandeau J., Kandulla J., Elsner H., Brinkmann R., Apiou-Sbirlea G., Birngruber R., “Numerical modelling of conductive and convective heat transfers in retinal laser applications,” J. Biophotonics 1, 43–52 (2008). 10.1002/jbio.200710012 [DOI] [PubMed] [Google Scholar]


