Abstract
Custom high-resolution high-speed anterior segment spectral domain Optical Coherence Tomography (OCT) was used to characterize three-dimensionally (3-D) corneal topography in keratoconus before and after implantation of intracorneal ring segments (ICRS). Previously described acquisition protocols were followed to minimize the impact of the motions of the eye. The collected set of images was corrected from distortions: fan (scanning) and optical (refraction). Custom algorithms were developed for automatic detection and classification of volumes in the anterior segment of the eye, in particular for the detection and classification of the implanted ICRS. Surfaces were automatically detected for quantitative analysis of the corneal elevation maps (fitted by biconicoids and Zernike polynomials) and pachymetry. Automatic tools were developed for the estimation of the 3-D positioning of the ICRS. The pupil center reference was estimated from the segmented iris volume. The developed algorithms are illustrated in a keratoconic eye (grade III) pre- and 30 days post-operatively after implantation of two triangular-section, 0.3-mm thick Ferrara ring segments. Quantitative corneal topographies reveal that the ICRS produced a flattening of the anterior surface, a steepening of the posterior surface, meridional differences in the changes in curvature and asphericity, and increased symmetry of the anterior topography. Optical distortion correction through the ICRS (of a different refractive index from the cornea) allowed accurate pachymetric estimates, which showed increased thickness in the ectatic area as well as in peripheral corneal areas. Automatic tools allowed estimation of the depth of the implanted ICRS ring, as well as its rotation with respect to the pupil plane. Anterior segment sOCT provided with fan and optical distortion correction and analysis tools is an excellent instrument for evaluating and monitoring keratoconic eyes and for the quantification of the changes produced by ICRS treatment.
OCIS codes: (110.4500) Optical coherence tomography; (120.6650) Surface measurements, figure; (120.4640) Optical instruments; (110.6880) Three-dimensional image acquisition; (330.7327) Visual optics, ophthalmic instrumentation
1. Introduction
Keratoconus is a bilateral, asymmetric and chronic disease of the eye caused by the weakening of the cornea with a prevalence of 1 per 2000 in the population [1]. It is characterized by a progressive thinning and steepening of the cornea, resulting in a cone-shaped cornea, which leads to increased astigmatism and high order aberrations [2], and a loss of visual quality [3]. In the early stages of the disease, the use of spectacles or contact lenses might provide sufficiently functional visual quality to the patient [4]. However, the progressive corneal thinning and steepening usually results in the need of corneal transplant in advanced stages [5,6]. Several emerging treatments of keratoconus, such as collagen cross-linking [7] or the implantation of poly(methyl methacrylate) (PMMA) intracorneal ring segments (ICRS) [8–10], attempt at preventing or delaying corneal transplant. The rationale behind the ICRS is the use of passive spacing elements to increase the keratoconic corneal structural integrity, shorten the arc length of the corneal surface, and achieving a refractive adjustment by flattening the central cornea [11,12]. One of the advantages of the ICRS surgery is the possibility of reshaping the cornea without removing tissue, although a potential drawback is the lack of predictability of its outcomes [13–15].
Understanding of the structural and geometrical changes induced on the cornea upon implantation of ICRS is key in the optimization of the ICRS surgery to treat keratoconus and increase its predictability. Quantitative information from advanced anterior segment imaging techniques may be challenged by the irregular cornea, by the limited range of application of some of the existing instruments, and by the presence of the implant with a different index of refraction from tissue. Several studies report geometrical corneal changes in keratoconic corneas [16–19] and upon ICRS implantation, measured by slit-scanning corneal topography (Orbscan, Orbtek, Inc) [20], Scheimpflug camera (Pentacam, Oculus, Inc) [21] or high-frequency ultrasound (UBM) [22]. Although these instruments have allowed to identify unusual topographic patterns in the anterior cornea, and provided posterior corneal elevation and pachymetry maps, they are subject to limitations, particularly in the application under study. Slit-scanning topography presents limited depth resolution and several studies have reported underestimation of corneal thickness in keratoconic patients [23]. Furthermore, the lack of an appropriate correction of the optical distortion produced by the anterior corneal surface limits the reliability of the retrieved posterior corneal surface. In comparison with slit-scanning systems, Pentacam Scheimplfug imaging system has shown to provide good reproducibility and repeatability in measuring curvature and thickness in normal and keratoconic eyes [24], although some studies reported variability in corneal elevation maps [25,26]. In a previous study we showed that posterior corneal curvature measured with this instrument was not influenced by refraction of the anterior surface [27]. However, it is likely that the optical distortion correction assumes a constant corneal refractive index, compromising the estimates of posterior corneal elevations viewed through a different optical material. UBM requires immersing the eye in a coupling fluid, which limits control of the visual fixation). Also, although unlike optical techniques UBM is not subject to refraction distortion, the axial resolution is poorer than that of optical techniques.
Anterior segment Optical Coherence Tomography (OCT) presents several advantages over other techniques to evaluate keratoconus and ICRS implantation. It is non-invasive, and high-speed technology allows collection of 3-D anterior segment data in hundreds of milliseconds with an unprecedented axial and lateral resolution [28]. Several studies report different corneal parameters in normal and keratoconic subjects using OCT: central corneal thickness [29–32], radius and asphericities of anterior and posterior corneal surfaces and corneal topographic and pachymetric maps [33–38]. A study also reported estimates of the depth of the implanted ICRS using an OCT meridians images from a custom system [39]. OCT appears therefore as an ideal tool to quantify both the geometry of the cornea, and its changes with treatment, as well as the implantation of the ICRS (i.e. three dimensional positioning of the implants within the corneal volume). However, quantitative geometrical parameters can only be retrieved accurately upon correction of the fan (scanning) distortion of the sample arm of the OCT instrument, and (for all structures behind the anterior cornea) correction of the optical (refraction) distortion [33–37]. Optical correction of the refraction of the anterior cornea is particularly critical in keratoconic corneas, with increased irregularities and steepening, and in the presence of ICRS with a different refractive index.
In this study, we present quantification of the keratoconic cornea before and after ICRS implantation. To our knowledge, this is the first time where fully quantitative OCT (following fan and optical distortion correction) has been applied to retrieve anterior and posterior corneal elevations and pachymetric to irregular and treated corneas. The study also reports the development of a series of automatic algorithms of volume identification in general (and of the ICRS in particular), automatic segmentation of the edges of the ICRS, which allowed accurate automatic estimate of the location, depth and rotational angles of the ICRS.
2. Material and Methods
2.1. Patient and ICRS surgery
Ferrara ICRS were implanted using a manual surgical technique in one keratoconic patient (29 y.o) [9]. The surgical procedure was carried out under topical anesthesia. The technical specifications of the Ferrara ICRS were: triangular cross section, 0.3-mm thickness, 90-deg arc length, 5-mm inner diameter, and 5.6-mm outer diameter. The tunnels were performed at 80% of the corneal thickness, and the ICRS subsequently implanted in the tunnels. Two segments were implanted symmetrically at an angle of 70° deg from the steepest meridian. The study was approved by Institutional Review Boards and followed the tenets of the Declaration of Helsinki. The subject signed a consent form and was aware of the nature of the study.
2.2. Experimental sOCT set up and acquisition protocols
The analysis was performed on images collected with a custom-developed spectral OCT system (from a collaborative effort with Copernicus University, Torun, Poland) [28]. The set-up is based on a fiber-optics Michelson interferometer configuration with a superluminescent diode (SLD) (λ0 = 840 nm, Δλ = 50 nm; Superlum, Ireland) as a light source and a spectrometer consisting of a volume diffraction grating, and a 12-bit line-scan CMOS camera with 4096 pixels (Basler sprint spL4096-140k; Basler AG, Germany) as a detector. The effective acquisition speed is 25000 A-Scans/s, which optimized balance between speed and SNR. The axial range of the instrument is 7 mm in depth, resulting in a theoretical pixel resolution of 3.4 µm. The axial resolution predicted by the bandwidth of the SLD laser source is 6.9 µm.
Measurements on the patient were performed pre-operatively and 30 days after ICRS implantation. The patient was stabilized using a bite bar. Alignment of the patient was achieved with respect to the anterior corneal specular reflection. All the measurements were performed in a dark room under the same conditions without the use of dilating drops. A total of five sets of 3-dimensional measurements were collected pre-operatively and post-ICRS implantation. The SLD power exposure was fixed at 800 µW. Each set of 3-D measurements was acquired in 0.72 seconds in order to minimize the impact of motion artifacts [36]. Measurements were collected on a 10 × 12 mm zone, using 50 B-Scans composed by a collection of 360 A-Scans, providing a resolution of 0.03 mm for horizontal and 0.2 mm for vertical meridian.
2.3. 3D image analysis: denoising, segmentation and surface fitting
Corneal topographic maps from normal subjects using sOCT by extracting volumetric data were described in detail in previous studies [33–36]. This study incorporates improvements for a faster and a more sensitive automatic segmentation of the surfaces, as well as new routines that have been specifically developed for the requirements of the current application. Newly developed algorithms for automatic clustering of volumetric objects have been particularly instrumental in the detection of ICRSs within the corneal volume, and the automatic pupil detection, used for referencing. The algorithm is summarized in nine steps. Only dedicated new routines are described in detail:
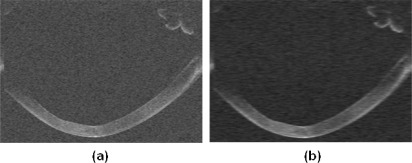
(1) Denoising: A rotational kernel transform [33] was performed for an edge-preserving denoising, using a mask of size 9 pixels. In addition, a wavelet low-pass filtering processing based on log-Gabor wavelet for 7 scales and 6 orientations was used. This procedure allows enhancing the signal-noise to ratio (SNR) by averaging across multiple scales and orientations. Figure 1 shows an illustration of a B-Scan before and after applying the denoising algorithm.
Fig. 1.
(a) Example of B-Scan from a keratoconic patient. (b) Same B-scan after the application of the denoising algorithm.
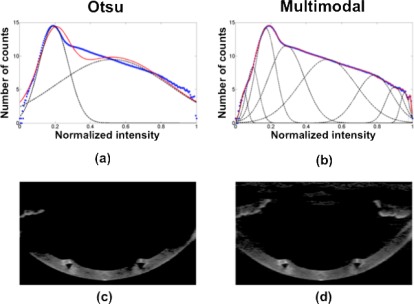
(2) Statistical thresholding: In a previous study, a derivation of the Otsu’s method was applied on individual A-Scans rather than on the B-Scans [34], allowing an adaptive treatment of the noise and signal levels of every A-Scan. For this study, an alternative strategy was developed, which allowed global application of the thresholding method. Instead of a bi-modal histogram a multimodal histogram distribution for the entire 3-D data was introduced. Using a non-linear least squares algorithm, the normalized intensity histogram of the entire 3D- data is fitted to a summation of Gaussian distributions, which provides the statistics (average and bandwidth) of a number of discrete classes. The algorithm extracts the position of the peaks of every A-Scan, and each point is identified by its position and intensity. Then, a 3D neighborhood algorithm is applied to this 3D-matrix, resulting in a set of layers of defined by the points identified by the algorithm as connected, and rejecting random peaks due to noise. Therefore, only the points belonging to classes different from noise are considered. Figure 2 shows a semi-logarithmic representation of the histogram using normalized intensity provided by the Otsu’s method (Fig. 2a) and the multi-modal fitting, providing 9 classes in this case (Fig. 2(b)). Figure 2c illustrates the result of the thresholding provided by the Otsu’s method on a cross sectional image, while Fig. 2d shows the result of the same thresholding when the multimodal fitting is applied.
Fig. 2.
(a) Semi-logarithmic representation of the 3-D image histogram using normalized intensity (blue points) and fitted data provided by the statistics of the Otsu’s statistical thresholding method (red points). (b) Result of the multi-modal fitting in red (9 different number of classes were found). In (a) and (b) classes are represented by dash black lines (c) Result of the application of the Otsu’s algorithm on a cross sectional image. (d) Result of the application of the multimodal algorithm on the same cross sectional image.
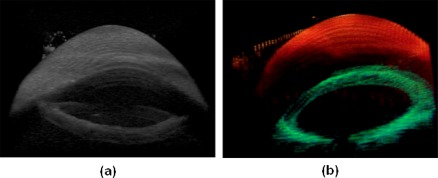
(3) Volume Clustering: As a result of the overlapping statistics of the noise and signal, randomly distributed noise is still present in the images after thresholding. We developed a volume clustering algorithm based on area or volume classification. Volumes of connected points are identified as classes. The classes with a volume size below a certain threshold are eliminated. The threshold is estimated as a certain percentile within the range of 95-99% of the total number of connected points. Figure 3 (a) shows a 3-D data set before the noise reduction, showing multiple small classes randomly distributed. After application of volume clustering the number of classes is further reduced, and the larger volumes (i.e. cornea, iris or ICRS) are automatically classified. Figure 3(b) shows the result of a volume clustering showing the automatic classification of the cornea (in red) and iris (in green).
Fig. 3.
(a) (Media 1 (5.8MB, AVI) ) Data processed applying the Otsu’s method, and therefore only considering the signal composed by only two classes (noise and signal). (b) (Media 2 (1.9MB, AVI) ) Volumetric clustering of the data after denoising (cornea is represented in red and the iris is represented in green).
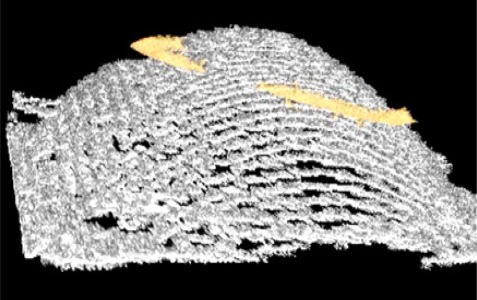
(4) Multilayer segmentation: A new approach for automatic segmentation was developed. The algorithm is based on boundary region identification (and not only maximum intensity), and allows automatic resolution of very close layers of different reflectivity. The algorithm extracts the position of the peaks of every A-Scan and they are sorted by position and intensity. Then a 3D neighborhood algorithm is applied to this 3D-matrix producing layers of connected points and rejecting random peaks due to noise. Examples of surface segmentation of the posterior corneal surface, ICRS surfaces, and the anterior corneal surface are shown in Fig. 4 and Media 3 (4.1MB, AVI) .
Fig. 4.
(Media 3 (4.1MB, AVI) ). Illustration of the multilayer segmentation in a keratoconic cornea implanted with an ICRS, showing the posterior corneal surface (white), ICRS (yellow) and the anterior corneal surface (orange, movie only).
(5) Distortion corrections: Fan distortion correction was applied for the anterior cornea, and both fan and optical distortion corrections were applied for the multiple surfaces after the anterior surface. We applied these algorithms as previously described [34,35], assuming a corneal index of refraction of 1.376. However, the presence of the ICRS (index of refraction = with 1.4914) required adjustments in the algorithm to account for the new refractive interfaces across the cornea in 3-D.
(6) Surface fitting by quadrics (biconicoid): Raw corneal elevation data from anterior and posterior surfaces were denoised by using a fitting Zernike modal expansions (55 terms, 10th order) [35,36]. This iterative method allows further rejection of spurious points in the surface, as well as the tilt correction [35]. The denoised surfaces were also fitted by quadrics. For the purposes of this study a spherical surface was used as a reference surface in corneal elevation maps, A biconicoid was used to obtain corneal shape descriptive parameters (radii of curvature Rx and Ry and conic constants Qx and Qy) [40].
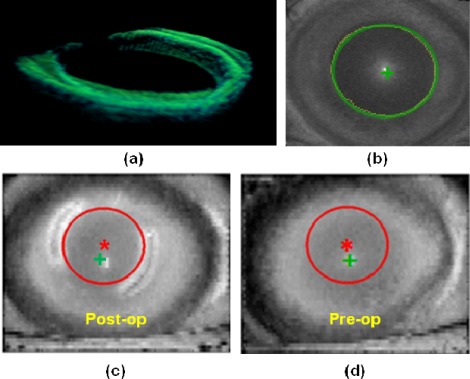
(7) Pupil center reference. The pupil center was used as a reference across measurements (i.e. pre- and post-operative) and to define the optical zone (effective area within the ICRS inner diameter). According to previous studies, the pupil center shifts little across pupil sizes and light conditions [41]. The pupil center was efficiently calculated from the clustered iris volume (Fig. 5 (a) ), by collapsing the cloud of points onto a 2-D image. The pupil center and radii were obtained from an ellipse fitting of the segmented edges using Sobel edge detector (Fig. 5(b)). The center of the ICRS inner area was calculated from the clustered ICRS volume, and ellipse fitting (Fig. 5(c)). The shift between the pupil center and the center of the inner area of the ICRS was estimated. The center of optical zone was therefore defined from post-operative parameters and used of registration of the pre-operative cornea (Fig. 5(d)). The biconic fitting of pre- and post-operative corneas was performed on 4-mm pupil diameter.
Fig. 5.
(a) Segmented (green). (b) Pupil edge fitting (detected edge in yellow and ellipse fitting in green). (c) ICRS inner diameter edge fit in the post-operative cornea (red line, and center as a red asterisk) and pupil center (green cross) (d) Evaluation of the same optical zone (in red) in the pre-operative cornea, using the pupil center as a reference.
(8) Corneal elevation maps: The maps are displayed in a square grid of 100x100 points in a 6-mm of diameter, with respect to the pupil center. This representation does not require interpolation of the data, as (unlike other approaches in Scheimpflug imaging and OCT [25,30]) the data were obtained as a dense collection of B-scans, rather than across meridians. The measured elevation is represented as the difference of corneal elevation data from the reference sphere [42], where warm colors represent points that are higher than the reference surface and cool colors represent points below the reference. The pachymetry maps were calculated from direct subtraction of the posterior corneal surface from the anterior corneal surface, after distortion corrections, and are represented using the HSV color map.
2.4. ICRS implantation evaluation
The automatic identification of the edges of the implanted ICRS volumes obtained from the clustering algorithm allows the analysis of the ICRS location in 3-D within the cornea: depth, orientation and lateral position at every corneal location. These parameters were obtained from estimations of the vertices of the ICRSs, and their geometrical center at every location. The resulting points in 3-D along an arc (for each segment) allowed estimation of the depth and position of the ICRS with respect to the anterior corneal surface. The plane containing those arcs (and its corresponding normal) was used to estimate the overall rotation of the ring (using the pupil plane as a reference).
3. Results
3.1. Posterior corneal surface change after ICRS distortion correction
Raw OCT images suggested an even larger increase of corneal thickness in the peripheral areas of the cornea, as a result of higher optical path difference through the ICRS. However, after correction of optical distortion and consideration of the actual PMMA refractive index within the segment, corneal thickness decreased by up to 35 µm in those areas. Figure 6 shows a cross section of the cornea implanted with the ICRS ring, illustrating the effect of correcting the refraction in the left segment while the right one remained un-corrected. It can be observed qualitatively that the correction reveals a more symmetric segment with flat edges.
Fig. 6.
Effect of the ICRS distortion on the corneal posterior surface. Left: Non-corrected image (red). Right: image after optical distortion correction of the ICRS (green).
3.2. Corneal shape: radii of curvature and asphericities
Tables 1 and 2 summarize the values of radius and asphericity for anterior and posterior corneal surface before and after ICRS implantation, obtained from corneal elevation fitting within the optical zone (4 mm). Data are the mean of five repeated measurements.
Table 1. Radii of the cornea before and after ICRS surgery.
| Radii of curvature (mm) | |||||
|---|---|---|---|---|---|
| Pre-op |
Post-op |
||||
| Horizontal | Vertical | Horizontal | Vertical | ||
| Anterior | 7.03 ± 0.08 | 6.51 ± 0.14 | 7.16 ± 0.16 | 6.90 ± 0.11 | |
| Posterior | 5.97 ± 0.13 | 6.32 ± 0.09 | 5.36 ± 0.14 | 6.08 ± 0.17 | |
Table 2. Asphericities of the cornea before and after ICRS surgery.
| Asphericity | |||||
|---|---|---|---|---|---|
| Pre-op |
Post-op |
||||
| Horizontal | Vertical | Horizontal | Vertical | ||
| Anterior | −1.03 ± 0.02 | −0.89 ± 0.03 | −1.07 ± 0.03 | −0.99 ± 0.02 | |
| Posterior | −1.07 ± 0.08 | −1.20 ± 0.07 | −0.86 ± 0.08 | −1.10 ± 0.10 | |
ICRS implantation produced a significant flattening of the anterior corneal surfaces (vertical 1.85%; horizontal 6.00%), and posterior corneal steepening (vertical 11.38%; horizontal 3.94%). Similarly, changes in asphericity were also higher in the vertical than in the horizontal meridian, both in the anterior (vertical 3.74%; horizontal 10.10%) and posterior (vertical 24.42%; horizontal 9.09%) cornea.
3.2 Full corneal topography
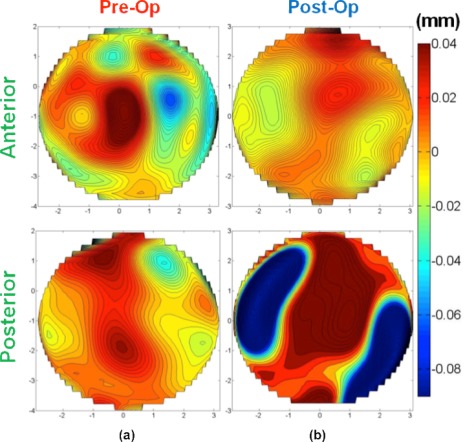
Figure 7 shows quantitative topographies of the anterior and posterior corneal surfaces before and after ICRS implantation. The pre-operative anterior corneal surface shows a 40 µm bulging (with respect to the reference sphere) near the ectactic zone, next to a −45 µm depression. Large asymmetries are also observed in the posterior cornea.
Fig. 7.
(a) Quantitative anterior and posterior corneal elevation maps of a keratoconic cornea. (b) Quantitative post-ICRS anterior and posterior corneal elevation map. All data are after refraction distortion correction, and for a 6-mm zone.
After ICRS implantation, the anterior surface of the cornea shows a more regular pattern, a shift of the area of maximum elevation and a decrease in the maximum height (down to 15 µm.). The ICRS produces a stretching that decreases elevation (−20 µm) in the area above the ICRS. The posterior topographic map is consistent with a lateral stretching in the optical zone induced by the action of ICRS, and shows an effective protrusion of the cornea areas behind the ICRS.
3.3. Corneal pachymetry
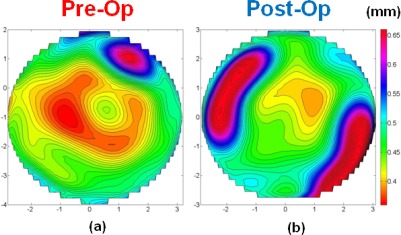
ICRS implantation increased the minimum corneal thickness (from 353 ± 15 µm pre-operatively and 429 ± 15 µm post-ICRS), and decreased the overall corneal thickness asymmetry (Fig. 8 ). The post-ICRS pachymetry map is consistent with a lateral stretching within the optical zone induced by the action of ICRS. At the location of the ICRS (i.e. beyond the optical zone) corneal thickness effectively increased, indicating an axial stretching of the cornea by the ICRS.
Fig. 8.
Quantitative pachymetry map of keratoconic cornea (a) before and (b) after ICRS implantation. Data are for a 6-mm zone.
3.4. ICRS location
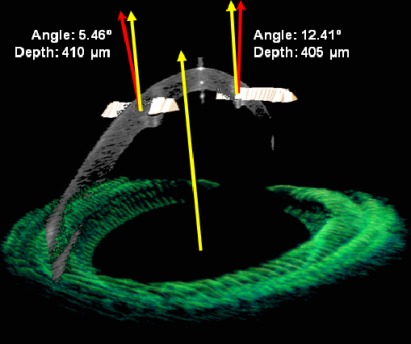
Figure 9 shows an illustration of the estimated location and orientation of the ICRS inside the cornea in 3-D. The ICRS center of mass was measured to be at a depth from the anterior corneal surface ranging from 350 to 470 μm (left segment) and from 360 to 450 (right segment). The ICRS was tilted 5.46 ± 1.16° (left segment) and 12.41 ± 1.65° (right segment) with respect to the pupil plane, and laterally decentered (−0.10 ± 0.05 mm in the horizontal direction and −0.34 ± 0.10 mm in the vertical direction) with respect to the pupil center.
Fig. 9.
3-D analysis of the orientation (with respect to the pupil plane) and average depth (with respect to the anterior cornea) of the left and right ICRS. The red arrows are normal to the plane of the ICRS, and the yellow arrows are normal to the pupil.
4. Discussion
The capability of the OCT for obtaining accurate topographies from the anterior corneal surface has been reported in a recent publication [35]. In this study, the application of the algorithms for reconstructing accurate corneal elevation maps after application of optical and fan distortion correction [33–35], as well as new dedicated processing algorithms for automatic segmentation and volume clustering has opened the possibility for automatic corneal topographies and quantitative characterization of keratoconic eyes before and after ICRS implantation. This application is particularly demanding, as keratoconic corneas are irregular, and the ICRS are foreign objects within the cornea with a different refractive index. The high-resolution of the OCT, together with the acquisition of 3-D corneal images (rather than meridional cross section) allows reconstruction of a dense corneal volume. The methods of analysis of the OCT corneal images presented in this study have resulted in powerful tool for quantitative evaluation of the keratoconic cornea and its change after ICRS implantation, even beyond the optical zone limited by the inner diameter of the ICRS. While the anterior corneal topography in keratoconic patients has been reported extensively with different corneal topographers, primarily Placido videokeratoscopy, the changes in the posterior corneal changes are debated. It is thought that the first topographical changes in keratoconus are presented on the posterior corneal surface, corresponding to an increased posterior corneal elevation and a focal thinning [16–19], although further investigations are needed, as some of the commercially available devices to measure posterior corneal surface are either not well validated or suffer from optical distortions from the anterior corneal surface. Therefore, a more sensitive posterior corneal elevation measurement, corrected from the refractive effects of the (very irregular) anterior corneal surface can be critical in the diagnosis and monitoring of keratoconus.
The automatic tools developed for analysis of the keratoconic cornea in this study provide extensive information of the geometrical features of the keratoconic corneas based on OCT imaging, including anterior and posterior corneal elevation maps, pachymetric maps, 3-D location of the ectatic area, corneal apex and pupil center for referencing (reported as a more suitable reference than the specular reflection [30]. This information is essential in planning treatment, in particular ICRS implantation. Additional automatic tools have been developed to characterize the ICRS implant, and the geometrical corneal changes following ICRS, all based on OCT imaging. In this patient, the ICRS produced a significant anterior corneal flattening within the optical zone. We also showed a steepening of the posterior corneal surface inside the ICRS optical zone. It is likely that the distortion produced by the ICRS on the posterior corneal surface, if not corrected using the ICRS index of refraction, may result in inaccuracy of the curvature data provided by other instruments, even within the optical zone. Furthermore, the correction of the optical distortion produced by the anterior corneal surface, as well as by the ICRS in the OCT images, allows analysis of the corneal topography even in peripheral corneal areas. The quantitative corneal surface maps (Fig. 7) suggest a lateral stretch produced by the ICRS. The quantitative pachymetric maps (Fig. 8) suggest a redistribution of corneal thickness which could help in delaying the progression of keratoconus. The automatic volume clustering and surface segmentation tools allowed a comprehensive description of the 3-D location of the ICRS, and therefore to evaluate the implantation and monitor potential longitudinal changes, as well as correlations between the geometrical and optical outcomes and the geometrical properties and location of the ring.
5. Conclusions
Anterior segment OCT provided with fan and optical distortion correction and automatic analysis tools is an excellent instrument for evaluating keratoconus. Furthermore, OCT quantitative imaging allows comprehensive 3-D quantitative analysis of the keratoconic cornea and the changes produced by ICRS treatment, as well as monitoring of the ICRS three-dimensional location. ICRS produced a flattening of the anterior surface, steepening of the posterior surface, meridional differences in the changes of radii if curvature and asphericities, a symmetrization of the anterior corneal and a redistribution of corneal thickness.
Acknowledgments
The authors acknowledge funding from MICINN FIS2008-02065 and FIS2011-25637, EURHORCs-ESF EURYI-05-102-ES, ERC-2011-AdG-294099 and CEN-2091021 to S. Marcos.
References and links
- 1.Rabinowitz Y. S., “Keratoconus,” Surv. Ophthalmol. 42(4), 297–319 (1998). 10.1016/S0039-6257(97)00119-7 [DOI] [PubMed] [Google Scholar]
- 2.Barbero S., Marcos S., Merayo-Lloves J., Moreno-Barriuso E., “Validation of the estimation of corneal aberrations from videokeratography in keratoconus,” J. Refract. Surg. 18(3), 263–270 (2002). [DOI] [PubMed] [Google Scholar]
- 3.Kymes S. M., Walline J. J., Zadnik K., Sterling J., Gordon M. O., Collaborative Longitudinal Evaluation of Keratoconus Study Group , “Changes in the quality-of-life of people with keratoconus,” Am. J. Ophthalmol. 145(4), 611–617.e1 (2008). 10.1016/j.ajo.2007.11.017 [DOI] [PMC free article] [PubMed] [Google Scholar]
- 4.Nordan L. T., “Keratoconus: diagnosis and treatment,” Int. Ophthalmol. Clin. 37(1), 51–63 (1997). 10.1097/00004397-199703710-00005 [DOI] [PubMed] [Google Scholar]
- 5.Mamalis N., Anderson C. W., Kreisler K. R., Lundergan M. K., Olson R. J., “Changing trends in the indications for penetrating keratoplasty,” Arch. Ophthalmol. 110(10), 1409–1411 (1992). 10.1001/archopht.1992.01080220071023 [DOI] [PubMed] [Google Scholar]
- 6.Javadi M. A., Motlagh B. F., Jafarinasab M. R., Rabbanikhah Z., Anissian A., Souri H., Yazdani S., “Outcomes of penetrating keratoplasty in keratoconus,” Cornea 24(8), 941–946 (2005). 10.1097/01.ico.0000159730.45177.cd [DOI] [PubMed] [Google Scholar]
- 7.Wollensak G., Spoerl E., Seiler T., “Riboflavin/ultraviolet-a-induced collagen crosslinking for the treatment of keratoconus,” Am. J. Ophthalmol. 135(5), 620–627 (2003). 10.1016/S0002-9394(02)02220-1 [DOI] [PubMed] [Google Scholar]
- 8.Colin J., Cochener B., Savary G., Malet F., “Correcting keratoconus with intracorneal rings,” J. Cataract Refract. Surg. 26(8), 1117–1122 (2000). 10.1016/S0886-3350(00)00451-X [DOI] [PubMed] [Google Scholar]
- 9.Siganos D., Ferrara P., Chatzinikolas K., Bessis N., Papastergiou G., “Ferrara intrastromal corneal rings for the correction of keratoconus,” J. Cataract Refract. Surg. 28(11), 1947–1951 (2002). 10.1016/S0886-3350(02)01495-5 [DOI] [PubMed] [Google Scholar]
- 10.Alió J. L., Salem T. F., Artola A., Osman A. A., “Intracorneal rings to correct corneal ectasia after laser in situ keratomileusis,” J. Cataract Refract. Surg. 28(9), 1568–1574 (2002). 10.1016/S0886-3350(01)01275-5 [DOI] [PubMed] [Google Scholar]
- 11.Barraquer J. I., “Modification of refraction by means of intracorneal inclusions,” Int. Ophthalmol. Clin. 6(1), 53–78 (1966). [PubMed] [Google Scholar]
- 12.Blavatskaya E. D., “Intralamellar homoplasty for the purpose of relaxation of refraction of the eye,” Arch. Soc. Am. Ophthalmol. Optom. 6, 311–325 (1968). [Google Scholar]
- 13.Burris T. E., Baker P. C., Ayer C. T., Loomas B. E., Mathis M. L., Silvestrini T. A., “Flattening of central corneal curvature with intrastromal corneal rings of increasing thickness: an eye-bank eye study,” J. Cataract Refract. Surg. 19(Suppl), 182–187 (1993). [DOI] [PubMed] [Google Scholar]
- 14.Burris T. E., “Intrastromal corneal ring technology: results and indications,” Curr. Opin. Ophthalmol. 9(4), 9–14 (1998). 10.1097/00055735-199808000-00003 [DOI] [PubMed] [Google Scholar]
- 15.Piñero D. P., Alio J. L., Teus M. A., Barraquer R. I., Uceda-Montañés A., “Modeling the intracorneal ring segment effect in keratoconus using refractive, keratometric, and corneal aberrometric data,” Invest. Ophthalmol. Vis. Sci. 51(11), 5583–5591 (2010). 10.1167/iovs.09-5017 [DOI] [PubMed] [Google Scholar]
- 16.Maguire L. J., Bourne W. M., “Corneal topography of early keratoconus,” Am. J. Ophthalmol. 108(2), 107–112 (1989). [DOI] [PubMed] [Google Scholar]
- 17.Rabinowitz Y. S., McDonnell P. J., “Computer-assisted corneal topography in keratoconus,” Refract. Corneal Surg. 5(6), 400–408 (1989). [PubMed] [Google Scholar]
- 18.Maeda N., Klyce S. D., Smolek M. K., Thompson H. W., “Automated keratoconus screening with corneal topography analysis,” Invest. Ophthalmol. Vis. Sci. 35(6), 2749–2757 (1994). [PubMed] [Google Scholar]
- 19.Tomidokoro A., Oshika T., Amano S., Higaki S., Maeda N., Miyata K., “Changes in anterior and posterior corneal curvatures in keratoconus,” Ophthalmology 107(7), 1328–1332 (2000). 10.1016/S0161-6420(00)00159-7 [DOI] [PubMed] [Google Scholar]
- 20.Dauwe C., Touboul D., Roberts C. J., Mahmoud A. M., Kérautret J., Fournier P., Malecaze F., Colin J., “Biomechanical and morphological corneal response to placement of intrastromal corneal ring segments for keratoconus,” J. Cataract Refract. Surg. 35(10), 1761–1767 (2009). 10.1016/j.jcrs.2009.05.033 [DOI] [PubMed] [Google Scholar]
- 21.Kamburoglu G., Ertan A., Saraçbasi O., “Measurement of depth of Intacs implanted via femtosecond laser using Pentacam,” J. Refract. Surg. 25(4), 377–382 (2009). 10.3928/1081597X-20090401-05 [DOI] [PubMed] [Google Scholar]
- 22.Reinstein D. Z., Srivannaboon S., Holland S. P., “Epithelial and stromal changes induced by intacs examined by three-dimensional very high-frequency digital ultrasound,” J. Refract. Surg. 17(3), 310–318 (2001). [DOI] [PubMed] [Google Scholar]
- 23.Kawana K., Miyata K., Tokunaga T., Kiuchi T., Hiraoka T., Oshika T., “Central corneal thickness measurements using Orbscan II scanning slit topography, noncontact specular microscopy, and ultrasonic pachymetry in eyes with keratoconus,” Cornea 24(8), 967–971 (2005). 10.1097/01.ico.0000159733.37554.ba [DOI] [PubMed] [Google Scholar]
- 24.de Sanctis U., Missolungi A., Mutani B., Richiardi L., Grignolo F. M., “Reproducibility and repeatability of central corneal thickness measurement in keratoconus using the rotating Scheimpflug camera and ultrasound pachymetry,” Am. J. Ophthalmol. 144(5), 712–718.e1 (2007). 10.1016/j.ajo.2007.07.021 [DOI] [PubMed] [Google Scholar]
- 25.Shankar H., Taranath D., Santhirathelagan C. T., Pesudovs K., “Repeatability of corneal first-surface wavefront aberrations measured with Pentacam corneal topography,” J. Cataract Refract. Surg. 34(5), 727–734 (2008). 10.1016/j.jcrs.2007.11.056 [DOI] [PubMed] [Google Scholar]
- 26.Read S. A., Collins M. J., Iskander D. R., Davis B. A., “Corneal topography with Scheimpflug imaging and videokeratography: comparative study of normal eyes,” J. Cataract Refract. Surg. 35(6), 1072–1081 (2009). 10.1016/j.jcrs.2009.01.020 [DOI] [PubMed] [Google Scholar]
- 27.Pérez-Escudero A., Dorronsoro C., Sawides L., Remón L., Merayo-Lloves J., Marcos S., “Minor influence of myopic laser in situ keratomileusis on the posterior corneal surface,” Invest. Ophthalmol. Vis. Sci. 50(9), 4146–4154 (2009). 10.1167/iovs.09-3411 [DOI] [PubMed] [Google Scholar]
- 28.Grulkowski I., Gora M., Szkulmowski M., Gorczynska I., Szlag D., Marcos S., Kowalczyk A., Wojtkowski M., “Anterior segment imaging with Spectral OCT system using a high-speed CMOS camera,” Opt. Express 17(6), 4842–4858 (2009). 10.1364/OE.17.004842 [DOI] [PubMed] [Google Scholar]
- 29.Li Y., Meisler D. M., Tang M., Lu A. T. H., Thakrar V., Reiser B. J., Huang D., “Keratoconus diagnosis with optical coherence tomography pachymetry mapping,” Ophthalmology 115(12), 2159–2166 (2008). 10.1016/j.ophtha.2008.08.004 [DOI] [PMC free article] [PubMed] [Google Scholar]
- 30.Li Y., Tang M., Zhang X., Salaroli C. H., Ramos J. L., Huang D., “Pachymetric mapping with Fourier-domain optical coherence tomography,” J. Cataract Refract. Surg. 36(5), 826–831 (2010). 10.1016/j.jcrs.2009.11.016 [DOI] [PMC free article] [PubMed] [Google Scholar]
- 31.Rao H. L., Kumar A. U., Kumar A., Chary S., Senthil S., Vaddavalli P. K., Garudadri C. S., “Evaluation of central corneal thickness measurement with RTVue spectral domain optical coherence tomography in normal subjects,” Cornea 30(2), 121–126 (2011). 10.1097/ICO.0b013e3181e16c65 [DOI] [PubMed] [Google Scholar]
- 32.Ishibazawa A., Igarashi S., Hanada K., Nagaoka T., Ishiko S., Ito H., Yoshida A., “Central corneal thickness measurements with Fourier-domain optical coherence tomography versus ultrasonic pachymetry and rotating Scheimpflug camera,” Cornea 30(6), 615–619 (2011). 10.1097/ICO.0b013e3181d00800 [DOI] [PubMed] [Google Scholar]
- 33.Ortiz S., Siedlecki D., Grulkowski I., Remon L., Pascual D., Wojtkowski M., Marcos S., “Optical distortion correction in optical coherence tomography for quantitative ocular anterior segment by three-dimensional imaging,” Opt. Express 18(3), 2782–2796 (2010). 10.1364/OE.18.002782 [DOI] [PubMed] [Google Scholar]
- 34.Ortiz S., Siedlecki D., Remon L., Marcos S., “Optical coherence tomography for quantitative surface topography,” Appl. Opt. 48(35), 6708–6715 (2009). 10.1364/AO.48.006708 [DOI] [PubMed] [Google Scholar]
- 35.Ortiz S., Siedlecki D., Pérez-Merino P., Chia N., de Castro A., Szkulmowski M., Wojtkowski M., Marcos S., “Corneal topography from spectral optical coherence tomography (sOCT),” Biomed. Opt. Express 2(12), 3232–3247 (2011). 10.1364/BOE.2.003232 [DOI] [PMC free article] [PubMed] [Google Scholar]
- 36.Ortiz S., Siedlecki D., Remon L., Marcos S., “Three-dimensional ray tracing on Delaunay-based reconstructed surfaces,” Appl. Opt. 48(20), 3886–3893 (2009). 10.1364/AO.48.003886 [DOI] [PubMed] [Google Scholar]
- 37.Zhao M., Kuo A. N., Izatt J. A., “3D refraction correction and extraction of clinical parameters from spectral domain optical coherence tomography of the cornea,” Opt. Express 18(9), 8923–8936 (2010). 10.1364/OE.18.008923 [DOI] [PubMed] [Google Scholar]
- 38.Karnowski K., Kaluzny B. J., Szkulmowski M., Gora M., Wojtkowski M., “Corneal topography with high-speed swept source OCT in clinical examination,” Biomed. Opt. Express 2(9), 2709–2720 (2011). 10.1364/BOE.2.002709 [DOI] [PMC free article] [PubMed] [Google Scholar]
- 39.Lai M. M., Tang M., Andrade E. M., Li Y., Khurana R. N., Song J. C., Huang D., “Optical coherence tomography to assess intrastromal corneal ring segment depth in keratoconic eyes,” J. Cataract Refract. Surg. 32(11), 1860–1865 (2006). 10.1016/j.jcrs.2006.05.030 [DOI] [PMC free article] [PubMed] [Google Scholar]
- 40.Pérez-Escudero A., Dorronsoro C., Marcos S., “Correlation between radius and asphericity in surfaces fitted by conics,” J. Opt. Soc. Am. A 27(7), 1541–1548 (2010). 10.1364/JOSAA.27.001541 [DOI] [PubMed] [Google Scholar]
- 41.Yang Y., Thompson K., Burns S. A., “Pupil location under mesopic, photopic, and pharmacologically dilated conditions,” Invest. Ophthalmol. Vis. Sci. 43(7), 2508–2512 (2002). [PMC free article] [PubMed] [Google Scholar]
- 42.Warnicki J. W., Rehkopf P. G., Curtin D. Y., Burns S. A., Arffa R. C., Stuart J. C., “Corneal topography using computer analyzed rasterstereographic images,” Appl. Opt. 27(6), 1135–1140 (1988). 10.1364/AO.27.001135 [DOI] [PubMed] [Google Scholar]


