Abstract
A spectral domain optical coherence tomography (SD-OCT) system and an oral imaging probe have been developed to visualize the microstructural morphology and microvasculature in the human oral cavity. Structural OCT images of ex vivo pig oral tissues with the histology of the same sites were acquired and compared for correlations. Structural in vivo OCT images of healthy human tissue as well as a pathologic site (ulcer) were obtained and analyzed based on the results of the ex vivo pig study, drawing on the similarity between human and swine oral tissues. In vivo Doppler and speckle variance OCT images of the oral cavity in human volunteers were also acquired, to demonstrate the feasibility of microvascular imaging of healthy and pathologic (scar) oral tissue.
OCIS codes: (110.4500) Optical coherence tomography, (170.4500) Optical coherence tomography, (170.1610) Clinical applications, (170.2655) Functional monitoring and imaging, (170.3880) Medical and biological imaging, (170.4580) Optical diagnostics for medicine
1. Introduction
Optical coherence tomography (OCT) is a micrometer-scale-resolution imaging modality which provides depth resolved images of biological tissue to ~2 mm beneath the tissue surface [1]. Currently, Fourier-domain OCT (FD-OCT) has largely replaced the older time-domain embodiments for clinical applications [1–3], owing to advantages in imaging speed, SNR, and phase stability [1]. Moreover, use of optical fiber technology has enabled the development of compact OCT systems with localized optical probes [4] suitable for various clinical applications, such as gastrointestinal [3] and intravascular imaging [5]. FD-OCT systems are categorized into two types: swept-source OCT (SS-OCT) and spectral-domain OCT (SD-OCT) [1]. In SS-OCT, the combination of a narrow bandwidth laser and a wavelength sweeping mechanism (e.g., a polygon mirror, a MEMS tunable filter) shines different wavelengths on the sample. A single detector is then used to detect the back-scattered light of different wavelengths [1]. In SD-OCT, as employed in the current study, a broad bandwidth light source is used and the back-scattered signal is detected by a spectrometer-CCD camera system [1]. Both SS-OCT and SD-OCT have been used for oral imaging [6,7], which is the focus of the current study.
Two-dimensional OCT depth images (known as structural OCT) have been used in a number of ex vivo and in vivo feasibility studies to detect oral disorders, such as mucositis [8,9], leukoplakia [10,11], submucosal fibrosis [6], and squamous cell carcinoma [10,12–15]. These studies have monitored changes in the layer definition and backscattering properties of oral OCT structural images to detect abnormalities. For example, disruptions in the epithelium (so called loss of polarity) seen on structural OCT images of a hamster cheek pouch has been used as an indicator for dysplasia [10], and the existence of voids as an indicator for cystic regions [11]. Moreover, changes in layer definitions such as in the epithelium have been used to quantify the severity of radiation toxicity during the course of radio(chemo)therapy [8] or in post-irradiated mice [9], as well as to demonstrate the stage of dysplasia in hamsters [12]. Some studies have quantified change in the layer thickness and have performed statistical analysis to determine a relation between the severity of fibrosis [6] or the stage of squamous cell carcinoma [15] and layer thickness. However, most of the studies have provided little information on the vascular features of oral tissue. In selected works, oral blood vessels in the lamina propria have been detected on the structural OCT images [6,16]; however, vasculature is difficult to detect directly on structural images, and the inability to monitor blood flow dynamics suggests the utility of functional technique extensions, such as Doppler OCT [17] or speckle variance OCT (svOCT) [18].
Doppler OCT is a blood flow detection method based on measuring the phase change of the light back-scattered from red blood cells. Due to the difficulties posed by motion artifacts in imaging living tissue, the Doppler method for oral imaging has been limited to the detection of single vessels in animal models such as hamsters [7,19]. SvOCT is another extension of vasculature detection techniques based on calculating the variance of speckle temporal modulation of the OCT images. Vasculature regions decorrelate faster compared to more ‘solid’ surrounding tissues, and this difference in OCT speckle statistics can be exploited to yield highly detailed depth resolved maps of microvasculature [18,20]. Similar to Doppler detection, this method is also sensitive to tissue motion, and has mostly been used on animals where immobilization methods could be applied to keep the region of interest more steady, such as a window chamber [18]. To our knowledge, svOCT has so far only been implemented for SS-OCT systems and has not yet been reported in SD-OCT or used for human oral imaging [18,20].
The aim of this study was to develop a SD-OCT system and a modular OCT probe suitable for in vivo human oral imaging, and to demonstrate its feasibility for in vivo monitoring of structural and vascular features in healthy and pathologic human oral mucous membrane. For this, ex vivo pig oral tissue was imaged and validated with histology, to help interpret the acquired OCT structural images. The resultant structural OCT imaging “atlas” was useful for interpreting the in vivo images of human volunteers, as there are extensive tissue morphology similarities between pig and human oral tissue [21]. Doppler and svOCT were performed to demonstrate the feasibility of microvascular monitoring in in vivo healthy oral tissue. Moreover, svOCT was also used to show the feasibility of monitoring vascular changes in a pathologic site (scar). To our knowledge, this is the first use of svOCT for monitoring human microvasculature in both healthy and pathologic oral sites.
2. Materials and methods
2.1. SD-OCT system design
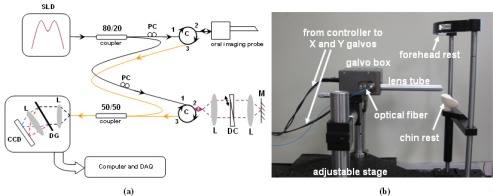
The SD-OCT system shown in Fig. 1(a) was based on a compact, fiber optic Michelson interferometer, connected to a broad bandwidth superluminescent diode, SLD (Superlum Ltd., λc = 1322 nm, Δλ = 113 nm, Pout = 13 mW). The reference arm was comprised of an achromatic collimator (Edmund Optics), a custom tunable dispersion compensation unit based on a pair of BK7 glass prisms, a focusing achromatic lens and a silver-coated mirror mounted on a translation stage. The sample arm was interfaced to the OCT probe for oral tissue imaging (Fig. 1(b)). The interference signal was detected with a custom-made, high performance spectrometer (P&P Optica Inc.), interfaced to a 1024 pixel linear array InGaAs camera (SUI, Goodrich Corp.) with 47 kHz readout rate. The probe was comprised of a fiber collimator (Thorlabs), a pair of galvanometric scanners (Cambridge Technologies) for laterally scanning the beam, and three lenses (Edmund Optics), two (40 mm focal length) for relaying the beam and one (20 mm focal length) as the objective lens. The optics were housed in a 17 cm long, 2 cm (dia) rigid tube, while the scanners and the collimator were packaged in a small, easy to handle box that was attached to the tube through a threaded fixture. ZEMAX software was used to simulate and optimize the design of the imaging probe. The maximum lateral field-of-view available through the motion of scanning mirrors was ~2 mm by 2 mm.
Fig. 1.
(a) Schematic of the SD-OCT system. M: mirror, L: lens, DC: dispersion compensation unit, PC: polarization controllers, DG: diffraction grating, C: circulators (b) Stage for human oral imaging, comprised of the custom-made probe and a head frame. For clarity, the fibers attached to the input (80/20) and output (50/50) couplers are shown in two different colors.
The components of the imaging system were placed on a wheeled cart to facilitate system portability in a clinical environment. In order to perform in vivo oral imaging, the probe was mounted on an adjustable stage, which was fixed to a table. To minimize involuntary head motion during the imaging procedure, a head frame was used (Fig. 1(b)). To image the oral cavity, the tube section of the probe was inserted into the subject’s mouth and mechanical translation stages were used to adjust the position of the probe. In order to keep the probe sterile, the tube was covered with a transparent sterile sheath. The measured attenuation through the sheath was ~0.3 dB. The angled end of the tube facilitated rejection of unwanted specular reflection from the tissue.
2.2. System specifications
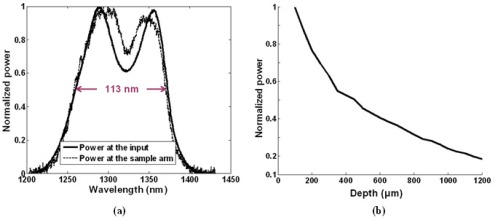
A series of characterization tests were performed to determine system imaging parameters. The axial resolution was measured to be 7 μm in air, corresponding to 5.1 μm in tissue (assuming average refractive index of tissue ~1.38). The spectra of the light input to the OCT system and the output light at the sample are shown in Fig. 2(a) , suggesting minimal spectral distortions. The lateral resolution was expected to be 19 μm, based on the ZEMAX calculations. This was confirmed (less than 8% error) by the measurements made on a U.S. Air Force target (Edmund Optics). For this test, multiple B-scans of the target were acquired and summed in the axial direction to produce a projected en face image. The smallest recognizable line pair in the image was taken as the lateral resolution of the system. The imaging depth, dependent on the number of CCD pixels [22], was 1.4 mm in tissue. The signal-to-noise-ratio (SNR) of the system (in air) drops off from 98 dB at ~200 μm to 85 dB at ~1.2 mm (Fig. 2(b)). The focus of the OCT beam at the sample arm was 20 mm away from the objective lens (working distance ~10 mm, as measured from the end of the lens tube). During each imaging session, the focus was placed at a different depth in tissue (~200 μm-700 μm) by adjusting the length of the sample arm. This was done to achieve higher signal sensitivity on the depth of interest and to acquire images with greater contrast. Each two-dimensional image had 512 pixels along the axial dimension and its number of pixels along the lateral direction was equal to the number of A-scans that corresponded to the processed image (1,000 for structural, 5,000 for Doppler, and 200 for svOCT).
Fig. 2.
(a) Comparison of the light source spectrum at the input to the OCT system (solid line) and at the output of the sample arm (dashed line). The very similar shape and bandwidth signifies that the optics in the OCT system have not caused a spectral distortion (narrowing) and thus a potential reduction of the axial resolution of the system. (b) Decrease in system SNR (proportional to power at the sample arm) as a function of depth, implying a ~13 dB reduction in SNR when going from a depth of ~200 μm to ~1200 μm. The graph is a continuous representation of 22 point measurements.
2.3. Signal acquisition and processing
To control and synchronize the CCD camera with the galvanometric scanners, a LabVIEW (National Instruments) program was written that acquired the data from the camera, displayed the unprocessed OCT image in real time and saved it for further processing. To create the structural, Doppler or svOCT images, post processing was accomplished via MATLAB (MathWorks). In addition, the following signal processing steps were performed to improve image quality or to detect the presence of vasculature: i) numerical dispersion compensation [22], ii) Kasai velocity estimation in combination with motion artifact removal algorithms [17] on Doppler images to identify blood flow, and iii) averaging and variance calculations [23], together with median filtering, on svOCT data to produce the microvasculature map.
2.4. Ex vivo pig oral imaging
Excised tissue of different oral sections of inbred Yorkshire pigs was imaged using the developed SD-OCT system. As the oral tissue of pig is very similar to that of human, these experiments were performed to better understand how certain anatomical features (in histology) appear in OCT images, thus acting as a reference in identification of different layers and structures in the subsequent in vivo structural OCT images of human oral tissue.
Four different regions of oral tissue were excised from a pig, just before euthanasia after a gastrointestinal surgery session: labial mucosa, buccal mucosa, dorsal tongue, and ventral tongue. OCT imaging began ~30 minutes after tissue excision and lasted for ~30 minutes. During these times, tissue samples were kept in 0.9% saline. Based on a study on the effect of various tissue handling / preservation methods [24], the samples were not expected to undergo major structural changes within this time interval if kept in saline. After imaging, 1-2 small sections of each type of the imaged tissues were fixed in 10% formalin for 24 hours, then transferred to 70% ethanol solution and sent for hematoxylin and eosin (H&E) histology.
2.5. In vivo human oral imaging
The oral cavity of four healthy human volunteers was imaged. B-scans of labial and buccal mucosa; dorsal, lateral, and ventral tongue and soft palate yielded structural, Doppler and svOCT images of these sites in vivo. Drawing on the results from the ex vivo pig oral OCT images and histology study, a reference atlas was derived on how different oral tissue structures are represented in the OCT images. Based on this reference and general human oral histology [25,26], the acquired in vivo human oral images were interpreted and labeled. We also imaged part of the labial mucous membrane of a volunteer who had developed oral ulcer (about 3 mm in diameter) due to self-biting and oral trauma, and a healthy region of the labial tissue of the same subject, in order to highlight the changes in structural OCT images. Moreover, svOCT image of a scar in a volunteer’s labial tissue was taken and compared to that of the healthy labial tissue of the same volunteer to demonstrate changes in the vascular features between a healthy and a pathology site.
Blood flow information was obtained via color Doppler imaging on the tissue to acquire the phase shift induced by moving scatterers (red blood cells) over consecutive A-scans. The phase change was calculated and the corresponding axial velocity component was computed by using the Doppler equation [17]:
| (1) |
where is the red blood cell velocity in the depth direction (independent of the angle between the imaging beam and the blood vessel). is the central wavelength (1322 nm), n is the refractive index, and is the Doppler frequency which depends on the detected phase shift () and the time between two consecutive phase measurements () according to
| (2) |
The velocity component in the depth direction () was color-coded and overlaid on the corresponding structural OCT image.
To determine the minimum and maximum vessel size detected via color Doppler, the number of colored pixels along the cross section of the vessel in the axial direction was counted and converted to distance units (microns). We chose the depth dimension because the axial resolution of the system was ~4 times higher compared to the lateral, and thus finer features could be differentiated in the axial direction.
SvOCT images were also obtained to detect the microvasculature in the labial mucous membrane of the human volunteers (both in healthy and scar tissue). This variant of OCT calculates the temporal signal variance from consecutive B-scans [23]. Based on viscosity contrast between ‘liquid’ and ‘solid’ compartments of biological tissue, the svOCT images thus yield a three-dimensional map of tissue microvasculature with high sensitivity; these can be projected onto a two-dimensional en face plane for ease of visualization and display. In contrast to Doppler approaches, the speckle variance methods are not phase-resolved, instead relying on the comparisons of consecutive structural (B-mode) OCT images; as such, the resultant maps are flow and angle-independent [18,23]. Since many consecutive B-scans are required from each imaged area to enable svOCT signal processing [18], this method is also susceptible to bulk tissue motion artifacts and thus benefits from faster imaging. Median filters were implemented during post-processing to decrease the motion artifacts [23].
To assess the svOCT images acquired from the scar in the labial tissue and compare it to svOCT of the corresponding ‘control’ (healthy labial region), the volumetric vessel density was calculated from the three-dimensional svOCT data set, based on the method applied by Standish et al. for two dimensional Doppler images [27]. A MATLAB-based code was written to count the proportion of nonzero intensity pixels (color coded orange in svOCT images) relative to the total number of pixels in the volumetric image, where zero value pixels represent regions that lack vasculature. Occasional B-scans in the volumetric image set which were affected by motion artifacts (false increase in the speckle variance intensity that manifest as horizontal streaks for that B-scan) were removed from these vessel density calculations. The calculations were performed for two svOCT three-dimensional data sets from the labial scar region and for two three-dimensional data sets of the corresponding control healthy labial tissue. For all four images, the calculation was done for a 1 mm x 1 mm (laterally) x 0.6 mm (depth) ROI tissue volume, with upper boundary at ~100 μm beneath the tissue surface.
2.6. Assessing the acquired images
To label the acquired ex vivo pig oral images, an OCT scientist (B. D.) and a pathologist (G. A.) separately correlated a number of acquired OCT images with the histology obtained from the imaged regions, and labeled different features in these images. For the in vivo human oral imaging study, as histology was not performed, the OCT expert and the pathologist labeled the structural OCT images based on a priori knowledge of human oral anatomy, as well as the results from correspondence between histology and ex vivo OCT structural swine study above. The vast majority of the image features were labeled similarly by both individuals.
3. Results
3.1. Ex vivo structural OCT imaging of pig oral tissue
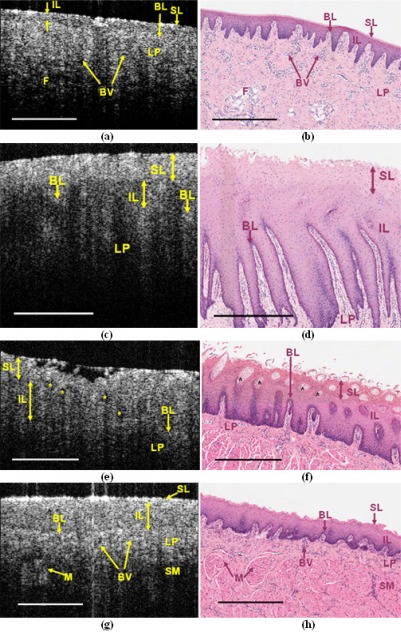
Structural OCT images of the excised pig oral tissue were taken, followed by standard histological preparations for image features validation. Due to the similarity of pig and human oral tissues, this also served as a reference for interpreting the structural OCT results of the in vivo human study (section 3.2). The structural OCT images of pig excised tissue and their corresponding histology are demonstrated in Fig. 3 . The general structures of the oral tissue are similar in both the OCT and histological images, as explored in greater detail below.
Fig. 3.
Ex vivo images of pig oral tissue, (a) OCT image and (b) H&E histology of labial tissue; (c) OCT image and (d) H&E histology of buccal tissue; (e) OCT image and (f) H&E histology of dorsal tongue; (g) OCT image and (h) H&E histology of ventral tongue. SL: superficial layer, IL: intermediate layer, BL: basal layer, LP: lamina proria, SM: submucosa, F: fat, M: muscle, BV: blood vessel, *: taste bud. Scale bar = 500 μm.
Two major tissue layers can be distinguished in the pig oral tissue as demonstrated in Fig. 3, within ~1.5 mm of the tissue surface. These are the epithelium (which consists of superficial, intermediate and basal layers) and the lamina propria. In some oral tissues, for example the ventral tongue, the submucosa is also located within this 1.5 mm depth range and can thus be visualized. The thickness of each of these layers varies in different oral regions, as represented in the OCT images and validated through histology. For example, in Fig. 3(a), the epithelium of labial tissue can be distinguished as a 100-200 μm thick layer, consisting of superficial (the top hyper-reflective), intermediate (lower reflectivity), and basal layer (very thin and hyper-reflective). The latter separates the intermediate layer from the lamina propria. As demonstrated in the OCT and histological images, vessels can be identified in the lamina propria. They are characterized on OCT images as small dark features throughout the lamina propria. The region on the bottom left of Fig. 3(a) is suspected fat tissue, identified as a hypo-reflective region with dispersed hyper-reflective spots, but cannot be confirmed due to low SNR at this depth. Figure 3(c) corresponds to the buccal tissue which is characterized by a thicker epithelium compared to labial tissue. Here, the thicker hyper-reflective superficial layer can be distinguished above the hypo-reflective intermediate layer which is separated from the lamina propria by the thin hyper-reflective basal layer. Due to the thickness of the buccal epithelium and sensitivity reduction with depth, the features in the lamina propria, such as blood vessels, cannot be easily distinguished. Figure 3(e) shows the OCT image of the dorsal region of the tongue. The top keratin layer and its shedding are seen in both the OCT and histology. Note that the high reflection on the top of the OCT image is due to accumulation of saline, which was used to keep the tissue hydrated. Dorsal tongue image shows thin superficial and thick intermediate layers, both of which contain numerous taste buds. These appear as hypo-reflective regions dispersed throughout the epithelium. Figure 3(g) demonstrates the OCT image of ventral zone of the tongue, which shows both a thin epithelium and lamina propria (about 200-300 μm each). OCT shows the border between the intermediate layer and the lamina proria as the hyper-reflective basal layer. A couple of small vessels can also be discerned in the lamina propria, although vessel identification on OCT structural images is challenging. Due to the thin epithelium and lamina propria, the submucosa is also visible in this OCT image. As shown in the histology of the ventral tongue in Fig. 3(h), the submucosa contains muscle bundles. One of these bundles is visible in the OCT image of Fig. 3(g) as a relatively hyper-reflective region surrounded by a hypo-reflective zone.
3.2. Oral imaging of healthy human volunteers
Various regions of the oral tissue of human volunteers were imaged, to demonstrate feasibility of in vivo human imaging with the developed SD-OCT system and the oral imaging probe. The results of the ex vivo pig study were used to help interpret the different structural features observed in human in vivo OCT images.
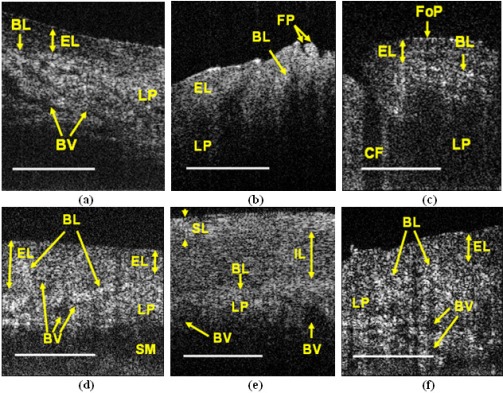
Figure 4(a) shows an OCT image of labial tissue with a hypo-reflective epithelium layer being separated from lamina propria by the hyper-reflective basal layer. The lamina propria consists of high-scattering fibrous tissue and is thus hyper-reflective compared to epithelium. A number of vessels are also distinguishable in the lamina propria. Figure 4(b) shows an OCT image of the dorsal region of the human tongue and specifically the filiform papillae in this region. The epithelium and the lamina propria are distinguishable due to the high contrast between the two layers. In Fig. 4(c), a foliate papilla on the lateral surface of the tongue is shown. The circular furrow between two neighboring papillae is visible in the image. The low penetration depth in the dorsal and lateral surfaces of the tongue can be attributed to the high amount of scattering between the papillae on the surface of these regions, which causes a decrease in the amount of light that actually penetrates the tissue. Figure 4(d) demonstrates the ventral surface of the tongue with changing epithelium thickness along it. As seen, the epithelium is relatively thin on the right side of the image and is thicker on the left side. The lamina propria is characterized by high blood supply and fiber-rich regions. These fibers result in high reflection from dispersed locations along lamina propria. The relatively thin epithelium and lamina propria on the right side of the image enable the visualization of submucosa. In Fig. 4(e), the buccal mucosa is shown. This oral region is characterized by a thick epithelium consisting of superficial (hyper-reflective) and intermediate (hypo-reflective) layers. These are separated from the lamina propria by the basal layer. Two vessels, each ~200 μm in diameter, are tentatively visible in the lamina propria. Figure 4(f) shows the soft palate. The major characteristic of this region is the relatively thin epithelium overlaying a thick lamina propria with a high amount of elastic fiber causing hyper-reflection from this layer. A branching blood vessel can also be distinguished in the lamina propria at the depth of ~600-700 μm.
Fig. 4.
In vivo OCT images of human oral tissue, (a) labial; (b) dorsal surface of the tongue; (c) lateral surface of the tongue; (d) ventral surface of the tongue; (e) buccal; (f) soft palate. SL: superficial layer, IL: intermediate layer, EL: epithelial layer, BL: basal layer, LP: lamina proria, BV: blood vessel, FP: filiform lingual papillae, FoP: foliate lingual papillae, CF: circular furrow, SM: submucosa. Scale bar = 500 μm
Comparing the OCT images of labial and buccal tissue of in vivo human samples (Fig. 4(a) and Fig. 4(e)) with those of ex vivo pig samples (Fig. 3(a) and Fig. 3(c)), there is a strong resemblance between the thicknesses of different layers and their back-scattering properties between the two sets. However, since the anatomy of the dorsal tongue and the type of the papillae change drastically from one region of tongue to another, the dorsal tongue images of the pig (Fig. 3 (e)) and human (Fig. 4 (b)) are not easily comparable. The thickness of tissue layers in human ventral tongue image (Fig. 4(d)) is very similar to that of the pig (Fig. 3(g)) and both show the same decrease in contrast between the epithelium and lamina propria compared to other oral tissue regions.
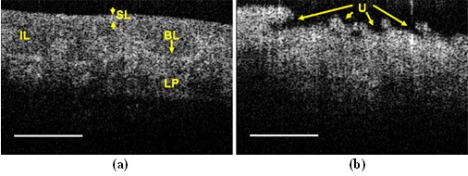
In Fig. 5 , two structural OCT images of the labial mucous membrane of a volunteer are compared, one from a healthy region and one from a pathological oral region (ulcer).
Fig. 5.
In vivo OCT images of human labial tissue in (a) absence and (b) presence of ulcer. SL: superficial layer, IL: intermediate layer, BL: basal layer, LP: lamina proria, U: ulcer. Scale bar = 500 μm
In Fig. 5(a), the healthy epithelium surface is smooth, while in Fig. 5(b), large void regions can be distinguished on the surface due to the presence of ulcer. Moreover, the epithelium and lamina propria are clearly defined and separated by the hyper-reflective basal layer in the image of the healthy labial tissue, whereas such unambiguous layer definition does not exist in the OCT image of the ulcerative region.
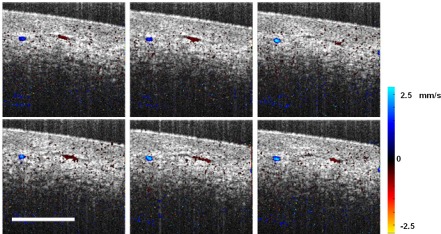
We next examined the feasibility of detecting microvasculature via Doppler OCT in a healthy volunteer’s labial mucosa. The result of this study is presented in Fig. 6 . (Media 1 (4.2MB, MPG) ) Each frame corresponds to a B-scan along a three-dimensional volume of human labial tissue, with superimposed color Doppler images.
Fig. 6.
Consecutive Doppler images and Doppler OCT multimedia of the microvessels in the human labial tissue. The color bar represents the velocity of scatterers in the axial direction. Blue and red hues correspond to two opposite blood flow directions. Microvasculature as small as 16 μm is detectable using the SD-OCT system. Scale bar = 500 μm. Lateral field of view in the multimedia: 1 mm by 1 mm (Media 1 (4.2MB, MPG) )
In the multi-media file of Fig. 6 (Media 1 (4.2MB, MPG) ), the epithelium (including basal layer), and lamina propria are visible. A number of vessels detected by Doppler OCT are clearly distinguishable in these tissue layers. Generally, the concentration of red or blue pixels that are consistent or continuous from frame to frame were thought to represent real blood vessels/ blood flow in that region, while dispersed red and blue spots which change position from frame to frame were taken as noise. Through the frames, the pulsatility of blood flow in the vessels running from left to the right of the image can be observed. The diameter of the vessels that were detected through Doppler OCT varied between ~16 μm and 250 μm. This is consistent with the average value of vessel size in the lamina propria of ~40 μm [28]. The minimum detectable velocity was determined by the phase noise and was 170 μm/s. A limitation of the Doppler approach is that it detects moving scatterers that have a velocity component in the direction of the imaging beam (along the depth direction). Therefore, this technique misses some microvasculature components if the vessel is too small, its flow is too slow to induce a phase shift above the phase noise, or its orientation is perpendicular to the interrogating beam.
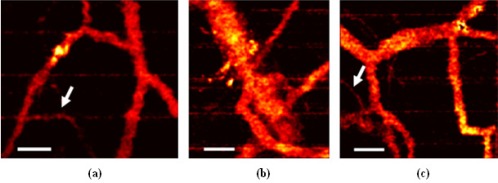
Finally, we turn to svOCT as an in vivo method for producing three-dimensional microvascular maps in both healthy and pathologic regions of the labial tissue. The svOCT-derived microvascular map from the mouth of a human volunteer (labial tissue) is shown in Fig. 7 . We display these intensity projections by collapsing the depth information onto the lateral en face plane. In these images, microvessels as small as ~30 μm are clearly visible. Smaller vessels are blurred out by the median filtering used to reduce image noise. This minimum detectable size was close to the previously reported value (~25 μm) obtained with a SS-OCT system in a mouse window chamber model, with its less challenging tissue motion environment [23]. The horizontal lines in the human oral images in Fig. 7 are in fact caused by motion artifacts; their periodic repetition pattern suggests they originate from cyclical involuntary source of motion (possibly the heartbeat of the human subject).
Fig. 7.
Speckle variance OCT images of the vasculature map in three different regions of the labial tissue of a healthy human volunteer. The images are en face intensity displays formed by projecting three-dimensional tomograms along the depth. The arrows in (a) and (c) show the smallest capillaries detected by the system (~30 μm). Scale bar = 200μm.
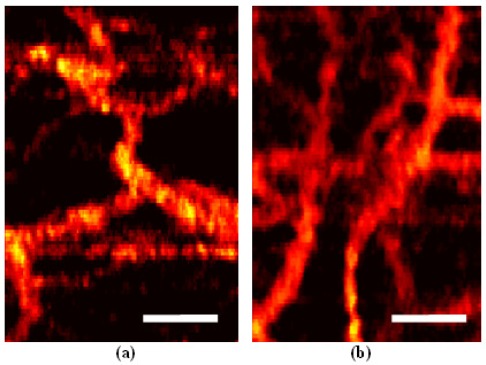
The svOCT technique was also used to identify changes in the microvascular features in a case of oral pathology. A volunteer with a scar tissue in the labial mucosa (5 mm in diameter) was imaged with the svOCT technique and compared to the svOCT image of the corresponding healthy labial tissue in the same subject. Two example images from these two regions are shown in Fig. 8 . The major difference between the healthy (Fig. 8 (a)) and scar (Fig. 8(b)) regions was the increase in the number of microvessels in the scar. This was quantified by calculating the volumetric vessel densities in the two regions. The calculated average volumetric vessel density was 12.3% for the scar and 7.8% for the healthy region, corresponding to ~45% relative difference. It is possible that the higher amount of blood vessel proliferation, as seen by svOCT, is due to the increase in the fibrous tissue / neovascular remodeling in the process of wound healing.
Fig. 8.
Speckle variance OCT images in (a) healthy region of the labial tissue, and (b) scar in the labial tissue of the same volunteer. Note the increase in the number of microvasculature in (b); for quantification, see text. Scale bar = 200μm.
4. Discussion
The majority of the previous OCT oral imaging studies have concentrated on analyzing structural OCT images to detect abnormalities in structure or layer definition. In the current study, a SD-OCT system was built which performed structural OCT imaging of the oral cavity, and microvascular imaging via Doppler and svOCT. The axial resolution of ~5 μm and a penetration depth of ~1.4 mm were demonstrated. This depth range was sufficient to visualize the epithelium (including the basal layer), and part or all of the lamina propria in all oral regions. These two layers are where many oral malignancies originate [29]. Our system with its high axial resolution in vivo can potentially detect smaller structural features in a number of oral diseases compared to many previously reported OCT studies [10,11,13]. The ability to visualize the salivary glands can provide even more information about the pathology of certain diseases, such as xerostomia [29]; however, this necessitates higher penetration depth than we can currently achieve [30]. The penetration depth is limited by the number of pixels in the CCD camera [22] and can be increased by using a 2048 pixel CCD camera instead of our current 1024 pixel one; such an upgrade is planned for the near future. In our structural imaging study, the correspondence between OCT images and histology of ex vivo swine oral tissue confirmed the ability of the system to differentiate the oral subsurface layers and certain features within ~1.4 mm beneath the tissue surface. It also provided a guide for interpreting the structural oral OCT in vivo images of human oral cavity, which corresponded well with the ex vivo pig results as well as with the general histology of human oral tissue [25,26].
As mentioned, many of the previous OCT studies lack important information on blood flow and microvasculature, a significant gap we aim to address in this study. Doppler OCT has been used in selected animal studies of oral pathologies to provide two-dimensional images of single capillaries in suspicious lesions during carcinogenesis [12,19] and chemotherapy-induced mucositis [7]. Nevertheless, there is a further need to provide dynamic images of blood flow in more vessels and capillaries in a suspicious region, especially when monitoring oral diseases that cause major damage to the microvasculature. For example, in pathologies such as haemangiomas, telangiectasia, and Kaposi’s sarcoma [26], which are associated with dilated blood vessels and neovascular abnormalities, three-dimensional Doppler movies could be useful for monitoring the progression of these pathologies and their response to therapies. Specifically, our SD-OCT system provided Doppler OCT images of blood flows as slow as ~170 μm/s and visualized capillaries as small as ~16 μm in diameter in the challenging context of human in vivo imaging in the oral cavity. Moreover, svOCT can complement the Doppler blood flow detection of tissue microvasculature based on its different contrast mechanism, including independence from flow velocities and interrogation angle. Three-dimensional svOCT images (in a two-dimensional en face projection) demonstrated the technique’s ability to visualize vessels as small as ~30 μm in diameter of human labial tissue.
The minimum detected velocity using the current Doppler OCT approach was approximately two times higher than obtained with our previous time-domain clinical system [3]. The sensitivity to slow flows can be enhanced by decreasing the A-scan rate, in order to build up sufficient phase changes due to slower moving red blood cells; however, a slower clinical OCT system may be problematic due to motion artifact susceptibility and increased patient discomfort due to increased imaging time. We are examining this trade-off in the context of our planned clinical studies. For example, vascular pathologies such as telangiectasia that will be monitored as part of a future study, may in fact be already visible within the vessel detection limits demonstrated by the current Doppler and svOCT system capabilities. Further, high speed imaging is particularly important in svOCT which requires multiple B-scans to measure the temporal speckle decorrelation, and bulk tissue motion during data acquisition will cause artifacts (e.g. horizontal lines in Fig. 7). Again, the conflicting requirements of faster imaging and motion artifact rejection, yet with slower A-scan rates for sufficient phase stability and build-up, need to be carefully examined in the context of a particular clinical problem where sensitive detection of the microvasculature is sought.
In the current study, svOCT imaging of a scar in labial mucous membrane was demonstrated and compared to that of a healthy labial tissue of the same volunteer; an increase in the three-dimensional microvessel density in the former compared to the latter was observed. A quantitative method to calculate the three-dimensional fraction of sv-positive signal pixels was developed, to estimate the three-dimensional blood vessel density for both cases. However, as some of the acquired svOCT images suffered from motion artifacts (manifest as horizontal high intensity lines in the svOCT image, corresponding to dislocated B-scans), these artifactual B-scans were omitted from vessel density calculation. Note that this is only a feasibility study and an initial attempt at vascular quantification; therefore, validation of this approach, and exploration of other methods for microvascular differentiation of healthy and pathologic tissue are currently under active investigation.
Most of the oral OCT studies have so far focused on disease detection and assessment; however, microstructural and microvascular OCT techniques can also be used for treatment monitoring and evaluating the effectiveness of various therapies. Currently, evaluating patient’s response to treatments of oral diseases is performed through subjective methods such as visual examination of the oral tissue surface or symptoms reported by the patient. Subsurface examinations of tissue with microstructural and microvascular OCT, the latter with its complimentary Doppler and speckle variance modes, can potentially be used as a rapid noninvasive objective tool for treatment response monitoring and optimization of treatment delivery in patients with oral pathologies.
5. Conclusion
An SD-OCT system and an oral imaging probe have been developed, enabling the visualization of various oral tissue features and layers, such as the epithelium (including basal layer), lamina propria and blood vessels in ex vivo swine and in vivo human imaging scenarios. The ability to image an ulcer, as a prototypical oral pathology and the feasibility of applying Doppler technique for visualizing the microvasculature in human labial mucous membrane with diameters as small as ~16 μm were presented. Moreover, svOCT was used for in vivo imaging of healthy and pathologic oral sites for the first time, highlighted an increase in the vasculature in scar tissue. Based on the acquired structural, Doppler, and svOCT images, the developed SD-OCT system potentially provides a noninvasive and quantifiable subsurface imaging tool to monitor oral diseases and their complications, which cause alterations in the structure and layer definition of oral tissue (such as inflammation and mucosal atrophy) as well as changes in the blood dynamics and vasculature (such as telangiectasia). Such an objective structural and functional tissue assessment tool can also be used as a rapid noninvasive method to monitor specific oral pathologies and gauge the response of these pathologies to various treatments, with potential for therapeutic feedback and optimization.
Acknowledgment
The authors would like to thank Natural Sciences and Engineering Research Council of Canada (NSERC) / Canadian Institutes for Health Research (CIHR) through the Collaborative Health Research Program (CHRP) for funding this research.
References and links
- 1.W. Drexler and J. G. Fujimoto, Optical Coherence Tomography: Technology and Applications (Springer, 2008). [Google Scholar]
- 2.Bizheva K., Hutchings N., Sorbara L., Moayed A. A., Simpson T., “In vivo volumetric imaging of the human corneo-scleral limbus with spectral domain OCT,” Biomed. Opt. Express 2(7), 1794–02 (2011). 10.1364/BOE.2.001794 [DOI] [PMC free article] [PubMed] [Google Scholar]
- 3.Yang V. X. D., Tang S.-j., Gordon M. L., Qi B., Gardiner G., Cirocco M., Kortan P., Haber G. B., Kandel G., Vitkin I. A., Wilson B. C., Marcon N. E., “Endoscopic Doppler optical coherence tomography in the human GI tract: initial experience,” Gastrointest. Endosc. 61(7), 879–890 (2005). 10.1016/S0016-5107(05)00323-8 [DOI] [PubMed] [Google Scholar]
- 4.Atif M., Ullah H., Hamza M. Y., Ikram M., “Catheters for optical coherence tomography,” Laser Phys. Lett. 8, 629–646 (2011). [Google Scholar]
- 5.Yoo H., Kim J. W., Shishkov M., Namati E., Morse T., Shubochkin R., McCarthy J. R., Ntziachristos V., Bouma B. E., Jaffer F. A., Tearney G. J., “Intra-arterial catheter for simultaneous microstructural and molecular imaging in vivo,” Nat. Med. 17(12), 1680–1684 (2011). 10.1038/nm.2555 [DOI] [PMC free article] [PubMed] [Google Scholar]
- 6.Lee C.-K., Tsai M.-T., Lee H.-C., Chen H.-M., Chiang C.-P., Wang Y.-M., Yang C. C., “Diagnosis of oral submucous fibrosis with optical coherence tomography,” J. Biomed. Opt. 14(5), 054008 (2009). 10.1117/1.3233653 [DOI] [PubMed] [Google Scholar]
- 7.Wilder-Smith P., Hammer-Wilson M. J., Zhang J., Wang Q., Osann K., Chen Z., Wigdor H., Schwartz J., Epstein J., “In vivo imaging of oral mucositis in an animal model using optical coherence tomography and optical Doppler tomography,” Clin. Cancer Res. 13(8), 2449–2454 (2007). 10.1158/1078-0432.CCR-06-2234 [DOI] [PubMed] [Google Scholar]
- 8.Gladkova N., Maslennikova A., Balalaeva I., Feldchtein F., Kiseleva E., Karabut M., Iksanov R., “Application of optical coherence tomography in the diagnosis of mucositis in patients with head and neck cancer during a course of radio(chemo)therapy,” Med. Laser Appl. 23(4), 186–195 (2008). 10.1016/j.mla.2008.07.008 [DOI] [Google Scholar]
- 9.Muanza T. M., Cotrim A. P., McAuliffe M., Sowers A. L., Baum B. J., Cook J. A., Feldchtein F., Amazeen P., Coleman C. N., Mitchell J. B., “Evaluation of radiation-induced oral mucositis by optical coherence tomography,” Clin. Cancer Res. 11(14), 5121–5127 (2005). 10.1158/1078-0432.CCR-05-0403 [DOI] [PubMed] [Google Scholar]
- 10.Wilder-Smith P., Jung W. G., Brenner M., Osann K., Beydoun H., Messadi D., Chen Z., “In vivo optical coherence tomography for the diagnosis of oral malignancy,” Lasers Surg. Med. 35(4), 269–275 (2004). 10.1002/lsm.20098 [DOI] [PubMed] [Google Scholar]
- 11.Ridgway J. M., Armstrong W. B., Guo S., Mahmood U., Su J., Jackson R. P., Shibuya T., Crumley R. L., Gu M., Chen Z., Wong B. J., “In vivo optical coherence tomography of the human oral cavity and oropharynx,” Arch. Otolaryngol. Head Neck Surg. 132(10), 1074–1081 (2006). 10.1001/archotol.132.10.1074 [DOI] [PubMed] [Google Scholar]
- 12.Matheny E. S., Hanna N. M., Jung W. G., Chen Z., Wilder-Smith P., Mina-Araghi R., Brenner M., “Optical coherence tomography of malignancy in hamster cheek pouches,” J. Biomed. Opt. 9(5), 978–981 (2004). 10.1117/1.1783897 [DOI] [PubMed] [Google Scholar]
- 13.Jerjes W., Upile T., Conn B., Hamdoon Z., Betz C. S., McKenzie G., Radhi H., Vourvachis M., El Maaytah M., Sandison A., Jay A., Hopper C., “In vitro examination of suspicious oral lesions using optical coherence tomography,” Br. J. Oral Maxillofac. Surg. 48(1), 18–25 (2010). 10.1016/j.bjoms.2009.04.019 [DOI] [PubMed] [Google Scholar]
- 14.Tsai M. T., Lee H.-C., Lee C.-K., Yu C. H., Chen H. M., Chiang C.-P., Chang C.-C., Wang Y.-M., Yang C. C., “Effective indicators for diagnosis of oral cancer using optical coherence tomography,” Opt. Express 16(20), 15847–15862 (2008). 10.1364/OE.16.015847 [DOI] [PubMed] [Google Scholar]
- 15.Tsai M.-T., Lee C.-K., Lee H.-C., Chen H.-M., Chiang C.-P., Wang Y.-M., Yang C.-C., “Differentiating oral lesions in different carcinogenesis stages with optical coherence tomography,” J. Biomed. Opt. 14(4), 044028 (2009). 10.1117/1.3200936 [DOI] [PubMed] [Google Scholar]
- 16.Ozawa N., Sumi Y., Chong C., Kurabayashi T., “Evaluation of oral vascular anomalies using optical coherence tomography,” Br. J. Oral Maxillofac. Surg. 47(8), 622–626 (2009). 10.1016/j.bjoms.2009.03.012 [DOI] [PubMed] [Google Scholar]
- 17.Yang V., Gordon M., Qi B., Pekar J., Lo S., Seng-Yue E., Mok A., Wilson B., Vitkin I., “High speed, wide velocity dynamic range Doppler optical coherence tomography (Part I): System design, signal processing, and performance,” Opt. Express 11(7), 794–809 (2003). 10.1364/OE.11.000794 [DOI] [PubMed] [Google Scholar]
- 18.Mariampillai A., Leung M. K. K., Jarvi M., Standish B. A., Lee K., Wilson B. C., Vitkin A., Yang V. X. D., “Optimized speckle variance OCT imaging of microvasculature,” Opt. Lett. 35(8), 1257–1259 (2010). 10.1364/OL.35.001257 [DOI] [PubMed] [Google Scholar]
- 19.Hanna N. M., Waite W., Taylor K., Jung W.-G., Mukai D., Matheny E., Kreuter K., Wilder-Smith P., Brenner M., Chen Z., “Feasibility of three-dimensional optical coherence tomography and optical Doppler tomography of malignancy in hamster cheek pouches,” Photomed. Laser Surg. 24(3), 402–409 (2006). 10.1089/pho.2006.24.402 [DOI] [PubMed] [Google Scholar]
- 20.Sudheendran N., Syed S. H., Dickinson M. E., Larina I. V., Larin K. V., “Speckle variance OCT imaging of the vasculature in live mammalian embryos,” Laser Phys. Lett. 8(3), 247–252 (2011). 10.1002/lapl.201010120 [DOI] [Google Scholar]
- 21.Wong J. W., Gallant-Behm C., Wiebe C., Mak K., Hart D. A., Larjava H., Häkkinen L., “Wound healing in oral mucosa results in reduced scar formation as compared with skin: evidence from the red Duroc pig model and humans,” Wound Repair Regen. 17(5), 717–729 (2009). 10.1111/j.1524-475X.2009.00531.x [DOI] [PubMed] [Google Scholar]
- 22.Wojtkowski M., Srinivasan V., Ko T., Fujimoto J., Kowalczyk A., Duker J., “Ultrahigh-resolution, high-speed, Fourier domain optical coherence tomography and methods for dispersion compensation,” Opt. Express 12(11), 2404–2422 (2004). 10.1364/OPEX.12.002404 [DOI] [PubMed] [Google Scholar]
- 23.Mariampillai A., Standish B. A., Moriyama E. H., Khurana M., Munce N. R., Leung M. K. K., Jiang J., Cable A., Wilson B. C., Vitkin I. A., Yang V. X. D., “Speckle variance detection of microvasculature using swept-source optical coherence tomography,” Opt. Lett. 33(13), 1530–1532 (2008). 10.1364/OL.33.001530 [DOI] [PubMed] [Google Scholar]
- 24.Hsiung P.-L., Nambiar P. R., Fujimoto J. G., “Effect of tissue preservation on imaging using ultrahigh resolution optical coherence tomography,” J. Biomed. Opt. 10(6), 064033 (2005). 10.1117/1.2147155 [DOI] [PubMed] [Google Scholar]
- 25.M. Bath-Balogh and M. J. Fehrenbach, Illustrated Dental Embryology, Histology, and Anatomy (Elsevier Saunders, 2011). [Google Scholar]
- 26.J. W. Eveson and C. Scully, Color Atlas of Oral Pathology (Mosby-Wolfe, 1995). [Google Scholar]
- 27.Standish B. A., Jin X., Smolen J., Mariampillai A., Munce N. R., Wilson B. C., Vitkin I. A., Yang V. X. D., “Interstitial Doppler optical coherence tomography monitors microvascular changes during photodynamic therapy in a Dunning prostate model under varying treatment conditions,” J. Biomed. Opt. 12(3), 034022 (2007). 10.1117/1.2744068 [DOI] [PubMed] [Google Scholar]
- 28.Spence R. A. J., “The venous anatomy of the lower oesophagus in normal subjects and in patients with varices: an image analysis study,” Br. J. Surg. 71(10), 739–744 (1984). 10.1002/bjs.1800711002 [DOI] [PubMed] [Google Scholar]
- 29.Sciubba J. J., Goldenberg D., “Oral complications of radiotherapy,” Lancet Oncol. 7(2), 175–183 (2006). 10.1016/S1470-2045(06)70580-0 [DOI] [PubMed] [Google Scholar]
- 30.Ozawa N., Sumi Y., Shimozato K., Chong C., Kurabayashi T., “In vivo imaging of human labial glands using advanced optical coherence tomography,” Oral Surg. Oral Med. Oral Pathol. Oral Radiol. Endod. 108(3), 425–429 (2009). 10.1016/j.tripleo.2009.05.035 [DOI] [PubMed] [Google Scholar]


