Abstract
Several major lung pathologies are characterized by early modifications of the extracellular matrix (ECM) fibrillar collagen and elastin network. We report here the development of a nonlinear fiber-optic spectrometer, compatible with an endoscopic use, primarily intended for the recording of second-harmonic generation (SHG) signal of collagen and two-photon excited fluorescence (2PEF) of both collagen and elastin. Fiber dispersion is accurately compensated by the use of a specific grism-pair stretcher, allowing laser pulse temporal width around 70 fs and excitation wavelength tunability from 790 to 900 nm. This spectrometer was used to investigate the excitation wavelength dependence (from 800 to 870 nm) of SHG and 2PEF spectra originating from ex vivo human lung tissue samples. The results were compared with spectral responses of collagen gel and elastin powder reference samples and also with data obtained using standard nonlinear microspectroscopy. The excitation-wavelength-tunable nonlinear fiber-optic spectrometer presented in this study allows performing nonlinear spectroscopy of human lung tissue ECM through the elastin 2PEF and the collagen SHG signals. This work opens the way to tunable excitation nonlinear endomicroscopy based on both distal scanning of a single optical fiber and proximal scanning of a fiber-optic bundle.
OCIS codes: (300.6420) Spectroscopy, nonlinear; (170.6280) Spectroscopy, fluorescence and luminescence; (170.2150) Endoscopic imaging; (170.3890) Medical optics instrumentation; (170.6510) Spectroscopy, tissue diagnostics; (190.4180) Multiphoton processes
1. Introduction
Nonlinear optical microscopy is a powerful method which is now widely used for in vitro tissue imaging. It is of particular value for imaging extracellular matrix (ECM) architecture since the combination of second-harmonic generation (SHG) and two photon excited fluorescence (2PEF) allows the simultaneous visualization of collagen (SHG) and elastin (2PEF), the main ECM proteins [1–4]. Moreover, another asset of nonlinear optics is the use of near-infrared laser light which propagates deeper in the tissue thanks to lower absorption and scattering [5]. Studies have been reported in a variety of ex vivo and in vitro tissues (animal models [6] and human tissue samples [7–9]); multiphoton microendoscopy was also used in vivo for dermatologic applications [4].
It is now well established that major lung pathologies such as chronic bronchial inflammations, chronic obstructive pulmonary disease, fibrosis, asthma, emphysema and cancer, are associated with an alteration of the ECM fibered network. For example, early cancerous lesions are characterized by a disorganization and degradation of both collagen and elastin network, while fibrosis induces an ECM accumulation. A number of investigations on fresh mouse [10] and human [11–14] lung samples demonstrated that nonlinear microscopy, combining SHG and 2PEF, is effective in imaging the elastin and collagen network microstructure and can be used to assess the pathological changes occurring in ECM organization. These studies showed the potential of this technique for early detection of lung diseases affecting the ECM. Therefore, it would be of great clinical value to follow structural remodeling of the ECM in vivo during an endoscopic procedure.
To date, fiber-optic confocal autofluorescence microscopy allows in vivo endomicroscopic imaging of the human respiratory tract in real time during bronchoscopy. In previous studies [15,16], the authors used a dual fiber-optic confocal imaging and spectroscopic instrument, under 488 nm one-photon excitation mode, to study in vivo the autofluorescence microstructure of the bronchial tree, from proximal bronchi down to the alveoli. In addition to imaging the integrated fluorescence emission, the knowledge of the complete emission spectrum from a localized region brings additional capabilities. In particular, when studying tissue autofluorescence, spectral information is relevant for identifying tissue fluorophores contributing to the global emission and unmixing their overlapping signals. It was shown that the technique images the elastin network of the proximal and distal bronchial tree but does not give access to the collagen component of the ECM.
In order to simultaneously visualize collagen (SHG) and elastin (2PEF) during bronchoscopy, our final objective is to develop a nonlinear fiber-optic endomicroscope combining (SHG) and (2PEF). Our current linear endomicroscope is based on the use of a multicore image guide composed of thousands of optical fibers [17,18]. Nonlinear endomicroscopy requires the delivery of high incident peak power at the distal end of each fiber in contact with tissue. The needed peak power is easily provided by femtosecond pulsed lasers which are commonly used in nonlinear microscopes. Unfortunately, guided propagation of such intense ultrashort pulses suffers from temporal distortions due to group-velocity dispersion and Kerr-type self-phase modulations. To address this issue, a specific dispersion compensation line was developed allowing compensation of the second and third orders of dispersion as well as management of self-phase modulation in the fiber [19].
Various arrangements for fiber delivery of femtosecond laser pulses were applied to multiphoton endomicroscopy. In ref [20]. a first dispersion shifted hollow core photonic bandgap fiber induces a negative chirp upon the laser pulses prior they enter the delivery fiber having positive dispersion. This compact scheme allows for second order of dispersion (SOD) compensation in the optical fiber with reduced losses. However, because of the narrow guiding bandwidth of hollow core fiber, such a device is not tunable in wavelength. Moreover, the output pulse duration is dependent on the input laser power due to uncompensated nonlinear effects that result in spectral narrowing in the delivery fiber [21]. Dispersion compensation can also be performed more conventionally with a grating-pair stretcher [22–24] which is a tunable device. However, in this configuration, higher orders of dispersion remain uncompensated and, moreover, nonlinear distortions are still not addressed. As a consequence output pulses are much longer than the input ones so that the nonlinear excitation of the biological sample is largely suboptimal.
In this work we started from the efficient scheme initially proposed by S.W. Clark and associates [25] involving linear and nonlinear pre-compensations. First, the pulse coming from a femtosecond oscillator is temporally broadened in a first single mode fiber (SMF) under positive group velocity dispersion. In this first fiber the signal is also spectrally broadened because of positive self-phase modulation (SPM). This spectral broadening pre-compensates for the spectral compression that will occur in the last few millimeters of the delivery fiber. After the first fiber the pulse is sent to an anomalous stretcher in which it is largely negatively temporally chirped. During its final propagation inside the delivery fiber exhibiting positive dispersion and positive nonlinearity, the signal can be optimally temporally and spectrally compressed. This is obtained when the anomalous stretcher is adjusted in order to compensate almost for the net SOD of the two fiber pieces. We have recently demonstrated [19] that significantly shorter and brighter pulses could be delivered with an improved stretcher compensating for SOD but also simultaneously for third order of dispersion (TOD). With this optimization scheme the delivered pulse spectral bandwidth and duration are close to the initial ones. Moreover, we demonstrated that it can lead to pulse compression. Note that dispersion compensation up to the third order can be efficiently performed [26] using a conventional stretcher (i.e. prism-pair stretcher [27] or grating-pair stretcher [28]) combined with several TOD optimized chirped-mirror-pairs. However, this solution resulted in a rather complex and cumbersome setup involving unconventional and expensive elements. Additionally this solution did not provide any carrier wavelength tunability which is detrimental for the present spectroscopic study. Therefore in the present study, we work with a home-built optimized stretcher made of two grisms consisting of a reflection diffraction grating in close contact with a prism [29–31]. Changing the distance between the two grisms, and the incidence angle onto them permits independent adjustment of SOD and TOD to the desired values. It is shown below that the present device, being composed of conventional commercial components, is tunable over a spectral range greater than 100 nm.
The aim of the work reported here is to develop a nonlinear fiber-optic spectrometer, operating in the femtosecond range, with a tunable excitation wavelength ranging from 790 to 900 nm, compatible with endoscopy, intended primarily for the exploration of the bronchial tree. The objectives are threefold: (i) to validate the tunability of the compensation line, from 790 to 900 nm while remaining in the femtosecond range (ii) to perform a nonlinear spectroscopic study on ex vivo human lung samples in order to assess the capability of the fiber-optic spectrometer to record backward SHG and 2PEF signals via a single monomode optical fiber in an endoscopic-like configuration (iii) to determine, in this configuration, the optimum excitation wavelength allowing to discriminate collagen from elastin.
2. Materials and methods
2.1. Preparation of human lung samples
Human lung samples used in this investigation, prepared by Rouen University Hospital, were obtained from one patient undergoing surgery for lung cancer. Spectroscopy measurements were performed on two healthy samples, one proximal bronchus sample and one peripheral alveolar territory sample. The two specimens were removed from a lobectomy sample, in a healthy zone, remote from the cancer, and fixed in 4% paraformaldehyde. After fixation, samples were cut into approximately 1 mm thick tissue slices. The bronchus sample was opened longitudinally and flattened in order to perform spectral measurements on the inner bronchiolar wall. Each tissue block was placed on a microscope slide.
2.2. Reference samples
Collagen fibrillar gels (5mg/ml) (kindly provided by Gervaise Mosser, “Chimie de la Matière Condensée” laboratory, UPMC) were prepared from Type I collagen extracted from rat tail tendon and purified as described in [32]. Elastin powder from human lung prepared by non degradative extraction (E7152, 2 mg, purity > 99%, Sigma-Aldrich), was used as the elastin reference sample. The elastin powder was hydrated with a single drop of water and placed between a microscope slide and cover-slip.
2.3. Experimental setups
Two experimental setups were built, the first one to perform fiber-optic spectroscopy and the second one to perform microspectroscopy.
2.3.1. Novel fiber-optic spectrometer
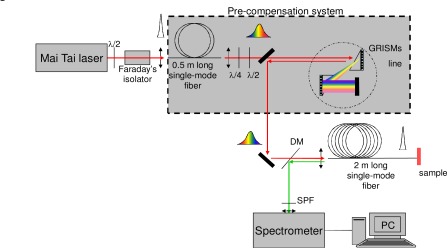
Figure 1 presents the fiber-optic spectroscopic setup which is composed of four main modules: the excitation light source, the specific compensation device, the optical fiber probe coupled to the sample and the spectrometer. A tunable (690 - 1060 nm) Ti:Sapphire pulsed laser (80 MHz repetition rate, 70 fs pulse width; Mai Tai / DeepSee, SpectraPhysics) is used as the excitation light source. A Faraday’s isolator (Newport) is placed at the laser output to attenuate back reflection of the pulse into the laser cavity due to fiber coupling. The commercial pre-compensation system included in the laser (DeepSee) is tuned to compensate the Faraday’s isolator dispersion in order to ensure 70 fs pulse width before entering the pre-compensation system. The tissue sample is directly in contact with the distal end of a 2 m long, single-mode fiber (SMF) of 5 µm core diameter (NA = 0.13) providing an illumination area of about 20 µm2. The fiber length is chosen to be compatible with an endoscopic use, so that the probe can be inserted in the working channel of a bronchoscope and its tip applied onto the bronchial surface of the patient mucosa.
Fig. 1.
Experimental setup for fiber-optic spectroscopic measurements. (DM stands for dichroic mirror and SPF stands for shortwave pass filter.)
In this endoscopic 2 m long SMF of high normal dispersion and small core diameter (5 µm diameter, NA = 0.13), the laser pulse inevitably suffers from strong dispersion and strong nonlinearity. To compensate for these deleterious effects, the above mentioned optimized pre-compensation device is inserted between the laser and the delivery fiber. Briefly, this pre-compensation module consists of a first 0.5 m long SMF followed by a home-built antisymmetric grism-pair stretcher. The polarization of the beam exiting the optical fiber is randomly elliptical; thus one half-wave plate and one quarter-wave plate are used to obtain a s-polarized beam in order to reach the maximum diffraction efficiency of the gratings. Inside the two grisms, the reflective diffraction grating has 600 grooves / mm while the BK7 prism apex is 40°. The stretcher has a 36% energetic throughput. In the first fiber, the pulse is temporally and spectrally broadened to several picoseconds and several tens of nanometers respectively. Then the pulse double-passes the anomalous stretcher thanks to a high reflective folding mirror located after the grism-pair. This anomalous stretcher can accurately compensate simultaneously for second and third orders of dispersion of the two fibers (corresponding to a net length equal to 2.5 m) provided that the distance between the two grisms and the incidence angle onto the stretcher are set to be pre-determined optimal values. After the stretcher, the pulse is coupled into the 2 meter long delivery fiber. The duration of output compressed pulse duration at the sample position is measured with an interferometric autocorrelator (PulseCheck, APE); the reported values are those determined using sech2 temporal profile.
2PEF and SHG signals originating from the sample are back scattered and partly coupled through the distal end of the probe fiber, guided back to the proximal end and reflected by a dichroic mirror (DM) (R(350 - 650 nm) > 98%, T(680 - 1100 nm) > 90%) into the entrance slit of a spectrometer (CP200, Jobin-Yvon) equipped with a liquid-nitrogen-cooled CCD array 1024 × 256. The slit width of 100 µm ensures spectral resolution better than 4 nm from 350 to 800 nm. Spectra are corrected from the instrument spectral response. A shortwave-pass filter (SPF) BG39 (T(370 - 560 nm) > 85%, T(λ > 730 nm) < 0.1%, Schott) is placed before the slit in order to eliminate the possible remaining laser excitation light.
2.3.2. Standard microspectrometer
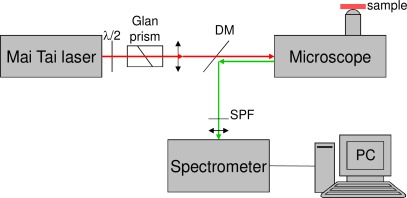
The block diagram of the microspectroscopic setup is shown in Fig. 2 . The excitation light source and the spectrometer are those used for fiber-optic spectroscopy. The laser power is controlled by a combination of a half-wave plate and a Glan prism. The laser beam is injected into a modified inverted microscope (Axiovert 35, Zeiss) via a camera designed output. The imaging lens is removed from this microscope output allowing to keep the beam collimation upon entering the microscope objective. The objective is an Olympus IC 50 (MSPlan, 50 × , NA = 0.8), and the focal spot area on the sample varies from ~0.6 to ~0.8 µm2 for wavelengths varying from 750 to 900 nm respectively. Dispersion due to microscope optical components is pre-compensated by the commercial system included in the laser (DeepSee, Spectra Physics). The 2PEF and SHG signals generated from the sample are detected in the backward direction; they propagate back along the incident optical path and are finally reoriented to the spectrometer by a dichroic mirror (DM).
Fig. 2.
Experimental setup for microspectroscopic measurements. (DM stands for dichroic mirror and SPF stands for shortwave pass filter.)
2.4. Spectra acquisition and spectral data processing
In order to maximize the signal to noise ratio, the spectra acquisition time was set to 10 s for tissue samples and to 5 s for reference samples. Three spectra are acquired and averaged for each tissue site, and five different positions are observed for each sample. The excitation wavelength covered the range 800 to 870 nm for the fiber-optic spectroscopic configuration (namely 800, 825, 850 and 870 nm) and 750 to 870 nm (namely 750, 770, 800, 825, 850 and 870 nm) for the micro-spectroscopic configuration.
The laser power density was fixed to ~1.4 × 10¹⁰ W.cm−2 (corresponding to an average power <P> ~15 mW and a pulse energy Epulse ~0.19 nJ) for the measurements performed with the fiber-optic system. To reach such peak power density, the incident laser beam has an initial average power of about 500 mW depending on the chosen wavelength and of the efficiency of the whole system. Some surface damage could be noticed at the proximal end of the first optical fiber but this damage does not affect the system capabilities. We noticed that the optical fiber has to be changed after about 500 hours of use since, after this duration, the coupling efficiency decreases fastly. For laser power higher than 500 mW, the spectral broadening was so large that the external wavelengths were filtered by the grisms line and the output power remained unchanged. In the case of the microspectroscopic measurements, the laser power density was set to ~1.8 × 10¹¹ W.cm−2 (<P> ~7 mW and Epulse ~0.09 nJ).
This power density variation between the two configurations was essentially justified by different losses in the two setups. The spatial distribution of the power density was quite different in the two configurations: in the microscopic setup, the objective focused the laser beam on a small spot (0.6 to 0.8 µm2) while in the fiber-optic configuration the distal end of the fiber was devoided of focusing optics providing an excitation area of ~20 µm2. This difference prevented from having the same power density together with similar values of pulse energy at the sample position for both setups. For this reason the excitation pulse parameters were adjusted to provide the best spectral signal to noise ratio while remaining under the tissue optical breakdown threshold.
In the fiber-optic spectroscopic configuration, spectra were averaged from 5 different positions for each excitation wavelength; the microspectroscopic spectra were measured at the same tissue position for all the excitation wavelengths. The optical power density necessary to induce a nonlinear effect is easily fulfilled on the surface of the sample; however, considering that the distal end of the fiber is devoided of optics and that its numerical aperture (NA) is equal to 0.13, the optical power density decreases very rapidly after entering the sample. Consequently, due to the excitation power quadratic dependence of the nonlinear effect, depth from which 2PEF and SHG light is collected does not exceed a few tens micrometers.
In this system, the fiber itself (780HP, Thorlabs) may generate an important optical background due to nonlinear interactions of the pulse with the fiber material (through 2PEF and even through SHG). Baseline spectra of the fiber-optic spectroscopic system (Fig. 3 ) showed a low fluorescence for an excitation wavelength above 800 nm, but for shorter wavelength this fluorescence signal might be important. A SHG signal might be observed (Fig. 3(b)), which was suspected to be generated by the fiber surface and in the backward direction [33]. This SHG signal remained very weak and should not affect our measurements.
Fig. 3.
(a) Background fluorescence spectra generated from the fiber in fiber-optic spectroscopic setup as a function of excitation wavelength; (b) closer view of the specrtal range containing a SHG signal; (c) background fluorescence signal at 850 nm excitation wavelength (green) and a typical bronchus emission spectrum without background substraction (black) and with background substraction (red). 770 nm excited fiber fluorescence signal prohibites the use of this wavelength. 850 nm excited SHG signal fiber emission is negligeable compared to a typical tissular emission spectrum.
The fiber background spectrum was routinely subtracted from all raw measured spectra. Due to the quadratic dependence of the 2PEF and SHG intensities on the excitation power, all spectra were normalized with respect to the square power density.
For spectral shape comparison, each spectrum was normalized with respect to its own 2PEF maximum; for intensity comparison, each spectrum was normalized with respect to the 2PEF maximum of the spectrum exhibiting the highest 2PEF intensity.
2.5. Distal scanning fiber imaging system
A galvanometric scanning system (GVS002, Thorlabs) is placed at the distal extremity of the 2 m long optical fiber and focused in the tissue thanks to a water immersion microscope objective (NA = 1) (W plan-apochromat 63x/1,0 Ph3, Zeiss); at the proximal extremity the dichroic mirror reflects the collected emission signal to a photomultiplier tube (PMT) (H7422-40, Hamamatsu). The SHG signal was discriminated thanks to a 400 nm centered band-pass filter (400WB40, Thorlabs), and the 2PEF signal was discriminated thanks to a set of one short-pass (XVS690, Asahi Spectra) and one long-pass (FGL435, Thorlabs) filters to form an appropriate band-pass filter (435 - 690 nm). The excitation wavelength is set to 800 nm (i.e. a focal spot of 0.98 µm2), the temporal pulse width at ~70 fs and the exposition power is set to 20 mW (i.e. power density of 3.6 × 10¹¹ W.cm−2).
The resulting image size is 615 × 615 pixels (i.e. 250 × 250 µm), with an optical resolution close to 1 µm. The integration time is set to 1 s per image, i.e. 2.6 µs per pixel. The instrumentation and the acquisition data are controlled by a specifically designed software using Labview (National Instruments). The images are reconstructed using ImageJ software (National Institute of Health).
3. Results and discussion
3.1. Fiber-optic spectroscopy set-up wavelength tunability
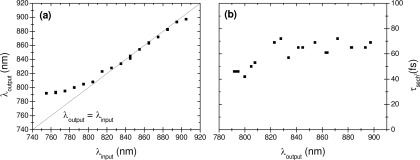
Prior to performing the spectral study on lung samples, the tunability of the fiber-optic spectroscopic system had to be demonstrated. While the pre-compensation system includes gratings, it is sensitive to the central wavelength of the incident femtosecond laser light in such a way that, for any wavelength change, the incidence angle on the first grism has to be adjusted. This procedure is prone to wavelength limitation due to geometrical constraints. For example, for extreme carrier wavelengths, the beam diffracted from the first grism may be cut partially in the second grism so that part of the spectrum is lost. Within these limits our system is tunable, i.e. the output central wavelength is the same as the input one, from almost 800 to 900 nm (Fig. 4(a) ). Below 800 nm, the output carrier wavelength notably differs from the initial one because of combined effects of geometrical constraints and nonlinear spectral effects, the shortest achievable output wavelength being 790 nm in the present set-up.
Fig. 4.
(a) Relationship between output and input carrier wavelengths through the grisms line based precompensation system, (b) laser pulses duration at the distal end of the probe fiber as a function of the output laser wavelength using sech2 approximation.
The laser system emits initial pulses with duration of ~70 fs for any excitation wavelength. As seen in Fig. 4(b), the grisms line used in our set-up allows to obtain output pulses at the distal end of the optical fiber with duration 40 - 75 fs in the spectral range 790 - 900 nm.
3.2. Microspectroscopy of reference samples
Emission spectra of collagen gel and elastin powder samples were measured at a fixed position in the sample, the excitation wavelength being tuned from 750 to 870 nm.
3.2.1. Influence of photodegradation
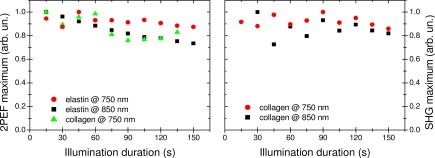
In order to assess the potential influence of photodegradation on our measurements, a study of the dependence of SHG and 2PEF signals on the illumination duration was performed for collagen and elastin samples. Samples were illuminated for 150 s duration test under an irradiance of 1.8 × 10¹¹ W.cm−2, corresponding to the highest laser power density used in our experiments (i.e. an average power of ~7 mW). During this long duration test, a slow decrease of the 2PEF emission from collagen and elastin samples was observed (Fig. 5 ) under 750 nm and 850 nm excitations. Compared to the relatively short illumination times that were used during the rest of the study (i.e. 3 sequences of 10 s long acquisition), the results depicted in Fig. 5 prove that the impact of photodegradation on our measurements is negligible. No significant decrease of collagen SHG signal intensity was observed during the 150 s exposure for both excitation wavelengths.
Fig. 5.
Averaged 2PEF (left) and SHG signals (right) at ~1.8 × 10¹¹ W.cm−2 as a function of illumination duration. Each point is the average of 3 measurements. No 2PEF emission was observed for collagen sample at 850 nm excitation.
3.2.2. Spectral dependence of collagen and elastin spectral responses
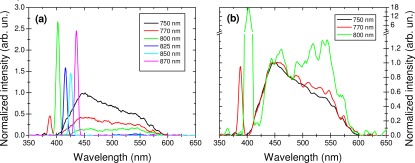
All spectra coming from the collagen gel sample (Fig. 6 ) showed a SHG signal which became important for excitation wavelengths of 800 nm and higher. The SHG signal was extremely weak under 750 nm and 770 nm excitations and a small decrease of SHG intensity was observed at 825 and 850 nm.
Fig. 6.
Typical emission spectra of collagen gel sample at various excitation wavelengths obtained in microspectroscopy. (a) Spectra are normalized to the maximum 2PEF emission of the most intense spectrum (here at 750 nm excitation wavelength), (b) spectra are normalized with respect to 450 nm.
The 2PEF emission spectrum exhibited a maximum at 450 nm and a shoulder around 525 nm for 750 nm excitation. With increasing excitation wavelength, the 450 nm peak intensity decreased faster than the 525 nm shoulder, so that their intensities became nearly equivalent at 800 nm excitation wavelength; the 2PEF emission completely vanished for longer wavelengths. This behavior indicates the existence of two collagen absorption bands, consistent with the major 370 - 390 nm band and weaker 410 - 470 nm one reported by Sokolov et al. [34] in a study of the spectral dependence of collagen gel fluorescence using one-photon excitation in the region 310 - 470 nm. The disappearance of the 2PEF emission for excitation wavelengths longer than 800 nm is in good agreement with the literature data [1].
The SHG resonance enhancement – usually occurring when the SHG wavelength is close to the absorption band – was not observed here. Conversely, very low SHG intensities at 750 nm and 770 nm excitations corresponded to the collagen strongest resonance band. This behavior can be explained as follows: in our epidetection configuration, backscattered SHG photons emitted in the resonance band suffer from strong absorption in the bulk of the collagen sample, resulting in a decrease of the SHG signal associated with a high fluorescence intensity.
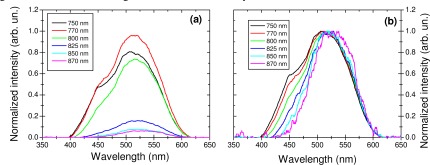
Elastin spectra (Fig. 7 ) exhibited a 2PEF emission, for all excitation wavelengths, with maxima between 510 and 525 nm. A shoulder was observed around 450 nm at 770 nm excitation; it decreased for longer excitation wavelengths, finally vanishing above 825 nm excitation. From 800 nm excitation wavelength, global fluorescence intensity continuously decreased with excitation wavelength, the emission peak intensity shifting continuously from 510 to 525 nm. As expected, no SHG signal was observed [1,2].
Fig. 7.
Typical emission spectra of elastin powder samples at various excitation wavelengths obtained in microspectroscopy. (a) Spectra are normalized to the maximum 2PEF emission of the most intense spectrum (here at 770 nm excitation wavelength), (b) spectra are normalized with respect to 515 nm.
Under 750 nm excitation, collagen emission spectrum showed an intensity maximum at 450 nm, while elastin exhibited a shoulder at this same wavelength. With increasing excitation wavelength, the 450 nm collagen peak decreased and the elastin 450 nm shoulder disappeared. This behavior suggests that, in collagen and elastin, the same chromophore is responsible for the emission at 450 nm. To the best of our knowledge, no study of the spectral dependence of elastin 2PEF has been performed; however this interpretation is in good agreement with observations reported by Thornhill [35] using one-photon excitation.
3.3. Fiber-optic spectroscopy and microspectroscopy of lung tissue samples
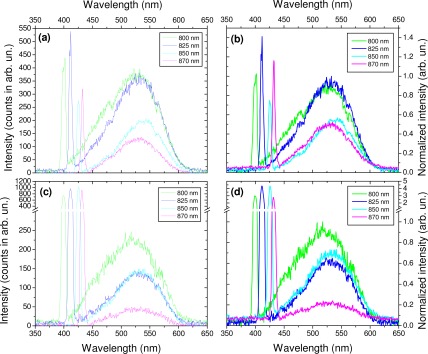
As shown in Fig. 8 , the fiber-optic spectrometer allows to record emission spectra from bronchus and lung alveoli samples for all excitation wavelengths, with SHG and 2PEF signals easily observable. The global spectral behavior appeared similar for both samples. The 2PEF emission exhibited a maximum around 515 - 525 nm at 800 nm excitation, shifting to the red with increasing excitation wavelength; the shoulder observable around 450 nm at 800 nm excitation decreased with the excitation wavelength.
Fig. 8.
Typical emission spectra obtained for various excitation wavelengths using fiber-optic spectroscopy: bronchus (a) raw data and (b) normalized results with respect to the highest 2PEF signal, and alveoli (c) raw data and (d) normalized results with respect to the highest 2PEF signal.
A study of the excitation wavelength spectral dependence of the samples could be done using the microspectroscopy results, since the recorded spectra originate from the same site for all excitation wavelengths. In this configuration, the peak SHG signal intensities measured from the lung alveoli and the bronchus samples as a function of excitation wavelength (Fig. 9 ) were closely following the behavior observed for the collagen gel sample SHG: a very weak intensity at 750 and 770 nm excitation and a maximum at 870 nm excitation. A global decrease of the 2PEF emission intensity with increasing excitation wavelength was observed. A comparison with elastin (Fig. 7(a)) shows that the tissue sample intensity dependence follows the same trend.
Fig. 9.
Typical emission spectra obtained for various excitation wavelengths using microspectroscopy: (a) bronchus and (b) lung alveoli normalized results with respect to the highest 2PEF signal.
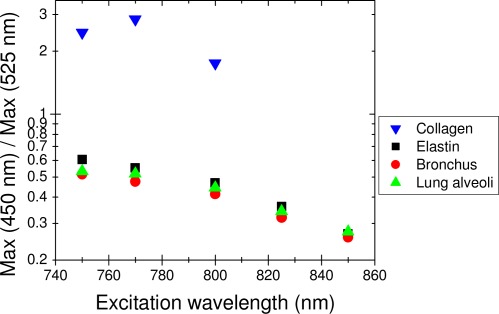
As shown in the previous paragraph, both collagen and elastin presented fluorescence emissions around 450 nm and 525 nm. The ratio of the intensity at 450 nm to that at 525 nm as a function of excitation wavelength is displayed in Fig. 10 for collagen, elastin and tissue samples. Notice that elastin and lung tissues exhibit a very similar behavior while the collagen one is drastically different.
Fig. 10.
Ratio of the fluorescence intensity at 450 nm vs. that at 525 nm, as a function of the excitation wavelength for collagen, elastin, and lung tissue sample. (Above 800 nm, 2PEF is not observed from the collagen sample.)
In the fiber-optic spectroscopic configuration, for each sample, spectra were acquired from a different tissue site; nevertheless, it appears clearly that the excitation wavelength dependence of the 2PEF emission maxima positions and of the global intensity are the same in the two configurations.
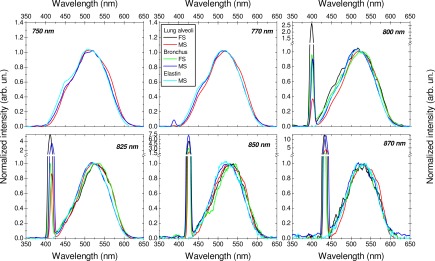
A comparison of fluorescence spectral shapes of tissue samples and elastin emissions for various wavelengths, under fiber-optic spectroscopy and microspectroscopy is shown in Fig. 11 . At 750 and 770 nm excitations, an excellent fit is observed between lung tissues and elastin spectral shapes. From 800 to 870 nm excitations, a slight red shift can be observed for bronchus and alveoli samples under fiber-optic spectroscopy and microspectroscopy as well. Further work is needed to investigate this behavior. All these results clearly indicate that the lung tissue 2PEF emission, from 750 to 870 nm excitation wavelengths, originates predominantly from ECM elastin fibers.
Fig. 11.
2PEF and SHG spectra obtained using fiber-optic spectroscopy (FS) versus microspectroscopy (MS) configuration, originating from lung alveoli (black curve, FS; red curve, MS), bronchus (green curve, FS; blue curve, MS), and elastin powder (cyan curve, MS), at various excitation wavelengths.
In the fiber-optic spectroscopy configuration, it can be noted that at 850 and 870 nm excitations, the collagen SHG signal is the highest while the 2PEF emission originating from elastin is still easily observable. This spectral band can be regarded as optimum for discrimination and spectral analysis of human lung ECM collagen and elastin network.
Multiphotonic tissular emission spectra from subepithelial layers have been reported in the literature for a variety of ex vivo tissues, in particular in porcine and rabbit arteries [36], rabbit esophagus [37], human skin [3,38], mice bronchus [10]. In these papers, different excitation wavelengths were used, between 730 nm and 830 nm. For all these various tissues, the 2PEF emission is predominantly attributed to the ECM elastin component, with an emission peak in the range 475 - 511 nm. At 750 nm excitation, our results showing an emission peak around 500 - 510 nm (Fig. 9) are in good agreement with those obtained by Zhuo et al. on mice bronchus [10], displaying an emission maximum around 500 nm at 760 nm excitation. For longer excitation wavelengths, we observed a slight red shift of the emission maximum (around 520 nm at 825 nm excitation, see Fig. 9). In this excitation spectral range, at 830 nm, two studies dealing with ex vivo fresh human skin report different values of the dermis elastin emission peak: 475 nm [38] and 510 nm [3]. It is to be noted that Laiho et al. used a custom-made filter wheel resulting in an uncertainty in the emission maximum determination of 15 nm, while Zhuo et al. used a photomultiplier array based detector leading to a spectral resolution of 10.7 nm; in our experiments, the spectral resolution is better than 4 nm. However, these spectral resolution uncertainties cannot completely account for the maximum positions discrepancies. The studies reported on human dermis were realized on fresh tissues while our experiments were carried out on formaline-fixed samples, which might affect the tissue spectral properties. However, it was shown that under blue-violet monophotonic excitation, no change of the autofluorescence spectral shape was observed between in vivo and formalin-fixed samples of human bronchial tissue [39]. Finally, it should be kept in mind that our study and those quoted above concern different types of tissue.
3.4. Distal scanning imaging
Starting from our device, two endomicroscopy techniques can be developed, either a distal scanning of a single fiber or a proximal scanning of a fiber bundle. In order to show the imaging capacity of the system, as a proof of concept, we added a galvanometric scanning system and an objective at the distal end of our fiber (see section 2.5) which enables us to obtain a multiphotonic image of the tissue (Fig. 12 ).
Fig. 12.
SHG (green) and 2PEF (red) images from bronchus under 800 nm excitation wavelength from distal sampling fiber imaging system. Left image is the combination of both signals.
These images show the possibility of performing non-linear fiber endomicroscopy using a tunable wavelength grism stretcher. The acquisition time was as short as 1 s. Development of such an endomicroscope is out of the scope of the present study and is part of further investigations.
4. Conclusion
The first excitation-wavelength-tunable nonlinear fiber-optic spectrometer has been developed, featuring a specific dispersion compensation line, which allows an excitation wavelength tunability from 800 to 900 nm. A nonlinear spectroscopic study on ex vivo human lung tissue samples was performed: backward SHG (collagen) and 2PEF (elastin) signals were recorded via one single-mode optical fiber in an endoscopic-like configuration. In this fiber-optic configuration, the optimum excitation spectral band for lung exploration is 850 - 870 nm, allowing the discrimination of SHG of collagen from 2PEF of elastin; this discrimination is unambiguous thanks to the absence of collagen 2PEF.
Because of its specificities, this nonlinear fiber spectrometer can be used for various studies of endogenous and exogenous fluorophores or harmonophores. The excitation tunability allows the study of a number of cellular endogenous fluorophores (NADH, flavins, lipopigments, porphyrins), and exogenous fluorescent probes labeling specific tissue or cell microstructures. The spectral signatures of these endogenous and exogenous markers are profusely used in biological and preclinical applications.
In summary, this study demonstrates the feasibility of endoscopic nonlinear spectroscopy and its application to the spectral analysis of ECM collagen and elastin network. It paves the way to tunable excitation multiphotonic endomicroscopy.
Acknowledgments
The authors thank Gervaise Mosser from “Chimie de la Matière Condensée” laboratory, UPMC Univ. Paris 06, for kindly providing fibrillar collagen. Also, the authors are grateful to Nicolas Vilette (training B.Sc. student) for his valuable and greatly appreciated technical help. The project is funded by the Agence Nationale de la Recherche (project ONL-in vivo ANR-08-TECS-0006-01) and is a collaboration between AnBioPhy (Paris, France), XLIM (Limoges, France), Rouen University Hospital (Rouen, France) and Mauna Kea Technologies company (Paris, France).
References and links
- 1.Zoumi A., Yeh A., Tromberg B. J., “Imaging cells and extracellular matrix in vivo by using second-harmonic generation and two-photon excited fluorescence,” Proc. Natl. Acad. Sci. U.S.A. 99(17), 11014–11019 (2002). 10.1073/pnas.172368799 [DOI] [PMC free article] [PubMed] [Google Scholar]
- 2.Zipfel W. R., Williams R. M., Christie R., Nikitin A. Y., Hyman B. T., Webb W. W., “Live tissue intrinsic emission microscopy using multiphoton-excited native fluorescence and second harmonic generation,” Proc. Natl. Acad. Sci. U.S.A. 100(12), 7075–7080 (2003). 10.1073/pnas.0832308100 [DOI] [PMC free article] [PubMed] [Google Scholar]
- 3.Zhuo S., Chen J., Luo T., Zou D., Zhao J., “Multimode nonlinear optical imaging of the dermis in ex vivo human skin based on the combination of multichannel mode and Lambda mode,” Opt. Express 14(17), 7810–7820 (2006). 10.1364/OE.14.007810 [DOI] [PubMed] [Google Scholar]
- 4.König K., Ehlers A., Riemann I., Schenkl S., Bückle R., Kaatz M., “Clinical two-photon microendoscopy,” Microsc. Res. Tech. 70(5), 398–402 (2007). 10.1002/jemt.20445 [DOI] [PubMed] [Google Scholar]
- 5.Peyrot D. A., Aptel F., Crotti C., Deloison F., Lemaire S., Marciano T., Bancelin S., Alahyane F., Kowalczuk L., Savoldelli M., Legeais J.-M., Plamann K., “Effect of incident light wavelength and corneal edema on light scattering and penetration: laboratory study of human corneas,” J. Refract. Surg. 26(10), 786–795 (2010). 10.3928/1081597X-20100921-04 [DOI] [PubMed] [Google Scholar]
- 6.Jay L., Brocas A., Singh K., Kieffer J.-C., Brunette I., Ozaki T., “Determination of porcine corneal layers with high spatial resolution by simultaneous second and third harmonic generation microscopy,” Opt. Express 16(21), 16284–16293 (2008). 10.1364/OE.16.016284 [DOI] [PubMed] [Google Scholar]
- 7.Strupler M., Pena A.-M., Hernest M., Tharaux P.-L., Martin J.-L., Beaurepaire E., Schanne-Klein M.-C., “Second harmonic imaging and scoring of collagen in fibrotic tissues,” Opt. Express 15(7), 4054–4065 (2007). 10.1364/OE.15.004054 [DOI] [PubMed] [Google Scholar]
- 8.Chen J., Zhuo S., Jiang X., Zhu X., Zheng L., Xie S., Lin B., Zeng H., “Multiphoton microscopy study of the morphological and quantity changes of collagen and elastic fiber components in keloid disease,” J. Biomed. Opt. 16(5), 051305 (2011). 10.1117/1.3569617 [DOI] [PubMed] [Google Scholar]
- 9.Aptel F., Olivier N., Deniset-Besseau A., Legeais J.-M., Plamann K., Schanne-Klein M.-C., Beaurepaire E., “Multimodal nonlinear imaging of the human cornea,” Invest. Ophthalmol. Vis. Sci. 51(5), 2459–2465 (2010). 10.1167/iovs.09-4586 [DOI] [PubMed] [Google Scholar]
- 10.Zhuo S., Chen J., Yu B., Jiang X., Luo T., Liu Q., Chen R., Xie S., “Nonlinear optical microscopy of the bronchus,” J. Biomed. Opt. 13(5), 054024 (2008). 10.1117/1.2982534 [DOI] [PubMed] [Google Scholar]
- 11.Pena A.-M., Fabre A., Débarre D., Marchal-Somme J., Crestani B., Martin J.-L., Beaurepaire E., Schanne-Klein M.-C., “Three-dimensional investigation and scoring of extracellular matrix remodeling during lung fibrosis using multiphoton microscopy,” Microsc. Res. Tech. 70(2), 162–170 (2007). 10.1002/jemt.20400 [DOI] [PubMed] [Google Scholar]
- 12.Wang C.-C., Li F.-C., Wu R.-J., Hovhannisyan V. A., Lin W.-C., Lin S. J., So P. T., Dong C.-Y., “Differentiation of normal and cancerous lung tissues by multiphoton imaging,” J. Biomed. Opt. 14(4), 044034 (2009). 10.1117/1.3210768 [DOI] [PubMed] [Google Scholar]
- 13.Abraham T., Hogg J., “Extracellular matrix remodeling of lung alveolar walls in three dimensional space identified using second harmonic generation and multiphoton excitation fluorescence,” J. Struct. Biol. 171(2), 189–196 (2010). 10.1016/j.jsb.2010.04.006 [DOI] [PubMed] [Google Scholar]
- 14.Abraham T., Carthy J., McManus B., “Collagen matrix remodeling in 3-dimensional cellular space resolved using second harmonic generation and multiphoton excitation fluorescence,” J. Struct. Biol. 169(1), 36–44 (2010). 10.1016/j.jsb.2009.07.023 [DOI] [PubMed] [Google Scholar]
- 15.Thiberville L., Moreno-Swirc S., Vercauteren T., Peltier E., Cavé C., Bourg Heckly G., “In vivo imaging of the bronchial wall microstructure using fibered confocal fluorescence microscopy,” Am. J. Respir. Crit. Care Med. 175(1), 22–31 (2007). 10.1164/rccm.200605-684OC [DOI] [PubMed] [Google Scholar]
- 16.Thiberville L., Salaün M., Lachkar S., Dominique S., Moreno-Swirc S., Vever-Bizet C., Bourg-Heckly G., “Human in vivo fluorescence microimaging of the alveolar ducts and sacs during bronchoscopy,” Eur. Respir. J. 33(5), 974–985 (2009). 10.1183/09031936.00083708 [DOI] [PubMed] [Google Scholar]
- 17.André B., Vercauteren T., Buchner A. M., Wallace M. B., Ayache N., “A smart atlas for endomicroscopy using automated video retrieval,” Med. Image Anal. 15(4), 460–476 (2011). 10.1016/j.media.2011.02.003 [DOI] [PubMed] [Google Scholar]
- 18.Jean F., Bourg-Heckly G., Viellerobe B., “Fibered confocal spectroscopy and multicolor imaging system for in vivo fluorescence analysis,” Opt. Express 15(7), 4008–4017 (2007). 10.1364/OE.15.004008 [DOI] [PubMed] [Google Scholar]
- 19.Lefort C., Mansuryan T., Louradour F., Barthélémy A., “Pulse compression and fiber delivery of 45 fs Fourier transform limited pulses at 830 nm,” Opt. Lett. 36(2), 292–294 (2011). 10.1364/OL.36.000292 [DOI] [PubMed] [Google Scholar]
- 20.Wu Y., Leng Y., Xi J., Li X., “Scanning all-fiber-optic endomicroscopy system for 3D nonlinear optical imaging of biological tissues,” Opt. Express 17(10), 7907–7915 (2009). 10.1364/OE.17.007907 [DOI] [PMC free article] [PubMed] [Google Scholar]
- 21.Oberthaler M., Höpfel R. A., “Spectral narrowing of ultrashort laser pulses by self-phase modulation in optical fibers,” Appl. Phys. Lett. 63(8), 1017–1019 (1993). 10.1063/1.109820 [DOI] [Google Scholar]
- 22.Tang S., Jung W., McCormick D., Xie T., Su J., Ahn Y.-C., Tromberg B. J., Chen Z., “Design and implementation of fiber-based multiphoton endoscopy with microelectromechanical systems scanning,” J. Biomed. Opt. 14(3), 034005 (2009). 10.1117/1.3127203 [DOI] [PMC free article] [PubMed] [Google Scholar]
- 23.Bao H., Boussioutas A., Jeremy R., Russell S., Gu M., “Second harmonic generation imaging via nonlinear endomicroscopy,” Opt. Express 18(2), 1255–1260 (2010). 10.1364/OE.18.001255 [DOI] [PubMed] [Google Scholar]
- 24.Bao H., Allen J., Pattie R., Vance R., Gu M., “Fast handled two-photon fluorescence microendoscope with a 475 µm × 475 µm field of view for in vivo imaging,” Opt. Lett. 33(12), 1333–1335 (2008). 10.1364/OL.33.001333 [DOI] [PubMed] [Google Scholar]
- 25.Clark S. W., Ilday F. O., Wise F. W., “Fiber delivery of femtosecond pulses from a Ti:sapphire laser,” Opt. Lett. 26(17), 1320–1322 (2001). 10.1364/OL.26.001320 [DOI] [PubMed] [Google Scholar]
- 26.Le T., Tempea G., Cheng Z., Hofer M., Stingl A., “Routes to fiber delivery of ultra-short laser pulses in the 25 fs regime,” Opt. Express 17(3), 1240–1247 (2009). 10.1364/OE.17.001240 [DOI] [PubMed] [Google Scholar]
- 27.Fork R. L., Martinez O. E., Gordon J. P., “Negative dispersion using pairs of prisms,” Opt. Lett. 9(5), 150–152 (1984). 10.1364/OL.9.000150 [DOI] [PubMed] [Google Scholar]
- 28.Treacy E. B., “Optical pulse compression with diffraction gratings,” IEEE J. Quantum Electron. 5(9), 454–458 (1969). 10.1109/JQE.1969.1076303 [DOI] [Google Scholar]
- 29.Tournois P., “New diffraction grating pair with very linear dispersion for laser pulse compression,” Electron. Lett. 29(16), 1414–1415 (1993). 10.1049/el:19930947 [DOI] [Google Scholar]
- 30.Gibson E. A., Gaudiosi D. M., Kapteyn H. C., Jimenez R., Kane S., Huff R., Durfee C., Squier J., “Efficient reflection grisms for pulse compression and dispersion compensation of femtosecond pulses,” Opt. Lett. 31(22), 3363–3365 (2006). 10.1364/OL.31.003363 [DOI] [PubMed] [Google Scholar]
- 31.Buettner A., Buenting U., Wandt D., Neumann J., Kracht D., “Ultrafast double-slab regenerative amplifier with combined gain spectra and intracavity dispersion compensation,” Opt. Express 18(21), 21973–21980 (2010). 10.1364/OE.18.021973 [DOI] [PubMed] [Google Scholar]
- 32.Gobeaux F., Mosser G., Anglo A., Panine P., Davidson P., Giraud-Guille M.-M., Belamie E., “Fibrillogenesis in dense collagen solutions: a physicochemical study,” J. Mol. Biol. 376(5), 1509–1522 (2008). 10.1016/j.jmb.2007.12.047 [DOI] [PubMed] [Google Scholar]
- 33.Bloembergen N., Chang R. K., Jha S. S., Lee C. H., “Optical second-harmonic generation in reflection from media with inversion symmetry,” Phys. Rev. 174(3), 813–822 (1968). 10.1103/PhysRev.174.813 [DOI] [Google Scholar]
- 34.Sokolov K., Galvan J., Myakov A., Lacy A., Lotan R., Richards-Kortum R., “Realistic three-dimensional epithelial tissue phantoms for biomedical optics,” J. Biomed. Opt. 7(1), 148–156 (2002). 10.1117/1.1427052 [DOI] [PubMed] [Google Scholar]
- 35.Thornhill D. P., “Separation of a series of chromophores and fluorophores present in elastin,” Biochem. J. 147(2), 215–219 (1975). [DOI] [PMC free article] [PubMed] [Google Scholar]
- 36.Zoumi A., Lu X., Kassab G. S., Tromberg B. J., “Imaging coronary artery microstructure using second-harmonic and two-photon fluorescence microscopy,” Biophys. J. 87(4), 2778–2786 (2004). 10.1529/biophysj.104.042887 [DOI] [PMC free article] [PubMed] [Google Scholar]
- 37.Chen J., Zhuo S., Chen R., Jiang X., Xie S., Zou Q., “Depth-resolved spectral imaging of rabbit oesophageal tissue based two-photon excited fluorescence and second-harmonic generation,” New J. Phys. 9(7), 212 (2007). 10.1088/1367-2630/9/7/212 [DOI] [Google Scholar]
- 38.Laiho L. H., Pelet S., Hancewicz T. M., Kaplan P. D., So P. T. C., “Two-photon 3-D mapping of ex vivo human skin endogenous fluorescence species based on fluorescence emission spectra,” J. Biomed. Opt. 10(2), 024016 (2005). 10.1117/1.1891370 [DOI] [PubMed] [Google Scholar]
- 39.Gabrecht T., Andrejevic-Blant S., Wagnières G., “Blue-violet excited autofluorescence spectroscopy and imaging of normal and cancerous human bronchial tissue after formalin fixation,” Photochem. Photobiol. 83(2), 450–459 (2007). 10.1562/2006-03-20-RA-852 [DOI] [PubMed] [Google Scholar]


