

Abstract
Background and rationale
Methionine adenosyltransferases (MAT) are critical enzymes that catalyze the formation of the methyl donor, S-adenosylmethionine (SAMe). The MAT2A gene, which encodes the catalytic subunit α2, is induced in de-differentiated liver. We previously demonstrated that MAT2A expression is enhanced in activated hepatic stellate cells (HSCs) and silencing this gene reduces HSC activation. In this study we examined the molecular mechanisms responsible for the transcriptional regulation of the MAT2A gene in HSCs.
Results
We identified peroxisome proliferator-activated receptor (PPAR) response elements (PPREs) in the rat MAT2A promoter. The PPARγ agonist, rosiglitazone (RSG) promoted quiescence in the activated rat HSC cell line (BSC) or culture-activated primary rat HSCs, decreased MAT2A expression and promoter activity and enhanced PPARγ binding to MAT2A PPREs. In vivo HSC activation in bile duct ligated (BDL) rats lowered PPARγ interaction with MAT2A PPREs. Silencing PPARγ increased MAT2A transcription whereas over-expressing it had the opposite effect demonstrating that PPARγ negatively controls this gene. Site-directed mutagenesis of PPREs abolished PPARγ recruitment to the MAT2A promoter and its inhibitory effect on MAT2A transcription in quiescent HSCs. PPRE mutations decreased the basal promoter activity of MAT2A in activated HSCs independent of PPARγ, indicating that other factors might be involved in PPRE interaction. We identified PPARβ binding to wild type but not to mutated PPREs, in activated cells. Furthermore, silencing PPARβ inhibited MAT2A expression and promoter activity. Forced expression of MAT2A in RSG-treated HSCs lowered PPARγ and enhanced PPARβ expression, thereby promoting an activated phenotype.
Conclusion
We have identified PPARγ as a negative regulator of MAT2A in quiescent HSCs. A switch from quiescence to activation state abolishes this control and allows PPARβ to up-regulate MAT2A transcription.
Keywords: Fibrosis, Fibrogenesis, Bile duct ligation, DNA response elements, S-adenosylmethionine
INTRODUCTORY STATEMENT
The hepatic stellate cell (HSC) is an important fibrogenic cell type of the liver. In normal liver, it is the major storage compartment for vitamin A (1). Following chronic liver injury, HSCs undergo activation with increased proliferation, loss of vitamin A and production of excessive matrix proteins and enhanced expression of alpha-smooth muscle actin (α-SMA) and collagen (1). HSC activation is associated with modulation of transcription factors such as the peroxisome proliferator-activated receptor (PPAR) class of nuclear receptors (2). PPARs regulate the expression of responsive genes by forming heterodimers with retinoid X receptors (RXRs). These heterodimers bind to DNA on a specific PPAR response element (PPRE), a hexameric direct repeat (called the DR1 element) separated by a single nucleotide (TGACCTnTGACCT) (3). However, imperfect PPREs that are not exact matches of this hexameric repeat have also been identified in several genes with variations in the binding site and spacer sequence (4). Three subtypes of PPAR proteins are known, namely PPARα, β and γ and all three are expressed by normal HSCs (5). PPARγ, an essential transcription factors involved in adipocyte differentiation, is highly expressed in quiescent or differentiated HSCs (6). However, its expression and activity decreases dramatically during HSC activation both in in vitro cultured HSCs and in in vivo activated HSCs from livers of rats undergoing bile duct ligation (BDL) (2). PPARγ expression can be restored in activated HSCs by treatment with specific ligands such as rosiglitazone (RSG) that are able to revert the activated phenotype to quiescent state with increased retinyl esters, increased expression of CCAAT-enhancer-binding proteins (C/EBP), decrease in collagen and α-SMA and suppressed cell proliferation (6, 7, 8). In contrast to PPARγ, the PPARβ protein is strongly induced during HSC activation and treatment of HSCs with PPARβ agonists induces cellular proliferation (3).
Methionine adenosyltransferases (MAT) are critical for cell survival because they are responsible for the conversion of methionine to S-adenosylmethionine (SAMe), an essential biological methyl donor (9). Mammalian cells express two genes MAT1A and MAT2A that encode the two MAT catalytic subunits, α1 and α2, respectively. The α1 subunit organizes into dimers (MATIII) or tetramers (MATI) (9,10). The α2 subunit is found in the MATII isoform (11). A third gene MAT2B, encodes for a β regulatory subunit that regulates the activity of MATII by lowering the inhibition constant (Ki) for SAMe and the Michaelis constant (Km) for methionine (12). MAT1A is expressed mainly in hepatocytes and maintains the differentiated state of these cells (12). MAT2A and MAT2B are expressed in extra-hepatic tissues and are induced in liver during active growth and de-differentiation (13,14). In HSCs, SAMe is synthesized only by MAT2A because these cells do not express MAT1A (14). Recently, we demonstrated that both MAT2A and MAT2B genes are up-regulated during HSC activation (15). Interestingly, despite the increase in MAT2A, there was a rapid drop in the activity of the MATII enzyme and intracellular SAMe levels during HSC activation. We attributed this decrease to the rapid induction of MAT2B along with MAT2A that might have caused a change in the ratio of the β to α2 subunits in the MATII enzyme, rendering it more susceptible to feedback inhibition by SAMe (15). Silencing of the MAT2A gene reduces HSC activation and suppresses cellular proliferation (15), thereby indicating that regulation of this gene may be important in determining HSC phenotype. The aim of this study is to examine the molecular mechanisms responsible for the transcriptional regulation of the MAT2A gene in quiescent and activated HSCs. We demonstrate for the first time that the PPARγ transcription factor exerts a strong, negative regulatory control on MAT2A transcription in quiescent HSCs and loss of PPARγ activity allows positive regulators such as PPARβ to induce MAT2A during HSC activation.
EXPERIMENTAL PROCEDURES
HSC isolation and cell culture
The use of animals in this study was approved by the Institutional Animal Care and Use Committee (IACUC) of the University of Southern California (USC). HSCs were isolated from normal male Wistar rats or Wistar rats undergoing sham operation or BDL for 10 days by the Non-parenchymal Liver Cell Core of the Southern California Research Center for Alcoholic Liver and Pancreatic Diseases and Cirrhosis as described previously (16). The viability (trypan blue exclusion) and the purity of isolated HSCs (ultraviolet-excited fluorescence microscopy), exceeded 95%. Normal HSCs were culture activated on plastic dishes till day 5. Sham and BDL HSCs were plated in 2% FBS containing low-glucose DMEM on plastic dishes for 16 hours. (15). The activated rat HSC cell line, BSC (17), was kindly provided by Dr. Hidekazu Tsukamoto at USC.
Cell treatment conditions
Rat BSC cells (0.4×10⁴ per cm2) or day 5 culture-activated primary rat HSCs (5×10⁴ per cm2) were treated with 50 μM or 10 μM of RSG (18), respectively (Cayman Chemical, Ann Arbor, MI) or DMSO (control) for 48 hours. Plasmid or siRNA transfections were performed during the last 24 hours of RSG treatment. In experiments involving a combination of plasmid and siRNA transfections, cells were maintained in RSG-containing medium for 72 hours during which siRNA and plasmid were sequentially transfected for the last 48 and 24 hours, respectively.
Transient transfection assays
The MAT2A promoter fragment. (accession ID AB000717.2) (19) was cloned into pGL3-Basic luciferase vector (Promega, Madison, WI). Cells were transfected for 24 hours with 0.5 μg of this construct or pGL3-Basic. Promoter activity was assayed using the Dual-Luciferase Reporter Assay system (Promega). For over-expression studies, rat BSC cells were transfected for 48 hours with the pCMV6-rMAT2A vector (125 ng) (OriGene, Rockville, MD) or pcDNA 3.1(−) rat C/EBP beta (500 ng) (Plasmid 12558, Addgene, Cambridge, MA). All transient transfections were performed using the Superfect™ reagent (Qiagen, Valencia, CA) (20).
RNAi analysis
RSG-treated BSC cells were transfected with FlexiTube siRNAs (Qiagen) against rat PPARγ, rat C/EBPβ or a negative control siRNA or using RNAiMax (Invitrogen, Carlsbad, CA) (15, 20). BSC cells or day 5 primary HSCs were transfected with Silencer® Select siRNAs (Invitrogen) against PPARβ at a concentration of 30 nM for 48 hours using RNAiMAX.
Adenoviral vector transduction
The adenoviral (Adv) vector containing full length PPARγ (PPARγAdv) or GFP (negative control Adv) was kindly provided by Dr. Hidekazu Tsukamoto. The vector was amplified in 293 cells (6). Viruses were purified on Vivapure AdenoPack-20 purification columns. (Sartorius Stedim Biotech, GmBH, Germany). The viral titre was determined by the TCID50 ((tissue culture infectious dose) (6). BSC cells were transduced with Adv at a multiplicity of infection (MOI) of 100 for a period of 72 hours.
Real-time RT-PCR analysis
Reverse transcribed RNA was subjected to real-time RT-PCR usingTaqMan probes for rat MAT2A, PPARγ, PPARβ, C/EBPβ and the housekeeping gene, GAPDH (ABI, Foster City, CA), using PCR conditions described previously (15).
Western blot analysis
Total cellular protein was subjected to western blotting using antibodies for MAT2A (Novus Biologicals, Littleton, CO), PPARγ, PPARβ, C/EBPβ (Santa Cruz Biotechology, Santa Cruz, CA), and control, β-actin (abcam). Blots were quantified using the Quantity One™ densitometry program (Bio-Rad laboratories, Hercules, CA).
PPRE prediction analysis
The rat MAT2A promoter sequence (19) was analyzed by the transcription element search system (TESS) (21) and MATInspector (22) and putative PPREs were identified. A matrix similarity score was calculated according to the software instructions.
ChIP assay
ChIP assays were performed using the ChampionChIP™ kit (SABiosciences, Frederick, MD). Sonicated chromatin was immunoprecipitated with 4 μg of antibodies against PPARγ, PPARβ or GFP, was reverse cross-linked and PCR amplified for 35 cycles with primers described in Table I.
TABLE 1.
PPRE regions in the rat MAT2A promoter.
| Name | Position | Matrix similarity score | PPRE region | Forward primer | Reverse primer |
|---|---|---|---|---|---|
| PPRE-1 | −2061 | 0.928 | TAGCCT-T-TGTCCC | 5′-AATTCAAGGC-CAGTGAGTGAG-3′ | 5′-TCAATTCCTC-TGTCTTTAGCC-3′ |
| PPRE-2 | −1714 | 0.85 | TAACCT-T-TTAATT | 5′-CCTGTTAGTTA-ACAGTAGAATC-3′ | 5′-TCCAGCAGA-AAAATCTAT-3′ |
| PPRE-3 | −1656 | 0.774 | TGACCA-G-TCTCCA | 5′-GGCTTCCATA-TAGATTTTTCT-3′ | 5′-AGGCAGCATG-ATGATATT-3′ |
| PPRE-4 | −1433 | 0.894 | TGAGCT-G-TGTCCC | 5′-GAGCCATCTCTCTAGCTCCT-3′ | 5′-CTGTGGGAA-ACAAAGGAA-3′ |
| PPRE-5 | −1347 | 0.832 | CCACCT-T-TGCACT | 5′-AGGCTCCTAGCAAAGCCTAA-3′ | 5′-CTGAGAACCA-CCATTTGTCA-3′ |
| PPRE-6 | −364 | 0.806 | TGGGCA-A-CGGTCG | 5′-GTAGGATGAATAGGTGCGTG-3′ | 5′-GTGCCCCCTG-ACAGTAGTTA-3′ |
Six potential PPREs identified using the Transcription element search system (TESS) and MATInspector analysis tools are shown along with their sequence and the matrix similarity score. Only those PPREs with a matrix similarity score of approximately 0.8 or higher were selected for the study. The position of each PPRE is relative to the +1 start site of transcription. Sequences of the ChIP primers used to examine PPRE binding are shown.
ChIP real-time PCR
ChIP-ready genomic DNA was subjected to real-time PCR using the Maxima® SybrGreen mastermix (Thermo Scientific, Rockford, IL) and ChIP primers (Table I). The thermal profile consisted of initial denaturation at 95°C/15 minutes, 40 cycles at 95°C/15 seconds, 58°C/30 seconds and 72°C/30 seconds. The cycle threshold (Ct value) of PPAR-immunoprecipitated genomic DNA was normalized to input DNA to obtain the delta Ct (ΔCt). The ΔCt was used to determine the differential target site occupancy according to the formula: Target site occupancy= 2−ΔΔCt, where ΔΔCt= ΔCt of genomic DNA in experimental condition − ΔCt of genomic DNA under control condition.
Site-directed mutagenesis and generation of PPRE deletion mutants
PPRE sites in the rat MAT2A promoter were mutated using the QuikChange® Lightning Site-Directed Mutagenesis Kit (Stratagene, La Jolla, CA). Primers were designed according to the kit and 3–4 mutations were introduced in each PPRE site (Fig. 5A). Deletion mutants were generated by PCR amplifying each PPRE region (primers in supplemental Table I) and placing it 5′ of the basal MAT2A fragment (b2A) cloned in pGL3-basic. (Fig. 5B).
Fig. 5. Effect of MAT2A PPRE mutations on regulatory control by PPARγ.

A. Control and RSG-treated BSC cells were transfected with wild type MAT2A promoter (W) and its PPRE mutants designated as M1, M2, M4, M5, M6 and the triple PPRE mutant M1/2/4. Mutated sites in each PPRE are indicated in bold. The luciferase activity in all samples was normalized to that of pGL3-Basic and expressed as a percentage of the wild type promoter activity in control cells. Results represent mean ± S.E. from four experiments in duplicates, *p<0.005, **p<0.05 vs. wild type MAT2A promoter in control cells. B. PPRE deletion mutants were transfected into control and RSG-treated BSC cells. Normalized luciferase activity was expressed as a percentage of the b2A promoter in control cells. Results represent mean ± S.E. from four experiments, *p<0.005, **p<0.05 vs. b2A construct in control cells.
EMSA
Nuclear extracts were prepared according to the NE-PER® nuclear and cytoplasmic extraction protocol (Thermo Scientific, Rockford, IL). Extracts were subjected to EMSA and supershift (3 μg antibody) using the LightShift® Chemiluminescent EMSA Kit protocol (Thermo Scientific) and probes described in supplemental Table II.
Statistical analysis
Data are represented as mean ± standard error (mean ± S.E.) Statistical analysis was performed using analysis of variance (ANOVA) followed by Student’s t test. Significance was defined as P<0.05.
RESULTS
Identification of PPRE sites in the rat MAT2A promoter
A 2.2 Kb region of the rat MAT2A promoter has been previously cloned and its sequence has been analyzed by Hiroki et al. (19). The first 73bp of this promoter include a canonical TATA box and a GC-rich element which confers constitutive transcription to this promoter in different cell types (19). Using the TESS and MATInspector analysis tools we identified several PPREs in the MAT2A promoter spanning a 7 Kb region upstream of the +1 transcription start site. Four distal PPREs were identified 5–7 Kb upstream of the +1 site. Six PPRE elements were identified in the proximal MAT2A promoter within a 2061 bp region upstream of the +1 transcription start site (Table I). Good matches to the matrix had a similarity score of 0.8 or more (Table I). The distal PPRE sites of MAT2A had a matrix score less than 0.8 and did not qualify for this study. The scores of the proximal PPRE elements in the 2.2 Kb region were greater than 0.8 and provided the rationale for examining this region for functional regulation by PPARs.
Effect of PPARγ activation on MAT2A expression and promoter activity
It is known that RSG induces the activity and expression of PPARγ, a marker of quiescent HSCs (7, 23). PPARγ expression was induced in BSC cells after RSG treatment (Fig. 1B), confirming previous findings. RSG treatment of BSC cells also induced other markers of differentiation such as C/EBPβ (Fig. 1B). RSG inhibited the expression of MAT2A mRNA and protein, by 2.5-fold and 1.6-fold respectively (Figs. 1A & 1B) and reduced MAT2A promoter activity by 1.6-fold compared to control cells (Fig. 1C). RSG treatment of primary rat HSCs also reduced the promoter activity of MAT2A (Fig. 1D), confirming the cell line results.
Fig. 1. Effect of PPARγ activation on MAT2A expression and promoter activity.

BSC cells or primary rat HSCs were treated with RSG or DMSO (control) for 48 hours as described under “Experimental procedures”. A. Total RNA from BSC cells was subjected to real-time RT-PCR analysis and expression of MAT2A and PPARγ was compared to that of control. Results represent mean ± S.E. from three experiments in duplicates, *p<0.005 vs. control. B. Total cellular protein from BSC cells was subjected to western blotting for detection of MAT2A or PPARγ. Representative images and densitometric analysis (mean ± S.E.) from three experiments in duplicates is shown. *P<0.005, **p<0.05 vs. control. C. Luciferase activity from RSG-treated BSC cells transfected with the MAT2A promoter construct was normalized to that of pGL3-Basic and expressed as a fold of control cells. Results represent mean ± S.E. from four experiments in triplicates, *p<0.005 vs. control. D. Luciferase activity from RSG-treated primary rat HSCs transfected with the MAT2A promoter construct was normalized to that of pGL3-Basic and expressed as a fold of control cells. Results represent mean ± S.E. from three HSC preparations in duplicates, *p<0.005 vs. control.
Binding of PPARγ to PPRE sites on the MAT2A promoter
RSG induced PPARγ binding on PPRE sites 1, 2, 4, 5 and 6 compared to that of control (Figs. 2A & 2B). No binding was observed with PPRE-3 (data not shown). Furthermore, BDL-mediated HSC activation resulted in a significant drop in PPARγ binding to MAT2A PPREs compared to sham HSCs (Figs. 2C & 2D).
Fig. 2. Binding of PPARγ to MAT2A PPRE sites.

A. Control and RSG-treated BSC cells were subjected to ChIP to measure the binding of PPARγ to the MAT2A PPRE sites as described under “Experimental procedures”. Input genomic DNA (Input) was used as the loading control and immunoprecipitation with a GFP antibody was used as a negative control. Results are representative agarose gel images of three experiments in duplicates. B. Genomic DNA from immunoprecipitated chromatin as in ‘A’ was quantitated by ChIP real-time PCR as described under “Experimental procedures”. The differential target site occupancy of PPARγ on MAT2A was normalized to input genomic DNA and expressed as fold over control. Results represent mean ± S.E. from three experiments in duplicates. *P<0.005, **P<0.05 vs. control. C. The binding of PPARγ to MAT2A PPREs from BDL HSCs and sham controls was assessed as described in ‘A’. Representative agarose gel images from five HSC preparations in duplicates are shown. D. Genomic DNA from immunoprecipitated chromatin described in ‘C’ was quantitated by ChIP real-time PCR as described under “Experimental procedures”. The differential target site occupancy of PPARγ on MAT2A was normalized to input genomic DNA and expressed as fold over sham. Results represent mean ± S.E. from five HSC preparations in duplicates. *P<0.005 vs. sham.
Effect of PPARγ silencing and over-expression on MAT2A expression and transcriptional activity
We used a gene silencing and over-expression approach to examine whether modulation of PPARγ reserves directly regulate MAT2A expression. Knockdown of PPARγ in RSG-treated BSC cells induced MAT2A mRNA and protein levels by 2.5-fold compared to a negative control siRNA (Figs. 3A & 3B). PPARγ siRNA also induced MAT2A promoter activity by 6-fold compared to a negative control siRNA (Fig. 3C). Over-expression of PPARγ by transduction of BSC cells with PPARγ Adv resulted in a 2.7-fold reduction in both MAT2A mRNA and protein levels compared to negative control Adv (Figs. 4A and 4B). This further inhibited MAT2A promoter activity by 1.6-fold (Fig. 4C).
Fig. 3. Effect of PPARγ knockdown on MAT2A expression and transcriptional activity.

A. RSG-treated BSC cells were transfected with PPARγ siRNA or a negative control siRNA as described under “Experimental procedures”. By real-time RT-PCR, the expression of MAT2A and PPARγ in knockdown cells was compared to that of negative control siRNA. Results represent mean ± S.E. from three experiments in duplicates, *p<0.005 vs. negative control siRNA. B. Cells were treated as in ‘A’ and total cellular protein was subjected to western blotting with antibodies against MAT2A or PPARγ. Representative images and densitometric analysis (mean ± S.E.) from three experiments in duplicates is shown. **P<0.05 vs. negative control siRNA. C. PPARγ knockdown was performed in RSG-treated BSC cells followed by transfection with the MAT2A promoter or pGL3-Basic vector. The luciferase activity in PPARγ knockdown cells was normalized to that of pGL3-basic and expressed as a fold of negative control siRNA. Results represent mean ± S.E. from three experiments in triplicates, **p<0.05 vs. negative control siRNA.
Fig. 4. Effect of PPARγ over-expression on MAT2A expression and transcriptional activity.

A. BSC cells were transduced with PPARγ Adv or negative control Adv as described under “Experimental procedures”. By real-time RT-PCR, the expression of MAT2A and PPARγ mRNA after PPARγ Adv transduction was compared to that of negative control Adv. Results represent mean ± S.E. from four experiments in duplicates, *p<0.005, **p<0.05 vs. negative control Adv. B. Cells were treated as in ‘A’ and total cellular protein was subjected to western blotting with antibodies against MAT2A or PPARγ. Representative images and densitometric analysis (mean ± S.E.) from three experiments in duplicates is shown. **P<0.05 vs. negative control Adv. C. BSC cells transduced with PPARγ Adv or negative control Adv for 72 hours were transfected with the MAT2A promoter construct or the pGL3-basic vector during the last 24 hours of transduction. The luciferase activity in PPARγ Adv-transduced cells was normalized to that of pGL3-Basic and expressed as a fold of negative control Adv. Results represent mean ± S.E. from five experiments in triplicates, **p<0.05, vs. negative control Adv.
Effect of MAT2A PPRE mutations on regulatory control by PPARγ
We examined whether mutating the PPRE sites could influence the regulatory control exerted by PPARγ on the MAT2A promoter in RSG-treated BSC cells. RSG treatment inhibited the promoter activity of wild type MAT2A (W) by 2-fold but was unable to inhibit the activity of any of the individually mutated MAT2A PPREs (M) or the triple PPRE mutant (M1/2/4) compared to control cells (Fig. 5A). The activity of the b2A sequence (−73 to +59) devoid of any PPREs was not affected by RSG treatment (Fig. 5B). Inclusion of a single PPRE upstream of this b2A construct enhanced the activity of the basal promoter in activated HSCs, the effect being most prominent with PPRE-2 and 4 (4-fold compared to b2A). RSG treatment significantly inhibited the activity of the PPRE constructs (Fig. 5B).
Binding of protein factors to the MAT2A PPRE sequences
The binding of mutated PPRE-4 and PPRE-2 probes in an EMSA assay was significantly lower than the wild type probe in RSG-treated cells and a strong supershift of the wild type probe, but not the mutated sequence, was observed with PPARγ antibody, the effect being more prominent with PPRE-2 (Fig. 6A). Control cells did not show any supershift with either the wild type or mutated probe (Fig. 6A). These results indicated that mutations in the PPREs prevented the interaction of PPARγ with the MAT2A promoter, thereby abolishing its negative control on transcriptional activity. Surprisingly, the mutated PPRE constructs of MAT2A exhibited diminished promoter activity as well as binding in activated BSC cells compared to the wild type promoter (Figs. 5A, 6) and since this was in the absence of RSG, it appeared to be a PPARγ-independent effect. Further evidence for this result came from deletion mutants of the PPREs, wherein each PPRE devoid of other PPREs was able to enhance the activity of the b2A promoter in the absence of RSG (Fig. 5B). We examined the possible interaction of other factors with the MAT2A PPREs whose binding might have been altered by the mutation. We first tested whether other PPAR subtypes could bind to MAT2A PPREs. Extracts of BSC cells showed stronger binding to the wild type PPRE-4 and PPRE-2 probes compared to the mutant probe and incubation with a PPARβ antibody interfered with probe binding, thereby lowering the intensity of the shifted band, compared to the corresponding EMSA band (Fig. 6B). This negative supershift has also been reported by other groups specifically for the rabbit PPARβ antibody used in this work (24). These results provided evidence that the PPARβ subtype interacted with the MAT2A PPRE sequence. Whether this interaction had a functional effect was determined in subsequent experiments.
Fig. 6. Binding of PPARs to MAT2A PPREs.
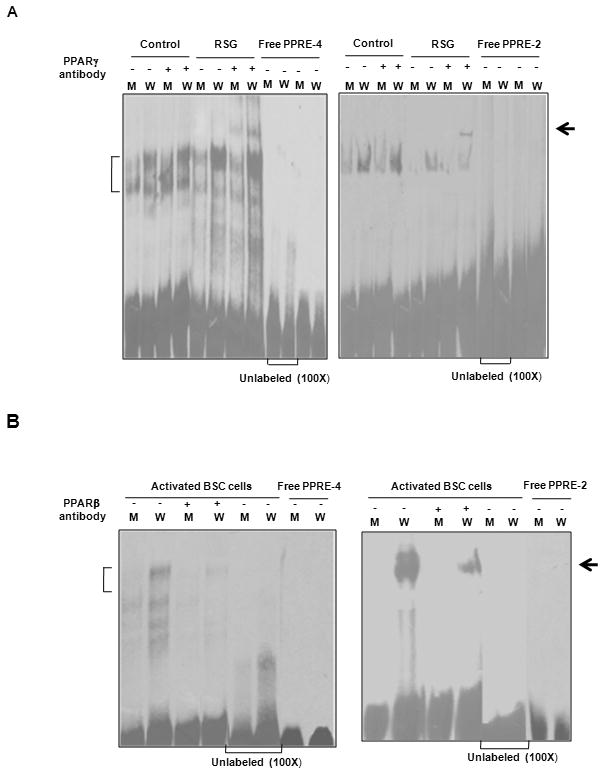
A.. Biotin-labeled probes specific for PPRE-4 or PPRE-2 (designated as W) and their corresponding mutants (M) were incubated with extracts from control and RSG-treated cells in the presence or absence of a PPARγ antibody as described under “Experimental procedures”. A 100-fold excess of unlabeled probe for W or M incubated with RSG-treated extracts and the free probe were used as controls. The vertical bracket indicates the position of the shift and the arrow indicates the position of the supershifted band. B. The PPRE-4 and PPRE-2 probes and mutants described in ‘A’ were incubated with activated BSC cell extracts in the presence or absence of a PPARβ antibody. Vertical brackets indicate the shift position and the arrow indicates the negative supershift.
Binding and functional effect of PPARβ on MAT2A in in vivo and in vitro activated HSCs
PPARβ exhibited enhanced binding to PPREs 1, 2, 4, and 6 in activated HSCs from BDL livers compared to their quiescent counterparts from sham controls (Figs. 7A & & 7B). PPARβ showed strong interaction with PPRE-5 in quiescent HSCs and this binding was not enhanced further during HSC activation (Figs. 7A and 7B). Knockdown of PPARβ in activated BSC cells (Fig. 7C & 7D, left panel) and primary rat HSCs (Fig. 7C & 7D, right panel) lowered the expression of both MAT2A mRNA and protein by 1.6 to 2-fold. This also inhibited MAT2A promoter activity by 2-fold compared to a negative control siRNA in activated BSC cells (Fig. 7E). These results showed that in activated HSCs, PPARβ promoted MAT2A transcription.
Fig. 7. Binding and functional effect of PPARβ on MAT2A in HSCs.

A. Chromatin extracted from HSCs isolated from BDL livers and sham control was immunoprecipitated with a PPARβ antibody as described under “Experimental procedures”. Input genomic DNA (Input) was used as the loading control and immunoprecipitation with an antibody against GFP was used as a negative control. Representative agarose gel images from three HSC preparations in duplicates are shown. *P<0.005, **p<0.05 vs. sham. B. Genomic DNA from immunoprecipitated chromatin described in ‘A’ was quantitated by ChIP real-time PCR as described under “Experimental procedures”. The differential target site occupancy of PPARβ on MAT2A was normalized to input genomic DNA and expressed as fold over control. Results represent mean ± S.E. from three HSC preparations in duplicates. *P<0.005, **p<0.05 vs. sham. C. BSC cells (left panel) or culture-activated primary rat HSCs (right panel) were transfected with a PPARβ siRNA or a negative control siRNA as described under “Experimental procedures”. By real-time RT-PCR, the expression of MAT2A and PPARβ in knockdown cells was compared to that of negative control siRNA. Results represent mean ± S.E. from five experiments in duplicates (BSC cells) or four HSC preparations in duplicates. *p<0.005 vs. negative control siRNA. D. Cells were treated as in ‘C’ and total cellular protein was subjected to western blotting with antibodies against MAT2A or PPARβ. Representative images and densitometric analysis (mean ± S.E.) from four to five experiments of BSC cells (left panel) or four HSC preparations (right panel) in duplicates is shown. *P<0.005, **p<0.05 vs. negative control siRNA. E. PPARβ knockdown was performed in BSC cells followed by transfection with the rat MAT2A promoter or pGL3-basic as described under “Experimental procedures”. The luciferase activity in PPARβ knockdown cells was normalized to that of pGL3-Basic and expressed as a fold over negative control siRNA. Results represent mean ± S.E. from four experiments in triplicates, **p<0.05 vs. negative control siRNA.
Functional effect of MAT2A over-expression on HSC activation after RSG-treatment
Forced expression of MAT2A vector resulted in a 3–4 fold increase of MAT2A protein in RSG-treated cells (Fig. 8A), that is comparable to endogenous expression of MAT2A in activated HSCs (15). This further resulted in a 55–60% decrease in PPARγ and C/EBPβ protein expression (Fig. 8A) as well as a decrease in PPARγ mRNA (Fig. 8B) but not C/EBPβ (data not shown). The protein levels of PPARβ and α-SMA increased by 2–3 fold in MAT2A HSCs compared to vector control (Fig. 8A). A significant increase in α-SMA (Fig. 8B) but not PPARβ mRNA (data not shown) was observed after MAT2A over-expression.
Fig. 8. Effect of MAT2A over-expression on HSC quiescence and activation markers.

A. A pCMV6-rMAT2A construct was transfected into BSC cells treated with RSG as described in “Experimental procedures”. Total protein was subjected to western blotting with antibodies against MAT2A, PPARγ, PPARβ, C/EBPβ or α-SMA. Representative images and densitometric analysis (mean ± S.E.) from four experiments in duplicates is shown. *P<0.005, **p<0.05 vs. empty vector. B. RSG-treated BSC cells were transfected as described in ‘A’ and total RNA was assessed by real-time PCR for the expression of PPARγ and α-SMA. Results represent mean ± S.E. from four experiments in duplicates. *P<0.005, **p<0.05 vs. empty vector.
Effect of modulation of C/EBPβ reserves on MAT2A expression after RSG treatment
Lowering C/EBPβ reserves in RSG-treated BSC cells by siRNA resulted in a modest 1.3 to 1.4-fold increase in MAT2A mRNA and protein expression (Supplemental Fig. 1A & 1B) and a similar increase in MAT2A promoter activity (Supplemental Fig. 1C). However, over-expression of C/EBPβ in activated cells did not significantly alter MAT2A expression or promoter activity (data not shown).
DISCUSSION
MAT1A and MAT2A genes exhibit differential expression within various cell types of the liver. Hepatocytes mainly express MAT1A, Kupffer cells and endothelial cells express MAT1A with trace amounts of MAT2A whereas normal HSCs exclusively express MAT2A (14). Despite the predominant expression of MAT1A in the differentiated liver, the small percentage of quiescent HSCs utilizes MAT2A rather than MAT1A for SAMe biosynthesis (14). In rapidly dividing and de-differentiated liver, a significant induction of MAT2A has been observed along with silencing of the MAT1A gene (9, 10, 20).
It is intriguing that the pattern of MAT expression in HSCs from adult, differentiated liver resembles that of actively growing hepatocytes, which have high MAT2A and low MAT1A expression. In light of these facts, it is logical to hypothesize that MAT2A would be tightly regulated in quiescent HSCs. Preliminary support for this hypothesis has come from recent work in which we show that MAT2A is rapidly induced during HSC activation and silencing this gene inhibits activation (15). In the current study, we have sought to identify the molecular mechanisms responsible for the control of the MAT2A gene in quiescent and activated HSCs both in vitro and in vivo.
We identified six potential PPRE elements in the rat MAT2A promoter. The MAT2A PPREs are the so called imperfect PPRE sequences that have also been characterized in other genes (4). They do not show a complete match to the consensus sequence for a typical DR1 element but do contain highly conserved half sites that qualify as functional PPREs (25).
Out of the known PPAR subtypes, PPARγ is known to promote HSC quiescence and its expression and activity is significantly reduced during HSC activation (2, 6). This led us to first examine whether PPARγ was involved in regulating MAT2A in HSCs. The rat BSC cell line exhibits the characteristics of an activated HSC and has greatly reduced PPARγ expression (16). This cell line can be switched to quiescent state by treatment with RSG, a specific PPARγ agonist that induces its expression in these cells. RSG treatment inhibited MAT2A expression, suppressed the activity of the MAT2A promoter, and induced the ChIP binding of PPARγ to all the MAT2A PPRE sites except PPRE-3. The lack of binding with PPRE-3 correlated with the low matrix similarity score (<0.8) of this element from PPRE prediction analysis (22). MAT2A promoter activity was also inhibited after RSG treatment of cultured primary rat HSCs. Our in vivo findings showed reduced binding of PPARγ to MAT2A PPREs in activated HSCs from BDL livers compared to quiescent HSCs from sham controls. Therefore, a switch from quiescence to activation that lowers PPARγ activity (2, 16), also inhibits its binding to the MAT2A promoter. On the other hand, the transition from activation to quiescence allows PPARγ to bind to MAT2A PPREs and inhibit transcriptional activity. It is known that RSG as well as other PPARγ agonists such as prostaglandin J2 have both PPARγ-dependent and independent effects in cell types such as macrophages and hepatic myofibroblasts (26, 27). Therefore, to ascertain whether the effects of RSG on MAT2A were a consequence of PPARγ activity, we used the gene silencing and over-expression approach. Indeed, silencing PPARγ in quiescent BSC cells enhanced MAT2A expression and transcriptional activity whereas over-expression of PPARγ had exactly the opposite effect. These results directly demonstrate that in quiescent HSCs, PPARγ plays an essential role in the negative control of MAT2A transcription and loss of PPARγ in activated HSCs is one of the mechanisms responsible for MAT2A induction. Since MAT2A is clearly associated with HSCs in their activated state (15), its negative regulation by PPARγ may be an important mechanism used by HSCs to maintain their normal, quiescent state.
PPARγ activation by RSG inhibited the activity of the wild type MAT2A promoter and individual mutations in the PPRE sites reversed the inhibitory effect of RSG. Furthermore, wild type PPRE-4 and PPRE-2 sequences, but not the mutated counterparts, exhibited strong binding to PPARγ after RSG-mediated activation. Although the binding of PPARγ to individual PPREs was strong, the effect on transactivation was less dramatic because the effect of PPARγ on full-length, wild type MAT2A promoter is a cumulative effect of all PPRE elements that may vary in the efficiency with which they repress MAT2A. PPRE deletion analysis identified PPRE-2 and 4 as the most potent mediators of PPARγ repression of the basal MAT2A promoter devoid of any PPREs. Other PPREs 1, 5 and 6 were also responsive but less dramatic compared to PPREs 2 and 4. Moreover, apart from PPARγ, there are other DNA elements and positive and negative transcription factors that may regulate MAT2A in activated and quiescent HSCs. As explained further, we identified one of these factors during mutation studies. Interestingly, mutating the PPRE sites led to a reduction in the basal activity of the MAT2A promoter in activated BSC cells that lack PPARγ. Hence, this effect of the PPRE mutations on MAT2A transcription was clearly independent of PPARγ. Deletion analysis further showed that individual PPREs enhanced basal activity of MAT2A in activated HSCs devoid of PPARγ. This unexpected result led us to believe that some positive regulatory factors were able to interact with the same PPRE regions during HSC activation and mutating these sites abolished their binding, thereby inhibiting MAT2A promoter activity in BSC cells. It is known that different subtypes of PPARs can bind to the same PPRE element in a gene (28). Therefore, we suspected that the MAT2A PPREs might be involved in interactions with other PPAR subtypes, especially those that are associated with HSC activation. The PPARβ protein emerged as a likely candidate because it is the only subtype that is markedly up-regulated in activated HSCs (3). We showed that PPARβ could bind to wild type MAT2A PPRE-4 and 2 probes but not to the mutated elements, in activated BSC cells. The EMSA binding was stronger with PPRE-2 compared to PPRE-4 and mutations of PPRE-2 had more suppressive effects on MAT2A promoter activity compared to PPRE-4 mutations. Furthermore, interaction of PPARβ with MAT2A PPREs was low in quiescent HSCs from sham control livers but was dramatically induced in activated HSCs from BDL livers. Despite a high basal level of PPARβ expression in quiescent HSCs (3), this protein bound poorly to the MAT2A promoter in quiescent cells as opposed to activated HSCs. We attributed this low binding to the predominance of PPARγ occupancy on the MAT2A PPREs in quiescent cells which might have made these sites less accessible for PPARβ interaction. During HSC activation, the disappearance of PPARγ and the concomitant induction of PPARβ shift the balance and there is increased PPARβ interaction with the MAT2A PPRE sites.
The functional significance of PPARβ binding to the MAT2A promoter was examined by silencing this gene in BSC cells. Knockdown of PPARβ clearly inhibited MAT2A expression as well as transcriptional activity. In culture-activated primary rat HSCs that exhibit an induction of PPARβ (3), silencing this gene inhibited MAT2A expression. This analysis established that PPARβ is a positive regulator of the MAT2A gene during HSC activation.
Forced expression of MAT2A in RSG-treated cells reverses the quiescent state of HSCs by lowering the expression of PPARγ and concomitantly inducing PPARβ and the activation marker, α-SMA. These findings imply a reciprocal regulation between PPARs and MAT2A during quiescence and activation. Our previous work has shown that MAT2A knockdown reduces HSC activation and the over-expression findings support the silencing data (15). Forced expression of MAT2A also lowered C/EBPβ protein levels but we did not see a significant modulation of MAT2A when C/EBPβ reserves were altered. Hence, in quiescent and activated HSCs, PPARs appear to be the major modulators of MAT2A transcription and MAT2A de-regulates PPARs and other proteins during HSC activation.
In summary, we have unraveled an important mechanism of transcriptional regulation of the MAT2A gene by two PPAR proteins that occupy the same binding site on the MAT2A promoter. In quiescent HSCs, the PPARγ subtype acts as a negative regulator of MAT2A transcription During HSC activation, a dramatic reduction in PPARγ expression and activity releases the inhibitory tone that this transcription factor exerts on MAT2A and allows positive regulators like PPARβ to bind to the MAT2A PPRE and induce the expression of this gene. MAT2A is the only SAMe-synthesizing enzyme in HSCs and is a strong determinant of HSC activation and proliferation. Therefore multiple levels of control of this gene may exist in HSCs apart from those described in this work. Identifying other novel factors that control MAT2A both transcriptionally and post-transcriptionally in HSCs, is a subject of future investigation.
Supplementary Material
Acknowledgments
Financial and other support: This work was supported by the National Institute of Health grant 5K99AA017774-02 (Komal Ramani). Maria Lauda Tomasi is a recipient of the F32 training grant from NIH (F32AA201502). We acknowledge the NIAAA-supported Non-parenchymal Liver Cell Core (R24 AA012885) for providing isolation and culture of hepatic stellate cells. Our sincere thanks to Dr. Shelly Lu for her expert advice and guidance.
Abbreviations
- HSC
hepatic stellate cell
- α-SMA
alpha-smooth muscle actin
- PPAR
peroxisome proliferator-activated receptor
- PPRE
PPAR response element
- BDL
bile duct ligation
- RSG
rosiglitazone
- C/EBP
CCAAT-enhancer-binding protein
- MAT
methionine adenosyltransferase
- SAMe
S-adenosylmethionine
- Adv
adenovirus
- b2A
basal MAT2A promoter
Contributor Information
Komal Ramani, Email: kramani@usc.edu.
Maria Lauda Tomasi, Email: tomasi@usc.edu.
References
- 1.Maher JJ, McGuire RF. Extracellular Matrix Gene Expression Increases Preferentially in Rat Lipocytes and Sinusoidal Endothelial Cells during Hepatic Fibrosis In Vivo. J Clin Invest. 1990;86:1641–1648. doi: 10.1172/JCI114886. [DOI] [PMC free article] [PubMed] [Google Scholar]
- 2.Miyahara T, Schrum L, Rippe R, Xiong S, Yee HF, Motumora K, et al. Peroxisome Proliferator-activated Receptors and Hepatic Stellate Cell Activation. J Biol Chem. 2000;275:35715–35722. doi: 10.1074/jbc.M006577200. [DOI] [PubMed] [Google Scholar]
- 3.Hellemans K, Michalik L, Dittié A, Knorr A, Rombouts K, De Jong J, et al. Peroxisome proliferator-activated receptor-beta signaling contributes to enhanced proliferation of hepatic stellate cells. Gastroenterology. 2003;124:184–201. doi: 10.1053/gast.2003.50015. [DOI] [PubMed] [Google Scholar]
- 4.Hellemans K, Rombouts K, Quartier E, Dittié AS, Knorr A, Michalik L, et al. PPARbeta regulates vitamin A metabolism-related gene expression in hepatic stellate cells undergoing activation. J Lipid Res. 2003;44:280–95. doi: 10.1194/jlr.M200376-JLR200. [DOI] [PubMed] [Google Scholar]
- 5.Sato T, Sato M, Miura M, Higashi N, Wang DR, Suzuki S, et al. Expression of the Peroxisome Proliferator-Activated Receptors (PPARs) in the Hepatic Stellate Cells. Comparative Hepatology. 2004;3(Suppl 1):S17. doi: 10.1186/1476-5926-2-S1-S17. [DOI] [PMC free article] [PubMed] [Google Scholar]
- 6.Hazra S, Xiong S, Wang J, Rippe RA, Krishna V, Chatterjee K, et al. Peroxisome proliferator-activated receptor gamma induces a phenotypic switch from activated to quiescent hepatic stellate cells. J Biol Chem. 2004;279:11392–11401. doi: 10.1074/jbc.M310284200. [DOI] [PubMed] [Google Scholar]
- 7.Guo YT, Leng XS, Li T, Peng JR, Song SH, Xiong LF, et al. Effect of ligand of peroxisome proliferator-activated receptor gamma on the biological characters of hepatic stellate cells. World Journal of Gastroenterology. 2005;11:4735–4739. doi: 10.3748/wjg.v11.i30.4735. [DOI] [PMC free article] [PubMed] [Google Scholar]
- 8.Cheng JH, She H, Han YP, Wang J, Xiong S, Asahina K, et al. Wnt antagonism inhibits hepatic stellate cell activation and liver fibrosis. Am J Physiol Gastrointest Liver Physiol. 2008;294:G39–49. doi: 10.1152/ajpgi.00263.2007. [DOI] [PubMed] [Google Scholar]
- 9.Ramani K, Mato JM, Lu SC. Role of Methionine Adenosyltransferase Genes in Hepatocarcinogenesis. Cancers. 2011;3:1480–1497. doi: 10.3390/cancers3021480. [DOI] [PMC free article] [PubMed] [Google Scholar]
- 10.Mato JM, Lu SC. Role of S-adenosyl-L-methionine in liver health and injury. Hepatology. 2007;45:1306–1312. doi: 10.1002/hep.21650. [DOI] [PubMed] [Google Scholar]
- 11.Kotb M, Mudd SH, Mato JM, Geller AM, Kredich NM, Chou JY, et al. Consensus nomenclature for the mammalian methionine adenosyltransferase genes and gene product. Trends Genet. 1997;13:51–52. doi: 10.1016/s0168-9525(97)01013-5. [DOI] [PubMed] [Google Scholar]
- 12.Halim AB, LeGros L, Geller A, Kotb M. Expression and functional interaction of the catalytic and regulatory subunits of human methionine adenosyltransferase in mammalian cells. J Biol Chem. 1999;274:29720–29725. doi: 10.1074/jbc.274.42.29720. [DOI] [PubMed] [Google Scholar]
- 13.Martínez-Chantar ML, García-Trevijano ER, Latasa MU, Martín-Duce A, Fortes P, Caballería J, et al. Methionine adenosyltransferase IIB subunit gene expression provides a proliferative advantage in human hepatoma. Gastroenterology. 2003;124:940–948. doi: 10.1053/gast.2003.50151. [DOI] [PubMed] [Google Scholar]
- 14.Shimizu-Saito K, Horikawa S, Kojima N, Shiga J, Senoo H, Tsukada K. Differential expression of S-adenosylmethionine synthetase isozymes in different cell types of rat liver. Hepatology. 1997;26:424–443. doi: 10.1002/hep.510260224. [DOI] [PubMed] [Google Scholar]
- 15.Ramani K, Yang H, Kuhlenkamp J, Tomasi L, Tsukamoto H, Mato JM, et al. Changes in the Expression of Methionine Adenosyltransferase Genes and S-adenosylmethionine Homeostasis during Hepatic Stellate Cell Activation. Hepatology. 2010;51:986–995. doi: 10.1002/hep.23411. [DOI] [PMC free article] [PubMed] [Google Scholar]
- 16.Tsukamoto H, Horne W, Kamimura S, Niemelä O, Parkkila S, Ylä-Herttuala S, et al. Experimental liver cirrhosis induced by alcohol and iron. J Clin Invest. 1995;96:620–30. doi: 10.1172/JCI118077. [DOI] [PMC free article] [PubMed] [Google Scholar]
- 17.Sung CK, She H, Xiong S, Tsukamoto H. Tumor necrosis factor-alpha inhibits peroxisome proliferator-activated receptor gamma activity at a posttranslational level in hepatic stellate cells. Am J Physiol Gastrointest Liver Physiol. 2004;286:G722–G729. doi: 10.1152/ajpgi.00411.2003. [DOI] [PubMed] [Google Scholar]
- 18.Yu J, Zhang S, Chu ES, Go MY, Lau RH, Zhao J, et al. Peroxisome proliferator-activated receptors gamma reverses hepatic nutritional fibrosis in mice and suppresses activation of hepatic stellate cells in vitro. Int J Biochem Cell Biol. 2010;42:948–57. doi: 10.1016/j.biocel.2010.02.006. [DOI] [PubMed] [Google Scholar]
- 19.Hiroki T, Horikawa S, Tsukada K. Structure of the rat methionine adenosyltransferase 2A gene and its promoter. Eur J Biochem. 1997;250:653–660. doi: 10.1111/j.1432-1033.1997.00653.x. [DOI] [PubMed] [Google Scholar]
- 20.Ramani K, Yang H, Xia M, Ara AI, Mato JM, Lu SC. Leptin’s mitogenic effect in human liver cancer cells requires induction of both methionine adenosyltransferase 2A and 2beta. Hepatology. 2008;47:521–531. doi: 10.1002/hep.22064. [DOI] [PMC free article] [PubMed] [Google Scholar]
- 21.Schug J. Using TESS to predict transcription factor binding sites in DNA sequence. Current Protocols in Bioinformatics. 2008;Chapter 2(Unit 2.6) doi: 10.1002/0471250953.bi0206s21. [DOI] [PubMed] [Google Scholar]
- 22.Quandt K, Frech K, Karas H, Wingender E, Werner T. MatInd and MatInspector: new fast and versatile tools for detection of consensus matches in nucleotide sequence data. Nucleic Acids Res. 1995;23:4878–4884. doi: 10.1093/nar/23.23.4878. [DOI] [PMC free article] [PubMed] [Google Scholar]
- 23.Lehmann JM, Moore LB, Smith-Oliver TA, Wilkison WO, Willson TM, Kliewer SA. An antidiabetic thiazolidinedione is a high affinity ligand for peroxisome proliferator-activated receptor gamma (PPAR gamma) J Biol Chem. 1995;270:12953–12956. doi: 10.1074/jbc.270.22.12953. [DOI] [PubMed] [Google Scholar]
- 24.Wagner N, Jehl-Piétri C, Lopez P, Murdaca J, Giordano C, Schwartz C. Peroxisome proliferator-activated receptor beta stimulation induces rapid cardiac growth and angiogenesis via direct activation of calcineurin. Cardiovasc Res. 2009;83:61–71. doi: 10.1093/cvr/cvp106. [DOI] [PubMed] [Google Scholar]
- 25.IJpenberg A, Jeannin E, Wahli W, Desvergne B. Polarity and specific sequence requirements of peroxisome proliferator-activated receptor (PPAR)/retinoid X receptor heterodimer binding to DNA. A functional analysis of the malic enzyme gene PPAR response element. J Biol Chem. 1997;272:20108–20117. doi: 10.1074/jbc.272.32.20108. [DOI] [PubMed] [Google Scholar]
- 26.Chawla A, Barak Y, Nagy L, Liao D, Tontonoz P, Evans RM. PPAR-gamma dependent and independent effects on macrophage-gene expression in lipid metabolism and inflammation. Nat Med. 2001;7:48–52. doi: 10.1038/83336. [DOI] [PubMed] [Google Scholar]
- 27.Li L, Tao J, Davaille J, Feral C, Mallat A, Rieusset J, et al. 15-deoxy-Delta 12,14-prostaglandin J2 induces apoptosis of human hepatic myofibroblasts. A pathway involving oxidative stress independently of peroxisome-proliferator-activated receptors. J Biol Chem. 2001;276:38152–8. doi: 10.1074/jbc.M101980200. [DOI] [PubMed] [Google Scholar]
- 28.Tachibana K, Kobayashi Y, Tanaka T, Tagami M, Sugiyama A, Katayama T, et al. Nuclear Receptor. 2005;3:3. doi: 10.1186/1478-1336-3-3. [DOI] [PMC free article] [PubMed] [Google Scholar]
Associated Data
This section collects any data citations, data availability statements, or supplementary materials included in this article.