Abstract
Background
To evaluate racial cancer disparities in Georgia (GA) by calculating and comparing mortality-to-incidence ratios (MIR) by health district and in relation to geographical factors.
Methods
Data sources included: cancer incidence (GA Comprehensive Cancer Registry), cancer mortality (GA Vital Records), and health factor (County Health Rankings) data. Age-adjusted incidence and mortality rates were calculated by cancer site (all sites combined, lung, colorectal, prostate, breast, oral, and cervical) for 2003–2007. MIRs and 95% confidence intervals were calculated overall and by district for each cancer site, race, and gender. MIRs were mapped by district and compared to geographic health factors.
Results
186,419 incident cases and 71,533 deaths were identified. Blacks had higher MIRs than Whites for every cancer site evaluated, with especially large differentials observed for prostate, cervical, and oral cancer in men. Large geographic disparities were detected, with larger MIRs, chiefly among Blacks, in GA as compared to national data. The highest MIRs were detected in west and east central GA; the lowest MIRs were detected in and around Atlanta. Districts with better health behavior, clinical care, and social/economic factors had lower MIRs, especially among Whites.
Conclusion
More fatal cancers, particularly prostate, cervical, and oral cancer in men were detected among Blacks, especially in central GA, where health behavior and social/economic factors were worse. MIRs are an efficient indicator of survival and provide insight into racial cancer disparities. Additional examination of geographical determinants of cancer fatality in GA as indicated by MIRs is warranted.
Keywords: neoplasms, health status disparities, minority health, Georgia, geographic factors
Introduction
Racial disparities in cancer incidence and mortality are often large and may result from complex causes. Mortality rates from many common cancers are higher among Blacks as compared to any other racial/ethnic group.1, 2 For all cancer sites combined in the United States, the mortality rate among Blacks is 25 percent higher than among Whites.3 Incidence also is higher among Blacks, although not for all cancer sites; and racial differences in incidence tend to be smaller than mortality differentials. Blacks are diagnosed with more aggressive tumors and tend to present at younger ages; facts that help explain why the racial gap in mortality from cancer is so large. Racial cancer disparities are especially prominent in the Southeast;4, 5 however, explanations remain unclear.
Calculation of the mortality-to-incidence ratio (MIR) provides a unique quantification of racial cancer mortality disparities. Given complete and reliable incidence and mortality data, the MIR is a valid6 indicator of the fatality ratio.6–8 The MIR approximates a standard, population-based measure of fatality (1/survival), given incidence.4 Most have used MIRs to quantitatively evaluate the completeness and validity of cancer registration,7–9 to evaluate the effectiveness of secondary prevention methods,10 or to estimate incidence or mortality when direct data are unavailable.11–13 Few studies have used the MIR to compare cancer rates.4, 14–16
Recently, Hébert et al., used MIRs to compare cancer fatality by race in South Carolina (SC).4 They were the first to map MIRs, which allowed them to highlight geographies where mortality disparities may be particularly pronounced.4 Georgia (GA), like SC, has large racial cancer disparities. Despite the presence of a Surveillance Epidemiology and End Results (SEER)-affiliated cancer registry with valid and complete data and a large proportion of Black residents that enables statistically stable comparisons across racial subgroups, there is a paucity of published research describing cancer throughout GA.
Deriving inspiration from the work of Hébert et al., the purpose of this study was to evaluate racial cancer disparities in GA by calculating and comparing MIRs for a variety of cancer sites. We calculated MIRs for all cancer sites combined, and for lung and bronchus, colorectal, prostate, female breast, oral cavity, and cervical cancers by race, sex, and GA public health district. This study also assessed the geographic pattern of MIRs overall and in relation to spatial variables including environmental characteristics, socioeconomic factors, and health care accessibility.
Methods
Data Sources
Cancer incidence data were obtained from the GA Comprehensive Cancer Registry (GCCR) for 2003–2007. The GCCR is a statewide population-based cancer registry that collects information on all cancer cases diagnosed among GA residents. The GCCR is a participant in the National Program for Cancer Registries and the North American Association of Central Cancer Registries (NAACCR). The GCCR meets national standards for cancer registration and is gold certified for data quality and representativeness. Each cancer case was associated with a county-level geographic identifier, demographic, and tumor characteristics. Cancer sites were selected using the SEER Site Groups Primary Site variable based on ICD-0-3 coding.17
Cancer mortality data from GA Vital Records in the GA Department of Public Health’s standardized health data repository were obtained through the GCCR. Each cancer death was associated with a county-level geographic identifier and demographic characteristics. Cancer deaths for specific cancer site subgroups were identified via the ICD-10 code for underlying cause of death.
Incidence and mortality data were obtained for all cancer sites combined and for lung and bronchus, colorectal, prostate, female breast, oral cavity, and cervical cancers; and were obtained by race (White, Black) and gender, when applicable. Incident cases and deaths were excluded if they were of unknown or ‘other’ race or gender. Only malignant tumors were included. Ethnicity was not used because the mortality data did not contain reliable ethnicity information. To avoid unstable statistical calculations, incidence and mortality data were aggregated to the public health district level (N=18). All analyses were performed for the state of GA or by health district.
Age-specific GA population data for 2003–2007 were obtained from the National Center for Health Statistics bridged population estimates. Health factor data were obtained from the County Health Rankings 2011 data portal,18 which synthesizes health data from national data sources including the Behavioral Risk Factor Surveillance System, National Center for Health Statistics, and the CDC Environmental Protection Agency Collaboration, among others.
Statistical Analysis
Age-adjusted mortality and incidence rates were calculated using direct standardization for GA, public health district, and race/gender subgroups.19 The 2000 United States standard million population was used. Rates were not calculated for cancer sites with fewer than 20 cases per health district. The MIR, a measure of mortality that adjusts for underlying differences in incidence, was calculated as the age-adjusted mortality rate divided by the age-adjusted incidence rate. MIRs were calculated overall and by health district for each cancer site and for race/gender subgroups. Rates and MIRs were generated using Microsoft Excel (2007) and SAS version 9.1.3 (SAS Institute, Cary, NC). We modeled the statistical analysis approach used by Hébert et al.4 in our neighboring state, SC, so that direct comparisons to their findings could be made.
Special methods previously used for MIRs were implemented to calculate 95% confidence intervals (CI) using F intervals.20 These F intervals, which approximate directly standardized rate intervals, are useful for scenarios in which some data cells are sparse (e.g., districts with few cases) while others are large (e.g., districts with many cases). The resulting CI’s guarantee nominal coverage, yet provide conservative estimates.20 CI’s were generated using R software version 2.12.1 (The R Foundation for Statistical Computing, Vienna, Austria).
A geographic information system (ArcMAP® software version 10.0, ESRI, Redlands, CA) was used to map MIRs for each cancer site by GA health district. For comparison to national rates, display cut-points introduced by Hébert et al. were used. Four categories were defined for each cancer site - Category 1: the mean MIR for Whites nationally; Category 2: the upper bound 10% higher than the upper bound of Category 1; Category 3: the upper bound 20% higher than the upper bound of Category 1; and Category 4: the upper bound >20% higher than the upper bound of Category 1.4 The data for the computation of Category 1 were obtained from the North American Association of Central Cancer Registries’ Cancer in North America: 2003–2007 report.17
To explore potential geographic risk factors of cancer fatality, MIRs were compared to health factor groupings by health district. Health factors were represented by data metrics, chosen and weighted based on their relative importance while considering data reliability and availability. Specifically, we used data for four health factors including health behaviors, a composite measure of tobacco use (adult smoking rate, 10%), diet and exercise (adult obesity rate, 10%), alcohol use (excessive drinking, 2.5%; motor vehicle crash death rate, 2.5%), and unsafe sex (sexually transmitted infection rate, 2.5%; teen birth rate, 2.5%); clinical care, a composite measure of access to care (adult uninsured rate, 5%; primary care providers, 5%) and quality of care (hospitalization rates for ambulatory-sensitive conditions, 5%; diabetic screening rate, 2.5%; mammography screening rate, 2.5%); social/economic factors, a composite measure of education (high school graduation rate, 5%; adults with college degrees, 5%), employment (unemployment rate, 10%), income (children in poverty, 10%), family and social support (social and emotional support, 2.5%; single-parent households, 2.5%), and community safety (violent crime or homicide rate, 5%); and physical environment, a composite measure of environmental quality (unhealthy air quality due to particulate matter, 2.5%; unhealthy air quality due to ozone, 2.5%) and built environment (access to healthy foods, 2.5%; access to recreational facilities, 2.5%). The County Health Rankings, which were created around the model of the United Health Foundation’s Annual State Health Rankings, were originally developed to use publicly available data to describe variation in population health measures for community health assessment in Wisconsin.21 The Mobilizing Action Toward Community Health (MATCH) project was initiated with funding from the Robert Wood Johnson Foundation and expanded Wisconsin’s County Health Rankings in 2010 to the entire country.22 These rankings provide a concrete picture of overall community health and a simple method for communities to describe and track progress.23 As part of the Rankings metric, health determinants are described using measures that are chosen based on certain criteria including, “being a direct or proxy measure of important aspects of public health, available publicly and updated periodically at the county level, consistently collected across counties, and of sufficient quantity to have moderately stable county-level estimates”.24
County-level Z-scores (i.e., standardized measures of each health measure relative to other GA counties) for each health factor were averaged to obtain an overall Z-score for each health district. A positive average Z-score indicated an average value higher (i.e., ‘greater risk’ for worse health outcomes) than the average of all GA counties; a negative average Z-score indicated an average value lower (i.e., ‘lower risk’ for worse health outcomes) than the average of all GA counties. For each health factor, correlations of Z-scores to MIRs at the health district-level were calculated. Pearson correlation coefficients and one-sided p-values were calculated for each cancer site by race and gender. Maps of the health factor groupings by health district were generated.
Results
A total of 186,419 incident cancers (all sites) were identified. Incident cases were excluded if they were of unknown or ‘other’ race/gender (N=2,987, 2%). Only tumors with malignant behavior were included in the analysis (thus 3,300 cases, or 2% with in situ behavior were excluded). A total of 71,533 cancer deaths from all cancer sites were identified. Deaths were excluded if they were of unknown or ‘other’ race (N=602, 1%). All deaths were male or female.
Table 1 displays the MIRs and 95% CI’s for all cancer sites combined, female breast, cervix, colorectal, lung and bronchus, oral cavity, and prostate cancers by race and gender. As expected, when considering all cancer sites combined, White females had the lowest MIRs (0.37) and Black men had the highest (0.47) (Table 1). MIRs were larger (i.e., cancers were more fatal) among Blacks for each and every cancer site and gender combination as compared to Whites. These differences were statistically significant for all groups except for lung and bronchus cancer in both genders and oral cancer among women (Table 1). As in SC,4 the largest racial differences were for oral cancer among men (Black MIR 1.81 times greater than White MIR), prostate (Black MIR 1.55 times greater than White MIR), and cervical cancer (Black MIR 1.52 times greater than White MIR). MIRs among males were larger than among females. Among all the cancer sites, lung cancer was the most fatal (MIRs ranging from 0.72 to 0.83) and prostate cancer was the least fatal (MIRs ranging from 0.16 to 0.24) (Table 1).
Table 1.
Georgia mortality-to-incidence ratios and 95% confidence intervals for all cancer sites combined and specified cancer sites by race and gender, 2003–2007.
| Cancer Site | Blacks | Whites | |||
|---|---|---|---|---|---|
| Gender Subgroup | MIR | 95% CI | MIR | 95% CI | Black:White Ratio† |
| All Sites Combined | |||||
| Overall* | 0.450 | 0.442, 0.459 | 0.401 | 0.396, 0.405 | 1.122 |
| Women* | 0.443 | 0.432, 0.455 | 0.373 | 0.368, 0.379 | 1.188 |
| Men* | 0.471 | 0.458, 0.483 | 0.432 | 0.426, 0.439 | 1.090 |
| Men:Women Ratio | 1.063 | - | 1.158 | - | - |
| Female Breast | |||||
| Women* | 0.255 | 0.242, 0.269 | 0.181 | 0.175, 0.188 | 1.408 |
| Cervix | |||||
| Women* | 0.423 | 0.362, 0.492 | 0.279 | 0.247, 0.315 | 1.516 |
| Colon & Rectum | |||||
| Overall* | 0.407 | 0.386, 0.430 | 0.343 | 0.331, 0.355 | 1.187 |
| Women* | 0.397 | 0.369, 0.427 | 0.339 | 0.322, 0.356 | 1.171 |
| Men* | 0.426 | 0.391, 0.463 | 0.352 | 0.335, 0.370 | 1.210 |
| Men:Women Ratio | 1.073 | - | 1.038 | - | - |
| Lung & Bronchus | |||||
| Overall | 0.793 | 0.761, 0.826 | 0.770 | 0.754, 0.785 | 1.029 |
| Women | 0.749 | 0.701, 0.799 | 0.721 | 0.699, 0.744 | 1.038 |
| Men | 0.827 | 0.783, 0.873 | 0.812 | 0.790, 0.834 | 1.018 |
| Men:Women Ratio | 1.104 | - | 1.126 | - | - |
| Oral Cavity | |||||
| Overall* | 0.333 | 0.291, 0.380 | 0.213 | 0.197, 0.230 | 1.563 |
| Women | 0.225 | 0.172, 0.292 | 0.215 | 0.187, 0.248 | 1.047 |
| Men* | 0.398 | 0.337, 0.469 | 0.220 | 0.199, 0.243 | 1.809 |
| Men:Women Ratio | 1.769 | - | 1.023 | - | - |
| Prostate | |||||
| Men* | 0.242 | 0.228, 0.256 | 0.156 | 0.149, 0.163 | 1.551 |
MIR: mortality-to-incidence ratio; CI: confidence interval.
Statistically significant difference for MIRs between Blacks and Whites based on non-overlapping 95% CIs.
MIR among Blacks divided by the MIR among Whites.
We compared GA MIR calculations to those computed for SC.4 SC had higher MIRs among Blacks for all cancer sites except cervical cancer, where the MIR in GA was equivalent (0.42 versus 0.41). Among Whites, MIRs were strikingly similar for all cancer sites combined, breast, cervical, and colorectal cancers for SC and GA. MIRs for lung, oral, and prostate cancers among Whites were lower in GA than SC.
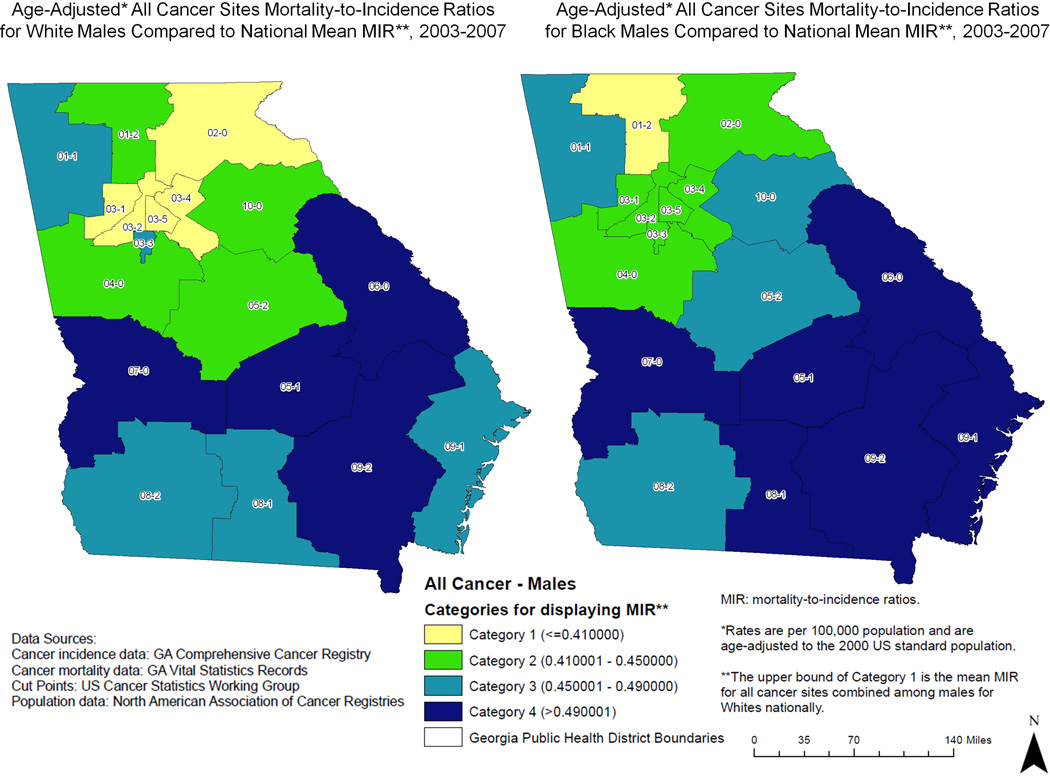
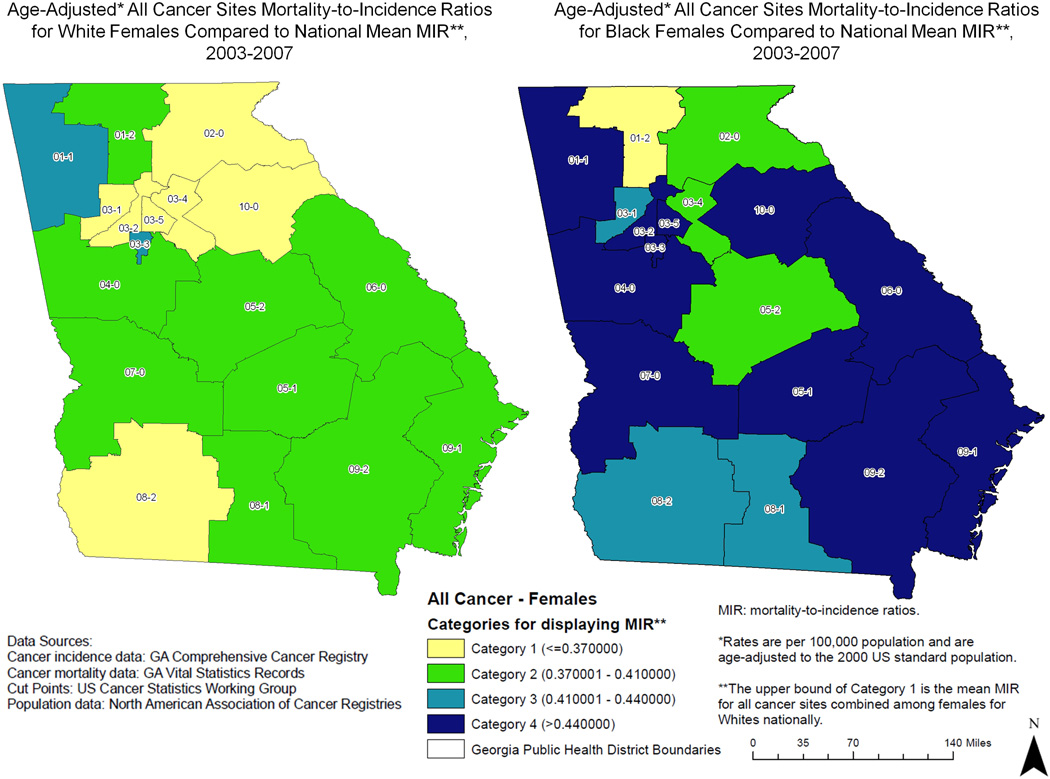
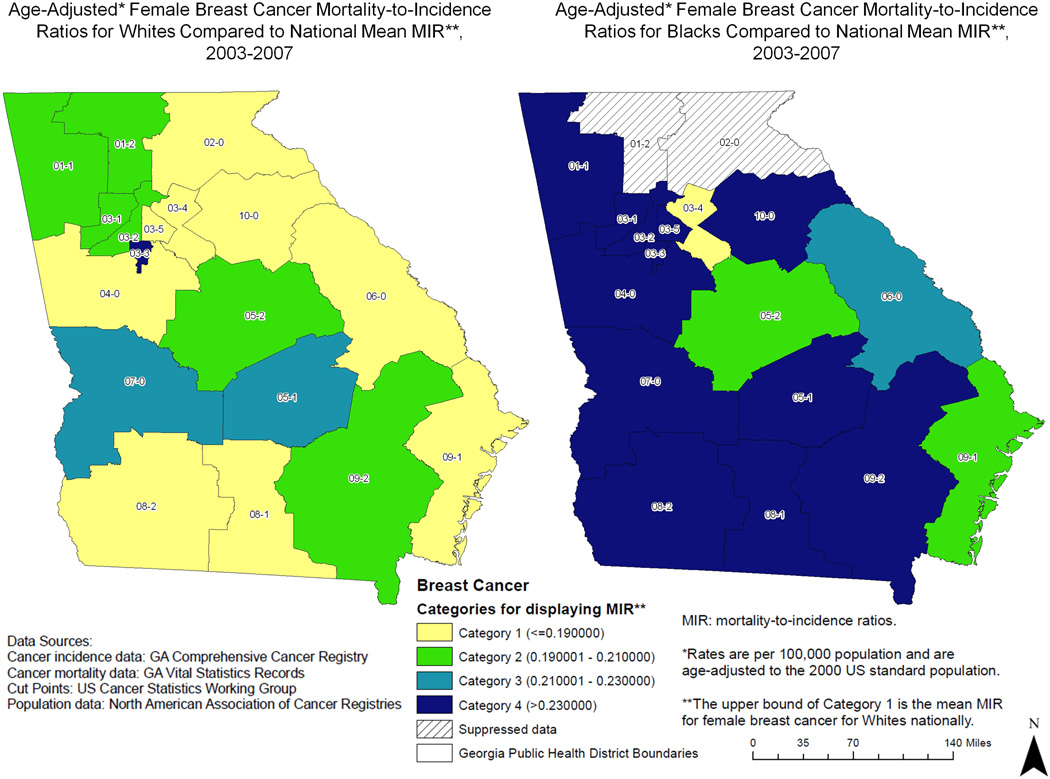
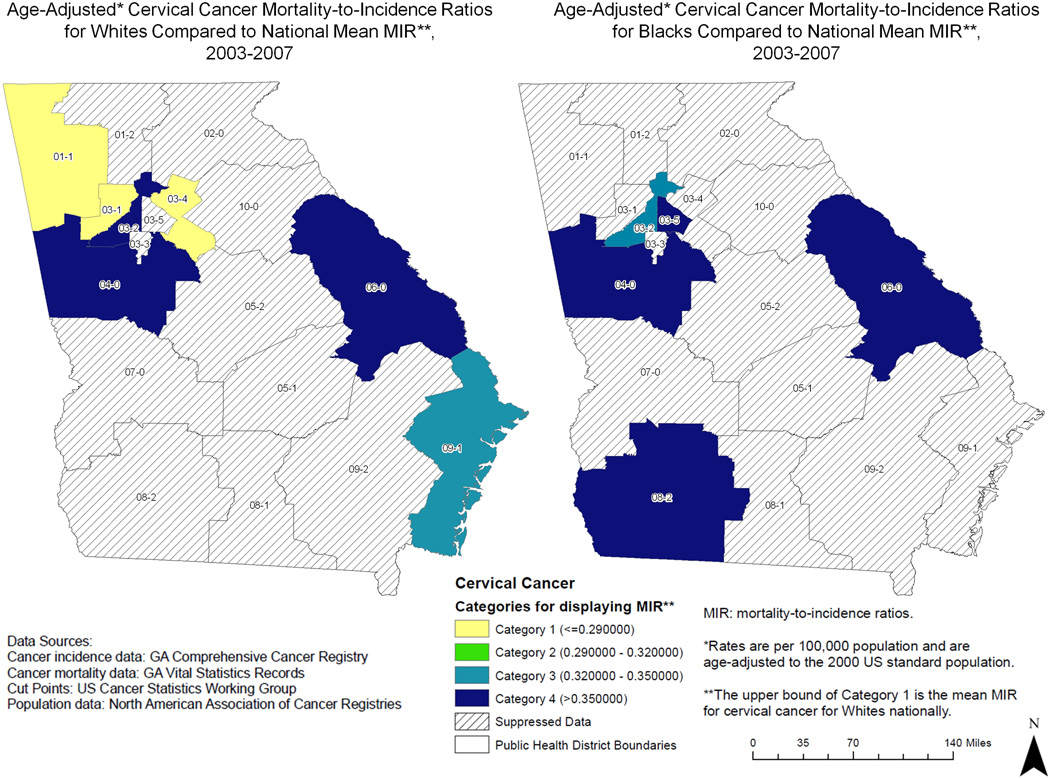
Figures 1–7 display the MIRs by GA health district and race using display cut-points that compare MIRs against national values for Whites. MIRs were higher in GA, chiefly among Blacks, as compared to national data. For all cancer sites combined among males (Figure 1A), the highest MIRs were observed in Southeast GA, with more Category 4 (i.e., >20% higher than mean MIR for Whites nationally) districts among Black males (6 versus 4). For all cancer sites combined among females (Figure 1B), the MIRs between races were remarkably different, with a one-category difference in every district and a two-category difference in most districts for Blacks throughout the state. Large differences in MIRs also were observed by race for breast cancer (Figure 2). Five districts had a three-category difference from Category 1 (comparable to the mean MIR for Whites nationally) among Whites to Category 4 among Blacks. Many of the districts have suppressed data for cervical cancer; however, it should be noted that all of the districts highlighted among Black women were in the two highest MIR categories (Figure 3).
Figure 1.
Figure 1A. Mortality-to-incidence (MIR) ratios by Georgia public health district for all cancer sites combined in males.
Figure 1B. Mortality-to-incidence (MIR) ratios by Georgia public health district for all cancer sites combined in females.
Figure 7.
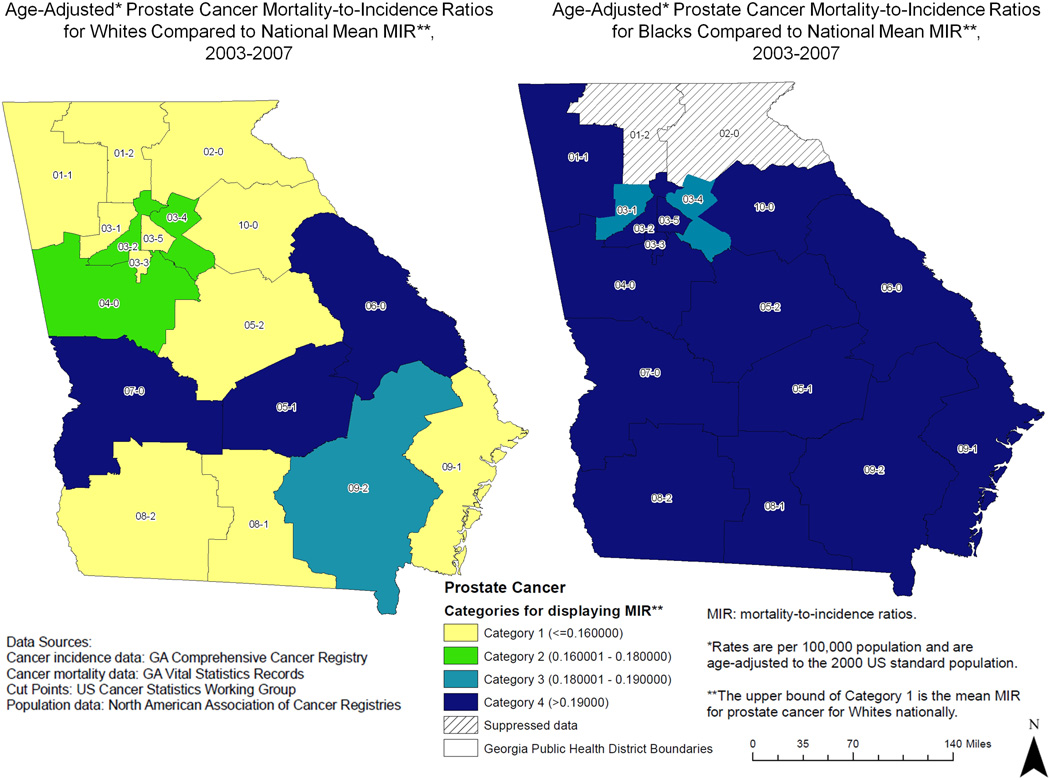
Mortality-to-incidence (MIR) ratios by Georgia public health district for prostate cancer.
Figure 2.
Mortality-to-incidence (MIR) ratios by Georgia public health district for female breast cancer.
Figure 3.
Mortality-to-incidence (MIR) ratios by Georgia public health district for cervical cancer.
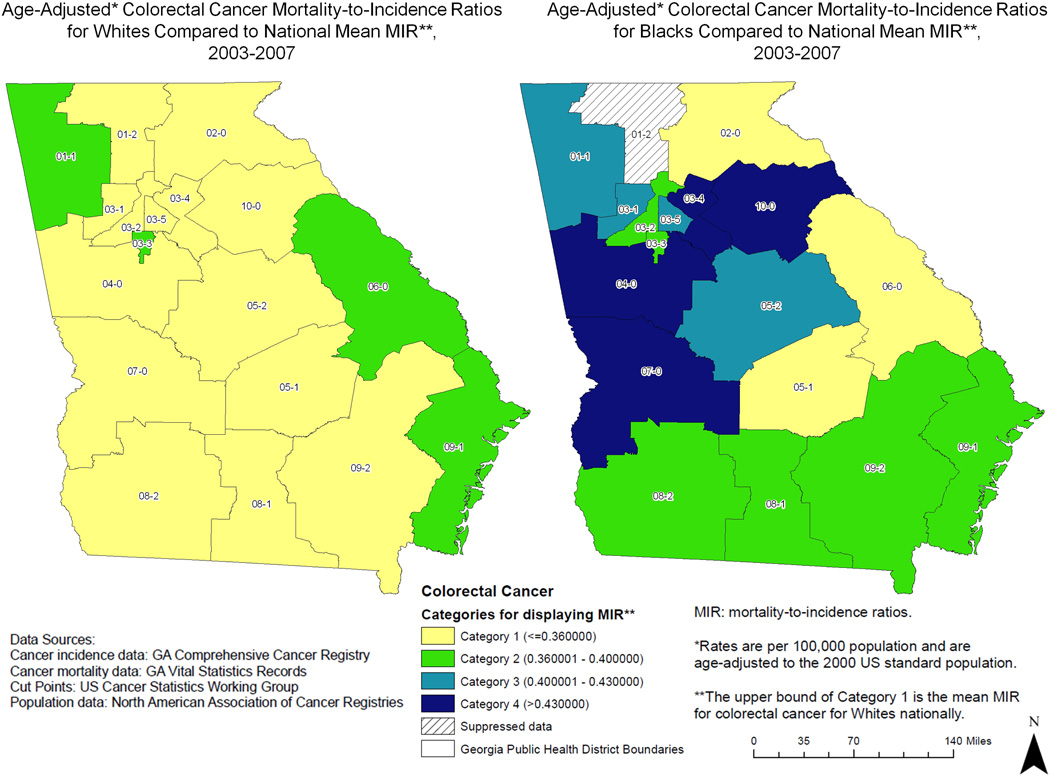
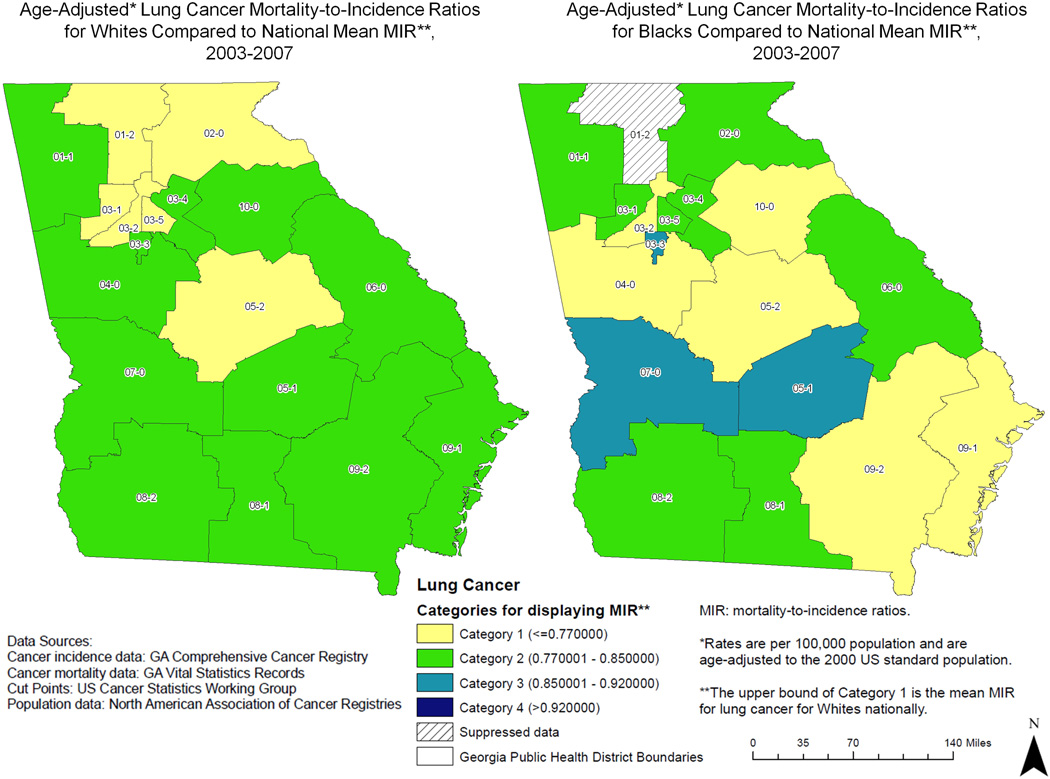
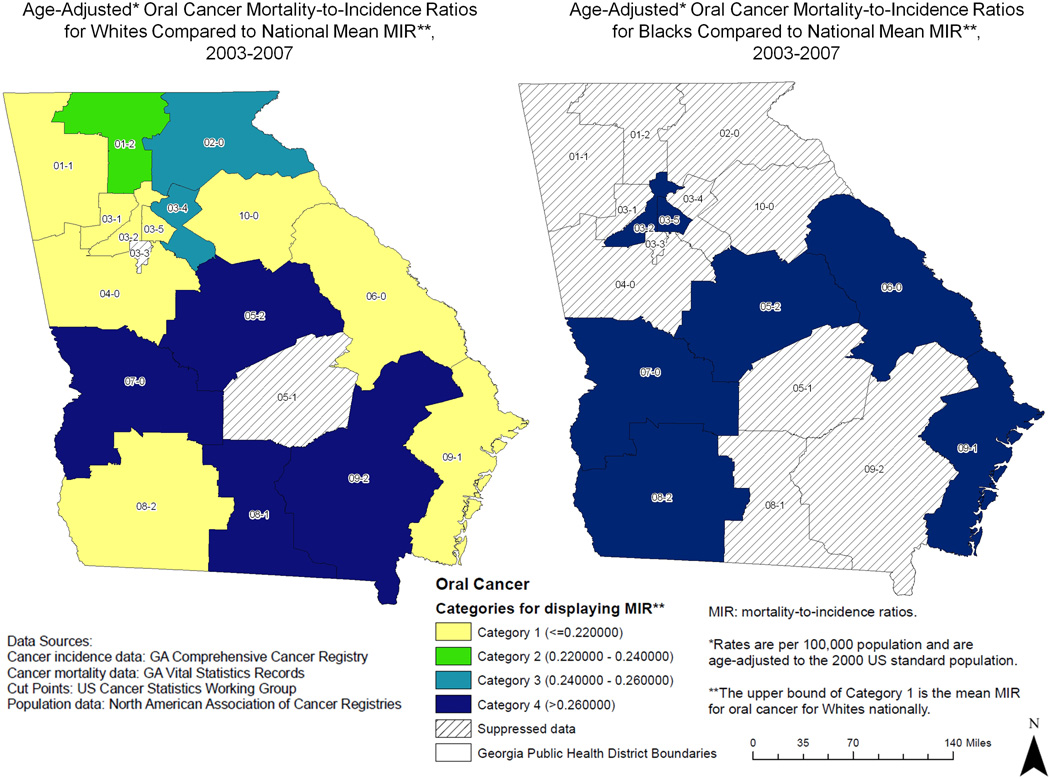
For colorectal cancer, high MIRs were detected in Midwest GA with all but three districts having higher MIRs for Blacks and four districts with a three-category difference for Blacks compared to Whites (Figure 4). Racial differences in MIRs were less drastic for lung cancer (Figure 5) and eight districts had MIRs in a higher category for Blacks versus Whites. For oral cancer, all of the available districts were in MIR Category 4 (Figure 6). Finally, for prostate cancer, the majority of GA was in Category 4 for Blacks with a three-category difference in eight districts for Blacks versus Whites (Figure 7). Across all maps, the districts with the most Category 4 MIRs were the West Central Health District 7-0 (9 appearances in Category 4; 6 Black, 3 White) and the East Central Health District 6-0 (8 appearances in Category 4; 5 Black, 3 White). Conversely, the districts with the most Category 1 MIRs were the Cobb Douglas Health District 3-1 (7 appearances in Category 1; 7 White), the Fulton Health District 3-2 (7 appearances in Category 1; 2 Black, 5 White), and the Dekalb Health District 3-5 (7 appearances in Category 1; 7 White).
Figure 4.
Mortality-to-incidence (MIR) ratios by Georgia public health district for colorectal cancer.
Figure 5.
Mortality-to-incidence (MIR) ratios by Georgia public health district for all lung cancer.
Figure 6.
Mortality-to-incidence (MIR) ratios by Georgia public health district for oral cancer.
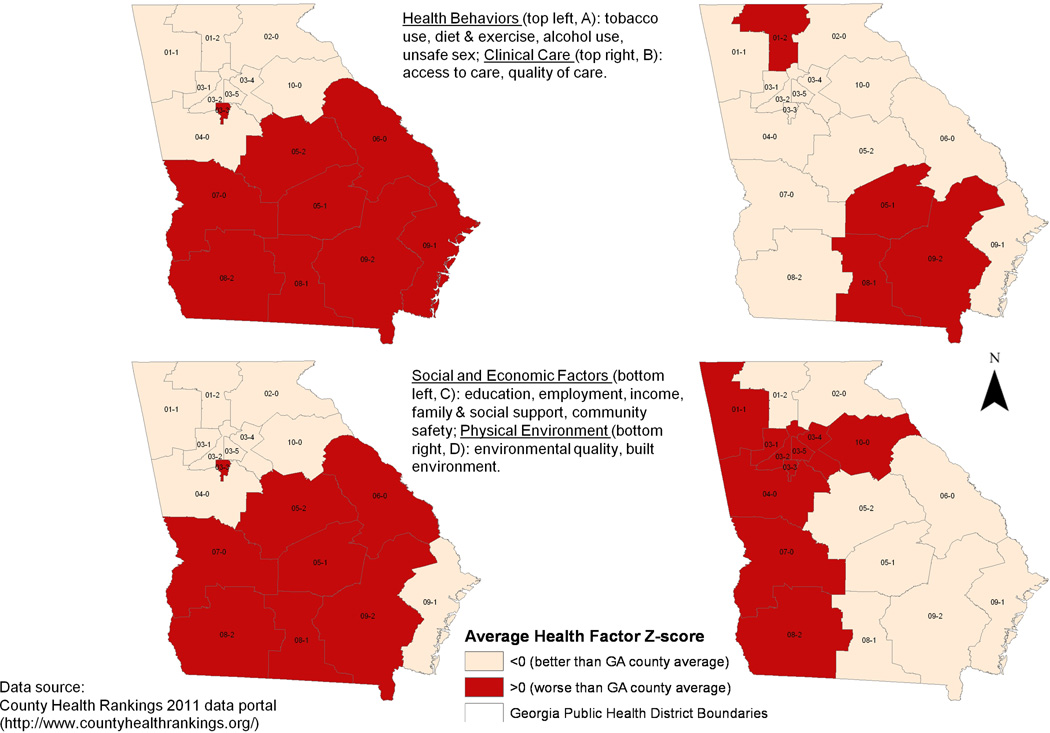
Table 2 displays the correlations between health district MIRs and health factor groupings. Expectations were that higher average Z-scores (i.e., health districts at a ‘higher risk’ for worse health outcomes) would be positively correlated with higher average MIRs (i.e., health districts with more fatal cancers). Correlations with moderate (ρ: 0.30–0.70) to strong (ρ: 0.70–1.00) coefficients and statistically significant (p<0.05) p-values were detected between increasing Z-scores for health behavior (5 cancer/race/gender subgroup combinations with strong correlations (ρ≥0.70 and p<0.05); 3 with moderate correlations (ρ: 0.30–0.70 and p<0.05)), clinical care (2 strong; 6 moderate), and social/economic factors (11 moderate) and increasing MIRs, especially among Whites for all cancer sites combined and lung cancer. Overall, the most (11 of 30 cancer/race/gender subgroups) positive, statistically significant correlations were observed between social/economic factor Z-scores and MIRs (Table 2). Z-scores for physical environment were most weakly correlated with increases in MIRs. The health districts highlighted for health behavior and social/economic factors were almost identical, and the physical environment groupings were the most dissimilar (Figure 8). Five health districts, all in southwest and south central GA (07-0, 05-2, 05-1, 08-1, and 09-2) had poor rankings for three of four health factors (Figure 8). As noted above, the West Central Health District 7-0 also had the most Category 4 MIRs for both races. No health district was ranked poorly for all health factors.
Table 2.
Correlation coefficients between health district health factor groupings and average health district MIRs for all cancer sites combined and specified cancer sites by race and gender, 2003–2007.
| Cancer Site | Blacks | Whites | ||||
|---|---|---|---|---|---|---|
| Gender Subgroup | N | ρ | p-value* | N | ρ | p-value |
| Health Behavior | ||||||
| All Sites Combined | ||||||
| Overall | 18 | 0.463 | 0.03 | 18 | 0.860 | <0.0001 |
| Women | 18 | 0.287 | 0.13 | 18 | 0.713 | <0.0001 |
| Men | 18 | 0.548 | 0.01 | 18 | 0.864 | <0.0001 |
| Female Breast | ||||||
| Women | 16 | 0.010 | 0.49 | 18 | 0.151 | 0.28 |
| Cervix | ||||||
| Women | 5 | 0.443 | 0.23 | 7 | −0.058 | 0.55 |
| Colon & Rectum | ||||||
| Overall | 17 | −0.224 | 0.81 | 18 | 0.311 | 0.11 |
| Women | 15 | −0.398 | 0.93 | 18 | 0.082 | 0.38 |
| Men | 14 | 0.060 | 0.42 | 18 | 0.311 | 0.11 |
| Lung & Bronchus | ||||||
| Overall | 17 | 0.394 | 0.06 | 18 | 0.708 | <0.0001 |
| Women | 16 | −0.282 | 0.86 | 18 | 0.259 | 0.15 |
| Men | 17 | −0.156 | 0.73 | 18 | 0.805 | <0.0001 |
| Oral Cavity | ||||||
| Overall | 7 | 0.423 | 0.17 | 16 | 0.326 | 0.11 |
| Women | 0 | - | - | 5 | 0.074 | 0.46 |
| Men | 4 | 0.709 | 0.15 | 14 | 0.198 | 0.25 |
| Prostate | ||||||
| Men | 16 | 0.477 | 0.03 | 18 | 0.251 | 0.16 |
| Clinical Care | ||||||
| All Sites Combined | ||||||
| Overall | 18 | 0.355 | 0.08 | 18 | 0.715 | <0.0001 |
| Women | 18 | 0.172 | 0.25 | 18 | 0.580 | 0.005 |
| Men | 18 | 0.479 | 0.02 | 18 | 0.718 | <0.0001 |
| Female Breast | ||||||
| Women | 16 | 0.284 | 0.15 | 18 | 0.103 | 0.35 |
| Cervix | ||||||
| Women | 5 | 0.158 | 0.40 | 7 | −0.236 | 0.70 |
| Colon & Rectum | ||||||
| Overall | 17 | −0.320 | 0.90 | 18 | −0.093 | 0.65 |
| Women | 15 | −0.458 | 0.96 | 18 | −0.303 | 0.89 |
| Men | 14 | 0.242 | 0.21 | 18 | 0.109 | 0.34 |
| Lung & Bronchus | ||||||
| Overall | 17 | 0.121 | 0.32 | 18 | 0.461 | 0.03 |
| Women | 16 | −0.551 | 0.99 | 18 | 0.144 | 0.29 |
| Men | 17 | 0.032 | 0.45 | 18 | 0.489 | 0.02 |
| Oral Cavity | ||||||
| Overall | 7 | 0.552 | 0.10 | 16 | 0.481 | 0.03 |
| Women | 0 | - | - | 5 | 0.180 | 0.39 |
| Men | 4 | 0.734 | 0.14 | 14 | 0.169 | 0.28 |
| Prostate | ||||||
| Men | 16 | 0.579 | 0.01 | 18 | 0.239 | 0.17 |
| Social and Economic Factors | ||||||
| All Sites Combined | ||||||
| Overall | 18 | 0.581 | 0.005 | 18 | 0.647 | 0.002 |
| Women | 18 | 0.425 | 0.04 | 18 | 0.498 | 0.02 |
| Men | 18 | 0.635 | 0.003 | 18 | 0.676 | 0.001 |
| Female Breast | ||||||
| Women | 16 | 0.268 | 0.16 | 18 | 0.353 | 0.08 |
| Cervix | ||||||
| Women | 5 | 0.350 | 0.28 | 7 | 0.682 | 0.05 |
| Colon & Rectum | ||||||
| Overall | 17 | −0.301 | 0.88 | 18 | 0.292 | 0.12 |
| Women | 15 | −0.492 | 0.97 | 18 | 0.123 | 0.32 |
| Men | 14 | −0.143 | 0.69 | 18 | 0.230 | 0.18 |
| Lung & Bronchus | ||||||
| Overall | 17 | 0.467 | 0.03 | 18 | 0.672 | 0.001 |
| Women | 16 | 0.107 | 0.35 | 18 | 0.397 | 0.05 |
| Men | 17 | −0.231 | 0.82 | 18 | 0.618 | 0.005 |
| Oral Cavity | ||||||
| Overall | 7 | 0.147 | 0.38 | 16 | 0.350 | 0.09 |
| Women | 0 | - | - | 5 | −0.492 | 0.80 |
| Men | 4 | 0.516 | 0.24 | 14 | 0.392 | 0.09 |
| Prostate | ||||||
| Men | 16 | 0.553 | 0.02 | 18 | 0.467 | 0.03 |
| Physical Environment | ||||||
| All Sites Combined | ||||||
| Overall | 18 | −0.265 | 0.86 | 18 | −0.445 | 0.97 |
| Women | 18 | 0.018 | 0.47 | 18 | −0.422 | 0.96 |
| Men | 18 | −0.449 | 0.97 | 18 | −0.414 | 0.96 |
| Female Breast | ||||||
| Women | 16 | 0.184 | 0.25 | 18 | 0.246 | 0.16 |
| Cervix | ||||||
| Women | 5 | 0.183 | 0.39 | 7 | −0.290 | 0.74 |
| Colon & Rectum | ||||||
| Overall | 17 | 0.366 | 0.08 | 18 | −0.169 | 0.75 |
| Women | 15 | 0.126 | 0.33 | 18 | 0.019 | 0.47 |
| Men | 14 | 0.272 | 0.18 | 18 | −0.172 | 0.75 |
| Lung & Bronchus | ||||||
| Overall | 17 | 0.159 | 0.27 | 18 | −0.218 | 0.81 |
| Women | 16 | 0.379 | 0.08 | 18 | −0.072 | 0.61 |
| Men | 17 | −0.276 | 0.86 | 18 | −0.183 | 0.77 |
| Oral Cavity | ||||||
| Overall | 7 | −0.710 | 0.97 | 16 | −0.235 | 0.81 |
| Women | 0 | - | - | 5 | −0.090 | 0.56 |
| Men | 4 | −0.983 | 0.99 | 14 | 0.031 | 0.46 |
| Prostate | ||||||
| Men | 16 | −0.694 | 0.99 | 18 | −0.231 | 0.82 |
N: Number of health districts (out of 18) included in analysis.
ρ: Pearson correlation coefficient.
One-sided.
Figure 8.
Average health factor measure by Georgia public health district.
Discussion
This study described racial cancer mortality disparities and their potential geographical determinants by calculating, comparing, and mapping MIRs throughout GA. Blacks in GA had more fatal cancers than Whites for all evaluated cancer sites. Although this observation has been made for the nation2 and GA,5 the use of MIRs in this study allowed an efficient description of these disparities in cancer mortality using pre-existing data, while standardizing for incidence. This standardization is especially important for racial cancer disparities, as Blacks are diagnosed more frequently and with more aggressive tumors than Whites.
MIRs provide an efficient and accurate indication of cancer fatality that has previously been unreported for GA. This is meaningful when describing racial disparities in cancer outcomes, as cancer originating at different anatomical sites may present differently in terms of aggressiveness. In contrast to simply mapping mortality (or incidence) rates, calculating and mapping MIRs, especially by race, allows a broader and perhaps more complete depiction of the survival experience.
The MIR differential is an indicator of a difference in mortality in excess of what one would predict based on incidence alone. For prostate cancer, for example, the MIR for Blacks in this study was 1.6 times the MIR for Whites. This is the amount of excess mortality among Blacks controlling for the fact that Blacks have a higher incidence than Whites. This observation demonstrates that even controlling for the fact that Blacks get more cancer than Whites, they still have a disproportionately large mortality burden. Using MIRs to assist in quantifying this difference is an essential first step and highlights where efforts need to be focused, an important task given limited resources.
Higher MIRs were observed among Blacks in SC as compared to Blacks in GA. MIRs among Whites were comparable. The main exceptions were for cervical cancer, where GA had similar MIRs to SC among Blacks. Compared to SC, GA had lower MIRs for lung, oral, and prostate cancers among Whites. A large difference was observed for cervical cancer in GA, for which the MIR among Blacks was 1.52 times the MIR among Whites. This difference is similar to that observed for SC (Black MIR 1.50 times higher).4 This mortality difference is alarming because Black women are more likely to receive Pap tests than White women. Racial differences in cervical cancer screening follow-up or lack of culturally- and linguistically-specific educational messages about cervical cancer and the meaning of abnormal Pap test results may be contributing to this disparity25, 26 and interventions, educational materials and/or programs should be targeted in GA based on these findings. In addition, Hispanic women in GA have higher incidence rates of cervical cancer (14.1/100,000) as compared to national rates (12.5/100,000).27 This may be one reason that higher MIRs were detected for cervical cancer in GA, but we were unable to examine the issue directly because ethnicity data were not evaluable. However, based on the incidence data, 0.8% of Black women and 2.5% of White women were classified as Hispanic. Inclusion of this small percentage is unlikely to meaningful alter our results and, in fact, the larger percentage of potential misclassification was among White, not Black women, in whom the larger MIR was detected. This suggests that GA is performing slightly better in terms of cancer outcomes as compared to SC, except for cervical cancer, where efforts should be focused.
When compared to national data, GA had higher MIRs for each and every cancer site examined. Overall, the worst outcomes were detected in the West and East Central health districts. Identification of districts with large disparities provides support for the development of area- and population-specific health programs and/or focused research studies with the aim of better describing etiologic mechanisms behind these disparities. The best outcomes were detected in the Atlanta area in Cobb-Douglas, Dekalb, and Fulton health districts. When compared to health factors, which rank counties based on health behaviors, clinical care, and social/economic factors,18 there appeared to be a relationship between the overall health of the county and MIRs. We chose to further examine the geographic relationship of MIRs at the health district-level by comparing MIRs by health factors from this same data repository. We found that districts whose population had worse health behavior, worse clinical care choices and access, and worse social/economic factors tended to have higher MIRs when compared to those health districts whose population ranked better in these factors. For all cancer sites combined, higher MIRs (i.e., more fatal cancers) were strongly associated with worse health behavior, worse clinical care (overall and among men), and moderately associated with a worse social/economic environment and worse clinical care among women. Similar relationships were detected for lung cancer and, to a smaller extent, prostate cancer. Although this does not imply causality, these relationships may warrant further investigation or may suggest opportunities for health behavior interventions, such as tobacco cessation for lung cancer, and/or screening programs, such as community-based education about screening practices or treatment decisions28 among Blacks for prostate cancer. In general, this trend was more apparent among Whites, suggesting that other factors are at work among Blacks in terms of cancer outcomes. A more detailed examination of geographical risk factors related to MIR disparities is certainly warranted, but this analysis serves as a starting point for developing more specific and testable hypotheses to further explain and eventually mitigate these disparities.
The County Health Rankings system used to describe geographic health risk factors in relation to MIRs is not without limitation. Because the Rankings were not designed to be a statistically robust measure of community health24 and individual metrics may have questionable reliability because of sparse data,18 these Rankings should not be used as the statistical basis for assessing policy change or priority settings nor should small rank-order changes be over interpreted.23 However, a thorough process supported the choice of measures and weights, including literature reviews of the impact of factors and health outcomes, the ability for factors to be modified through community action, a review of America’s Health Rankings methodology, the availability and reliability of indicators at the county-level, and feedback from an expert panel.18 When considered in summary, the County Health Ranking system provides a high-quality picture of overall community health18 and can be used to generate hypotheses about possible drivers of racial disparities, as done in the current study.
Because direct age-adjustment was performed and GA has a large number of counties (N=159), public health districts (N=18) were used to describe the geographic pattern of MIRs throughout GA, while ensuring a sufficient sample size for the calculation of stable rates. The GCCR suppresses rate calculations where cell counts are less than 20. Therefore, rates for more rare cancer sites (e.g., cervical, oral) were considered unstable and suppressed based on this criterion. Although this may have limited our ability to see patterns for these cancer sites throughout the entire state, this conservative approach ensured that the calculated rates were stable and reliable.
The MIR is an efficient indicator of fatality (or survival). Despite its utility, most studies have generated the MIR for other purposes, particularly to validate cancer registration,7, 8, 29 and only a few4, 14–16 have used the MIR to compare cancer rates across populations. Given appropriate mortality and incidence data, an MIR can be easily calculated and avoids the limitations of traditional survival studies, which require active follow-up and potential financial and logistical constraints.6 Cancer registry data in GA is thorough, with a completeness meeting the NAACCR gold standard (95% completion) overall and by racial subgroup (completeness for Whites: 106%; completeness for Blacks: 99%). Not only is the MIR an efficient way to calculate and compare survival, a recent study confirmed that the measure provides a valid approximation of the 5-year survival rate for most tumor sites.6
In summary, this study used MIRs to describe racial cancer mortality disparities in GA. Larger MIRs were detected for Blacks compared to Whites for all cancer sites and gender subgroups, with the largest racial differentials detected for prostate, cervical, and oral cancer in men. More fatal cancers were detected in west and east-central GA; less fatal cancers were detected in and around Atlanta. When compared to national MIRs, geographic differentials were detected with GA having drastically larger MIRs for each and every cancer site examined. Better health behavior, clinical care characteristics, and social/economic factors were correlated with lower MIRs, especially among Whites. MIRs are an efficient indicator of survival and are useful in describing racial cancer disparities. Additional examination of geographical determinants of cancer fatality in GA as indicated by these MIRs is warranted.
The consistency of our findings with the gender and racial disparities in SC suggest that there are many fundamental issues contributing to differentials in survival that need to be investigated further and addressed. Our analysis highlights regional patterns in racial disparities in cancer mortality that encourages additional research collaborations and evaluation of potential regional-specific determinants. Targeted race- and geographic-specific prevention, treatment, and follow-up practices are needed to address the observed differences in MIRs.
Acknowledgments
Funding Sources: Dr. Wagner is funded by a grant from the Georgia Cancer Coalition, (Proposal 038505). Dr. Hébert is supported by an Established Investigator Award in Cancer Prevention and Control from the Cancer Training Branch of the National Cancer Institute (K05 CA136975).
Footnotes
Financial Disclosures: none
References
- 1.Kohler BA, Ward E, McCarthy BJ, Schymura MJ, Ries LAG, Eheman C, et al. Report to the Nation on the status of cancer, 1975–2007, featuring tumors of the brain and other nervous system. JNCI. 2011 doi: 10.1093/jnci/djr077. [DOI] [PMC free article] [PubMed] [Google Scholar]
- 2.Ward E, Jemal A, Cokkinides V, Singh GK, Cardinez C, Ghafoor A, et al. Cancer disparities by race/ethnicity and socioeconomic status. CA Cancer J Clin. 2004;54(2):78–93. doi: 10.3322/canjclin.54.2.78. Available from http://www.ncbi.nlm.nih.gov/entrez/query.fcgi?cmd=Retrieve&db=PubMed&dopt=Citation&list_uids=15061598. [DOI] [PubMed] [Google Scholar]
- 3.[NCI] [Accessed July 19 2011];National Cancer Institute, Cancer health disparities. http://www.cancer.gov/cancertopics/factsheet/disparities/cancer-health-disparities.
- 4.Hebert JR, Daguise VG, Hurley DM, Wilkerson RC, Mosley CM, Adams SA, et al. Mapping cancer mortality-to-incidence ratios to illustrate racial and sex disparities in a high-risk population. Cancer. 2009:2539–2552. doi: 10.1002/cncr.24270. [DOI] [PMC free article] [PubMed] [Google Scholar]
- 5.Singh S, Bayakly AR, McNamara C, Redding K, Thompson SK, Wall K Georgia Cancer Data Report, 2005. Southeast Division. 2006. Georgia Department of Human Resources, Divisions of Public Health, Chronic Disease, Injury, and Envrionmental Epidemiology Section, and the American Cancer Society. Publication Number: DPH06/007HW. [Google Scholar]
- 6.Vostakolaei FA, Karim-Kos HE, Janssen-Heijnen MLG, Visser O, Verbeek AL, Kiemeney LALM. The validity of the mortality to incidence ratio as a proxy for site-specific cancer survival. The European Journal of Public Health. 2010 doi: 10.1093/eurpub/ckq120. [DOI] [PubMed] [Google Scholar]
- 7.Parkin DM, Bray F. Evaluation of data quality in the cancer registry: principles and methods Part: II. Completeness. Eur J Cancer. 2009;45(5):756–764. doi: 10.1016/j.ejca.2008.11.033. Available from http://www.ncbi.nlm.nih.gov/entrez/query.fcgi?cmd=Retrieve&db=PubMed&dopt=Citation&list_uids=19128954. [DOI] [PubMed] [Google Scholar]
- 8.Gajalakshmi CK, Shanta V, Rama R. Registration of cancer mortality data in a developing area: Chennai (Madras, India) experience. Cancer Causes Control. 1998;9(2):131–136. doi: 10.1023/a:1008822008788. Available from http://www.ncbi.nlm.nih.gov/entrez/query.fcgi?cmd=Retrieve&db=PubMed&dopt=Citation&list_uids=9578289. [DOI] [PubMed] [Google Scholar]
- 9.Chen WQ, Zhang SW, Zou XN, Zhao P. Cancer incidence and mortality in China 2006. Chinese Journal of Cancer Research. 2006;23(1):3–9. doi: 10.1007/s11670-011-0003-9. [DOI] [PMC free article] [PubMed] [Google Scholar]
- 10.Taylor RJ, Morrell SL, Mamoon HA, Wain GV. Effects of screening on cervical cancer incidence and mortality in New South Wales implied by influences of period of diagnosis and birth cohort. J Epidemiol Community Health. 2001;55(11):782–788. doi: 10.1136/jech.55.11.782. Available from http://www.ncbi.nlm.nih.gov/entrez/query.fcgi?cmd=Retrieve&db=PubMed&dopt=Citation&list_uids=11604432. [DOI] [PMC free article] [PubMed] [Google Scholar]
- 11.Ferlay J, Autier P, Boniol M, Heanue M, Colombet M, Boyle P. Estimates of the cancer incidence and mortality in Europe in 2006. Ann Oncol. 2007;18(3):581–592. doi: 10.1093/annonc/mdl498. Available from http://www.ncbi.nlm.nih.gov/entrez/query.fcgi?cmd=Retrieve&db=PubMed&dopt=Citation&list_uids=17287242. [DOI] [PubMed] [Google Scholar]
- 12.Woo PP, Thach TQ, Choy ST, McGhee SM, Leung GM. Modelling the impact of population-based cytologic screening on cervical cancer incidence and mortality in Hong Kong: an age--period--cohort approach. Br J Cancer. 2005;93(9):1077–1083. doi: 10.1038/sj.bjc.6602805. Available from http://www.ncbi.nlm.nih.gov/entrez/query.fcgi?cmd=Retrieve&db=PubMed&dopt=Citation&list_uids=16205695. [DOI] [PMC free article] [PubMed] [Google Scholar]
- 13.Pisani P, Parkin DM, Ferlay J. Estimates of the worldwide mortality from eighteen major cancers in 1985. Implications for prevention and projections of future burden. Int J Cancer. 1993;55(6):891–903. doi: 10.1002/ijc.2910550604. Available from http://www.ncbi.nlm.nih.gov/entrez/query.fcgi?cmd=Retrieve&db=PubMed&dopt=Citation&list_uids=8253525. [DOI] [PubMed] [Google Scholar]
- 14.Hsing AW, Tsao L, Devesa SS. International trends and patterns of prostate cancer incidence and mortality. Int J Cancer. 2000;85(1):60–67. doi: 10.1002/(sici)1097-0215(20000101)85:1<60::aid-ijc11>3.0.co;2-b. Available from http://www.ncbi.nlm.nih.gov/entrez/query.fcgi?cmd=Retrieve&db=PubMed&dopt=Citation&list_uids=10585584. [DOI] [PubMed] [Google Scholar]
- 15.Sugerman PB, Savage NW. Oral cancer in Australia 1983–1996. Aust Dent J. 2002;47(1):45–56. doi: 10.1111/j.1834-7819.2002.tb00303.x. Available from http://www.ncbi.nlm.nih.gov/entrez/query.fcgi?cmd=Retrieve&db=PubMed&dopt=Citation&list_uids=12035958. [DOI] [PubMed] [Google Scholar]
- 16.Kamangar F, Dores GM, Anderson WF. Patterns of cancer incidence, mortality, and prevalence across five continents: defining priorities to reduce cancer disparities in different geographic regions of the world. Journal of Clinical Oncology. 2006;24(14):2137–2150. doi: 10.1200/JCO.2005.05.2308. [DOI] [PubMed] [Google Scholar]
- 17.[NAACCR] A publication of the North American Association of Central Cancer Registries, Inc. (NAACCR); 2010. Cancer in North America 2003–2007. [Google Scholar]
- 18. [Accessed July 20, 2011];County Health Rankings. http://www.countyhealthrankings.org/georgia.
- 19.Rothman KJ, Greenland S. Modern Epidemiology. ed. 2nd. Philadephia: Lippincott Williams & Wilkins; 1998. [Google Scholar]
- 20.Fay MP. Approximate confidence itnervals for rate ratios from directly standardized rates with sparse data. Communications in Statistics: Theory and Methods. 1999;28(9):2141–2160. [Google Scholar]
- 21.Peppard PE, Kindig D, Jovaag A, Dranger E, Remington PL. An initial attempt at ranking population health outcomes and determinants. WMJ. 2004;103(3):52–56. Available from http://www.ncbi.nlm.nih.gov/entrez/query.fcgi?cmd=Retrieve&db=PubMed&dopt=Citation&list_uids=15217115. [PubMed] [Google Scholar]
- 22.Kindig DA, Booske BC, Remington PL. Mobilizing Action Toward Community Health (MATCH): metrics, incentives, and partnerships for population health. Prev Chronic Dis. 7(4):A68. Available from http://www.ncbi.nlm.nih.gov/entrez/query.fcgi?cmd=Retrieve&db=PubMed&dopt=Citation&list_uids=20550826. [PMC free article] [PubMed] [Google Scholar]
- 23.Rohan AM, Booske BC, Remington PL. Using the Wisconsin County Health Rankings to catalyze community health improvement. J Public Health Manag Pract. 2009;15(1):24–32. doi: 10.1097/PHH.0b013e3181903bf8. Available from http://www.ncbi.nlm.nih.gov/entrez/query.fcgi?cmd=Retrieve&db=PubMed&dopt=Citation&list_uids=19077591. [DOI] [PubMed] [Google Scholar]
- 24.Peppard PE, Kindig DA, Dranger E, Jovaag A, Remington PL. Ranking community health status to stimulate discussion of local public health issues: the Wisconsin County Health Rankings. Am J Public Health. 2008;98(2):209–212. doi: 10.2105/AJPH.2006.092981. Available from http://www.ncbi.nlm.nih.gov/entrez/query.fcgi?cmd=Retrieve&db=PubMed&dopt=Citation&list_uids=18172156. [DOI] [PMC free article] [PubMed] [Google Scholar]
- 25.Brandt HM, Glover S. Introduction to the special issue cervical cancer in South Carolina: problems and solutions through research, practice, and innovation. J S C Med Assoc. 2009;105:263. [PMC free article] [PubMed] [Google Scholar]
- 26.Savoy J, Hurley DM, Brandt HM, Bolick-Aldrich S, Ehlers M. Cervical cancer in South Carolina: epidemiologic profile. J S C Med Assoc. 2009;105:227. [PubMed] [Google Scholar]
- 27.Berzen AK, McNamara C, Bayakly AR, Redding KC, Slade J Cervical cancer in Georgia 2003–2007. Georgia Department of Community Health, Division of Public Health, Chronic Disease, Healthy Behaviors, and Injury Epidemiology Section. 2010. [Google Scholar]
- 28.Wagner SE, Drake BF, Elder K, Hebert J. Social and clinical predictors of prostate cancer treatment decisions among men in South Carolina. Cancer Causes and Control. 2011 doi: 10.1007/s10552-011-9836-2. [Epub ahead of print]. [DOI] [PMC free article] [PubMed] [Google Scholar]
- 29.Chen JG, Zhu J, Parkin DM, Zhang YH, Lu JH, Zhu YR, et al. Trends in the incidence of cancer in Qidong, China 1978–2002. Int J Cancer. 2006;119(6):1447–1454. doi: 10.1002/ijc.21952. Available from http://www.ncbi.nlm.nih.gov/entrez/query.fcgi?cmd=Retrieve&db=PubMed&dopt=Citation&list_uids=16596645. [DOI] [PubMed] [Google Scholar]


