Abstract
Breast lesion segmentation in magnetic resonance (MR) images is one of the most important parts of clinical diagnostic tools. Pixel classification methods have been frequently used in image segmentation with two supervised and unsupervised approaches up to now. Supervised segmentation methods lead to high accuracy, but they need a large amount of labeled data, which is hard, expensive, and slow to be obtained. On the other hand, unsupervised segmentation methods need no prior knowledge and lead to low performance. However, semi-supervised learning which uses not only a few labeled data, but also a large amount of unlabeled data promises higher accuracy with less effort. In this paper, we propose a new interactive semi-supervised approach to segmentation of suspicious lesions in breast MRI. Using a suitable classifier in this approach has an important role in its performance; in this paper, we present a semi-supervised algorithm improved self-training (IMPST) which is an improved version of self-training method and increase segmentation accuracy. Experimental results show that performance of segmentation in this approach is higher than supervised and unsupervised methods such as K nearest neighbors, Bayesian, Support Vector Machine, and Fuzzy c-Means.
Keywords: Breast lesions segmentation, magnetic resonance imaging, self-training, semi-supervised learning
INTRODUCTION
Breast cancer is one of the common malignant diseases among women in Iran and many other parts of the world. In 2010, the Iran Department of Health has announced that over 7,000 women are diagnosed with this disease and 1400 die of breast cancer every year in Iran. Medical imaging plays a pivotal role in breast cancer care including detection, diagnosis, and treatment monitoring. Currently, mammography is the primary screening modality that is widely used to detect and diagnose breast cancer. Unfortunately, it has some limitations.[1–5] 10-30% breast cancers′ are not detected by mammography and its positive predictive value is less than 35%.[6] Hence, the use of other imaging modality such as magnetic resonance imaging (MRI)[7,8] is increasing and it is used simultaneously as an appropriate scenario with mammography especially for women at high risk. Some studies have shown that MRI is superior to x-ray mammography and sonography in order to determine breast cancer tumor volume.[9–11]
In the recent years, several methods have been proposed to segment lesions in mammography and MRI data. The references[12,13] provide comprehensive information about them. These methods can be categorized into three groups: i) contour-based segmentation such as active contour algorithm.[14–17] ii) Region-based segmentation techniques.[18,19] iii) Classification-based segmentation that includes supervised and unsupervised methods.
Supervised-based segmentation such as Neural Networks[20,21] and Support Vector Machines [SVM][22] lead to high accuracy, but they require a large amount of labeled data, which is hard, expensive, and slow to be obtained. Furthermore, they cannot use unlabeled data to train classifiers. On the other hand, unsupervised learning methods such as Markov Random Field[23] and Fuzzy C Means (FCM)[24] remove the costs of labeling and do not use label of training data. So these methods need no prior knowledge and will have lower performance with respect to supervised methods.
To solve these problems, we propose a semi-supervised approach for segmentation of breast lesions in this paper. Several semi-supervised algorithms such as B-Training,[25] Co-Training,[26] and Expectation Maximization (EM)[27] have been presented, although none of them have been used for breast lesions segmentation in MRI. It should be mentioned that many of the presented methods in breast lesion segmentation used only the intensity value as a feature for each pixel, which is subject to image noise, patient motion, and MR artifacts.[28–30] Textures are one of the most important image attributes and can be distinguished objects with different patterns. Gibbs et al.[31] used texture analysis in diagnosis of benign and malignant breast lesions.
In this paper, we propose a semi-supervised pixel-by-pixel classification method based on texture analysis in order to achieve a high performance. In fact, our proposed method has two main stages. In the first stage, improved self-training (IMPST) classifier is trained only with a labeled image. In the next stage, nondeterministic unlabeled data is obtained through simple thresholding and this classifier is retrained with them to reach high accuracy. This paper is organized as follows: In section 2, we introduce three methods that were used for extracting features from breast MRIs. Self-Training algorithm is also presented in this section. The proposed approach will be explained in section 3. Section 4 investigates the experimental results of the proposed approach and compares the results with the supervised and unsupervised methods. Finally, discussion and conclusion come in section 5.
MATERIALS AND METHODS
Image Dataset
In this paper, we used the PIDER Breast MRI dataset (https://imaging.nci.nih.gov/ncia). This dataset includes breast MRI images from five patients and their ground truth (GT) segmentation that has been identified by a radiologist manually. GT is used as a reference for performance evaluation of segmentation methods in our experiments.
Region of Interest Selection
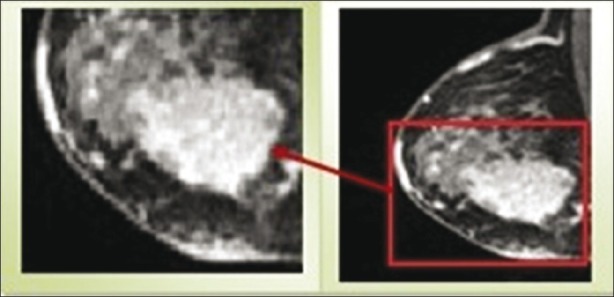
Since automatic segmentation of medical images is a challenging task and still an unsolved problem for many applications; experience of a radiologist can increase algorithm performance. Here, we present an interactive segmentation approach according to the identified region of interest (ROI). In our approach, an experienced radiologist examines and draws ROIs on MR image data with the help of image analysis software at first, and then, we give these ROIs as an input image to algorithm. Since the ROI is defined by placing a box with limited size -that completely contains the region of breast lesion, the segmentation complexity is reduced. A sample of ROI has been shown in Figure 1.
Figure 1.
Region of interest
Feature Extraction Methods
Since textures are one of the most important characteristics of an image and also radiologists rely on textures to make diagnostic decisions, features extraction basis from texture is most widely used in medical image processing.[32] Texture feature attempts to identify gray level variations between adjacent pixels in the image.[33]
In this paper, we used three categories of texture feature: histogram statistics, co-occurrence, and run length matrix. For each pixel in the region of interest, we used a block 5*5 whose feature values are assigned to central pixel of block. Histogram statistics (six features) describes the intensity distribution within the block, such as mean and standard deviation.
Co-occurrence matrices[34] which measure the joint probability of two adjacent pixels along a given direction with co-occurring values i and j are calculated for 0°, 45°, 90°, and 145°. An average co-occurrence matrix is then computed for each texture block since no directional variations in texture are expected. Some of the equations of these texture features are given as follows.[34]
Notation:
p(i, j): (i, j)-the entry in a normalized gray-tone spatial-dependence matrix.
px(i): is the i-th entry in the marginal-probability matrix obtained by summing the rows of 
N: is the number of distinct gray levels in the equalized image.
1. Angular second
![]()
2. Contrast
![]()
3. Correlation

Where μX and σX are the mean and standard deviations PX, Respectively.
4. Variance
![]()
5. Inverse difference moment
![]()
6. Entropy
![]()
We calculated 22 features form co-occurrence matrices that measure joint probability of two nearest pixels in four directions.
The run-length matrix masseurs the abrasiveness of a texture in a given direction θ. Direction is the number of runs of pixels with a gray-level and a run length. A gray-level run is defined as a set of consecutive pixels with the same gray value in the given direction.[35] 11 features obtained from run-length matrix for same direction θ = 0°, 45°, 90°, and 145°. And the number of gray levels to use in both co-occurrence and run length matrices is 8. Some of the equations of these texture features are given as follows:[34]
1. Short run emphasis
![]()
2. Long run emphasis
![]()
3. Gray level nonuniformity
![]()
4. Run-length nonuniformity
![]()
Where I(i, j) is defined as the number of runs with pixels of gray level i and run length, j. nr is also the total number of runs. The texture features are listed in appendix. Totally, we extracted 39 texture features for each pixel.
Semi-Supervised Classification Methods
In traditional machine learning, only labeled data were used for classification. In general, obtaining labeled data is not only a hard working, expensive, and time consuming process, but also need human effort. Meanwhile, unlabeled data are easy to collect and there are a few ways to use them. Recently, semi-supervised learning addresses this problem.[36] By having a large number of unlabeled and a few numbers of labeled data, we can have a better classifier.
Since semi-supervised learning needs less human effort and has higher accuracy, it is interesting both in practical and theoretical fields. Medical image processing is one of the tasks in which collecting labeled data is difficult; therefore, semi-supervised learning is used in many image processing applications.[37,38]
Pixel classification is one of the image segmentation methods which are based on two approaches: Supervised[22] and unsupervised learning. But as it was mentioned, obtaining labeled data is a difficult task and the unsupervised segmentation methods need no prior knowledge and lead to low performance. So to solve these problems, we propose a pixel classification method based on semi-supervised learning which uses the potential of a large labeled data in order to increase the segmentation accuracy. Semi-supervised learning methods have never been used in breast MRI images segmentation.
PROPOSED APPROACH
In this paper, a semi-supervised approach is presented for breast lesion segmentation which use from IMPST algorithm. Figure 2 shows an overall view of this approach. For better understanding of the working process of the IMPST, we describe this proposed model in detail at first. As mentioned before, our approach has two main stages in training step. In the first stage, three feature sets are extracted for each pixel of training images according to section 2. Then, an image is chosen randomly as a labeled training data and is given to a radiologist for manual segmentation. In this approach, we do not need a radiologist to indicate the exact lesion region, but selecting a small region (about 20% of image) of the lesion is enough. The Figure below illustrates how an image is labeled by a radiologist.
Figure 2.
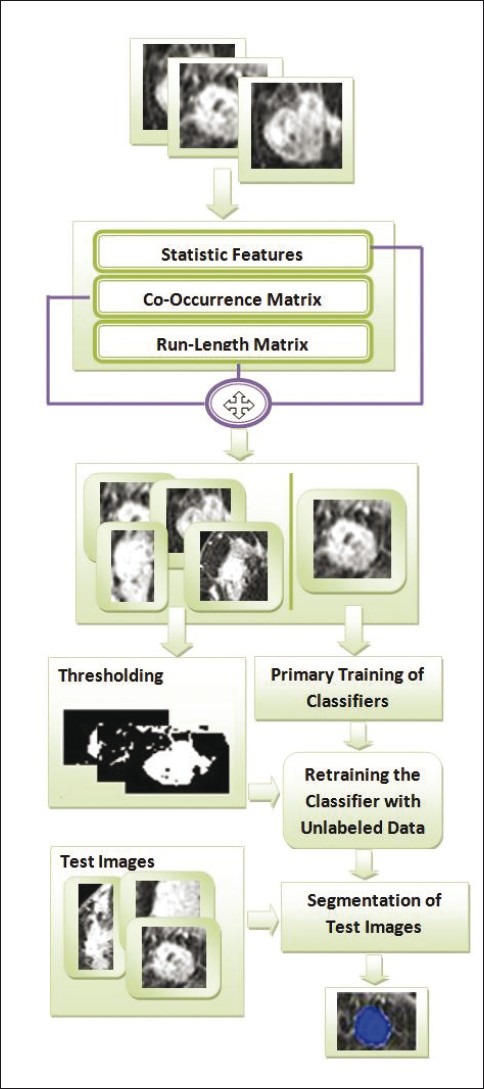
Illustration of proposed approach
As it is shown in the Figure 3, indicating this region by a radiologist is easier than indicating the exact lesion region. After manual labeling, these pixels are selected for primary training of IMPST. The remaining trained images are used as unlabeled data. In the next stage, a simple thresholding method is applied to get nondeterministic labeled data from unlabeled ones. Then, IMPST classifier is retrained with nondeterministic labeled data in an iterative manner. The IMPST algorithm is explained in the next section.
Figure 3.

Manual segmentation by radiologist
In the testing step, for segmenting an image, the first mentioned three features sets are extracted for each pixel of the image. Then, these pixels are entered to the trained classifier to be labeled.
Self-Training
Self-training is a technique commonly used for semi supervised learning. In self-training, a classifier is first trained with the small amount of labeled data. The classifier is then used to classify the unlabeled data. The unlabeled data, which is now labeled, are compared with a threshold and are added to the labeled training data.
The classifier is retrained and the procedure is repeated. Table 1 and Figure 4 show the pseudo code and overall view of the self-training algorithm, respectively.
Table 1.
Pseudo code of self-training algorithm
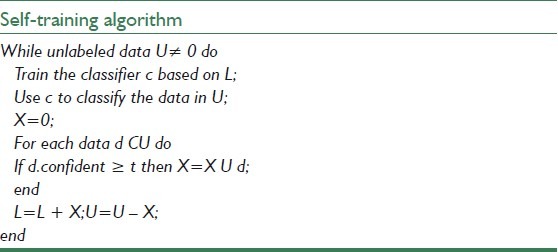
Figure 4.
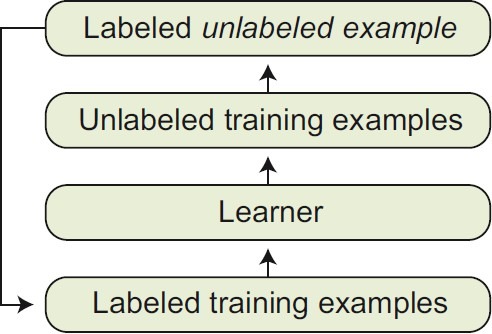
Illustration of self-training algorithm
The weakness which restricts the performance of self-training is simple decision policy used to select unlabeled data. To surmount this problem, we propose IMPST algorithm.
IMPST Algorithm
As described in section 2, the IMPST algorithm creates an initial weak classifier based solely on the labeled examples at first. The classifier is then used to classify the unlabeled training data. These unlabeled samples along with their predicted labels are added to the training set. But self-training algorithm uses a simple decision policy to add unlabeled samples to training data. This weakness can decrease the performance of algorithm.
To overcome this problem, we defined a more sophisticated decision policy. The improved self-training algorithm has been described in Table 2 gives a set L of labeled training samples and a set U of unlabeled training ones. We extract three feature sets and then use them to train a classifier C.
Table 2.
Pseudo code of IMPST algorithm
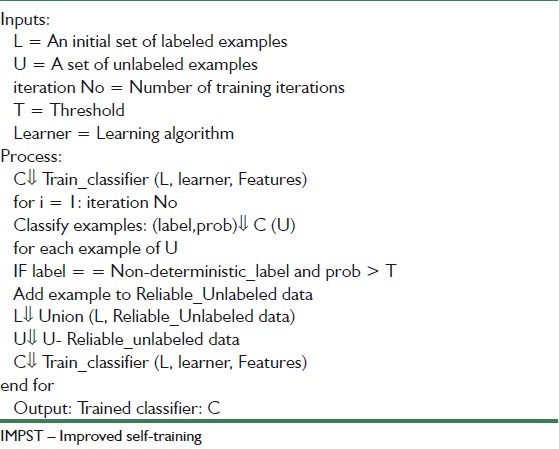
The algorithm iterates the following procedure for the maximum number of iteration iteration No. First, it recognizes the unlabeled examples in U classifier B. The label predictions and corresponding class probabilities are recorded in (Label, Prob). The class probabilities Prob is regarded as the confidence estimates for better selection. Secondly, the algorithm selects some reliable unlabeled data Reliable_Unlabeled data for which 1) the assigned labels by classifier B and sample thresholding be equal and 2) each probability label be greater than a specific threshold that is determined by problem information. Unlabeled data that do not satisfy these two constraints are filtered, but the others are added to labeled data examples L and removed from unlabeled data U in next iteration. These decision polices reinforce the self-training which selects the most confident labeled example. Hereby, the performance of algorithm is increased.
EXPERIMENTAL RESULTS
In previous section, we proposed our semi-supervised approach for breast lesion segmentation in MRIs in detail. In this section, as mentioned before, the performance of this method is investigated by using PIDER Breast MRI dataset (https://imaging.nci.nih.gov/ncia). This dataset includes breast MRI images and their ground truth (GT) segmentation that have been identified by a radiologist manually.
GT is used as a reference for performance evaluation of segmentation methods in our experiments. Here, we used four images for training process that one of them is a labeled image and the others are unlabeled ones. Then, 120 pixels (equivalent with labeled part with radiologist) (60 lesions and 60 Unlesion) are chosen from labeled image. Also, 400 pixels (200 lesions and 200 Unlesion) are randomly selected from nondeterministic labeled images that are obtained through sample thresholding. Hereby, we have the total of 120 labeled and 1200 nondeterministic labeled pixels for the training classifier.
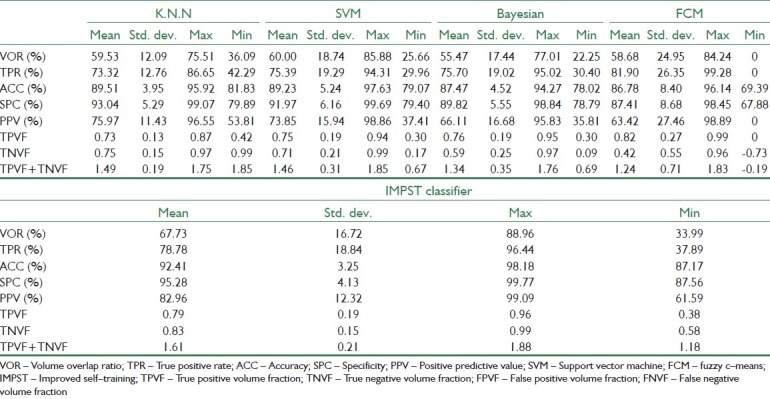
In the next step, 12 breast images from dataset are used as the test images. Due to space limitation, we only show the result of 5 out of 12 test images in separate Tables. The ROIs of these images and their GTs have been shown in two first rows of Table 3. Finally, the result of the all 12 test images is demonstrated in Table 4.
Table 3.
Segmentation results for supervised and proposed methods
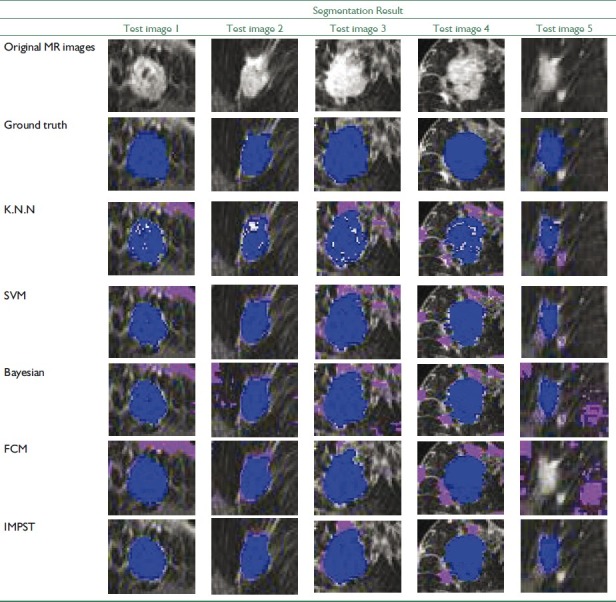
Table 4.
Segmentation results for IMPST and other (K.N.N, SVM, Bayesian, FCM) classifier (12 test data)
The analysis methods described in this paper is numerically implemented using Matlab 7.9 (R 2009b).
Evaluation Criteria
Many different measures for evaluating the performance of an algorithm have been proposed such as volume overlap ratio, specificity, sensitivity, precision, accuracy and etc. First, we give a definition of some expressions in Table 5.
Table 5.
Definition of some expressions

1. Accuracy
This criterion is used to measure the similarity between assigned labels by computer algorithm and real labels given by a radiologist.
![]()
2. Precision
Unlike accuracy, precision criterion is used to measure reproducibility or repeatability of assigning a label in the same condition.
![]()
3. Specificity
This criterion measures the proportion of negatives which are correctly identified.
![]()
4. Sensitivity
This criterion measures the proportion of actual positives which are correctly identified. These two latest measures are closely related to the concepts of errors.
![]()
5. Volume overlap ratio
In this study, we also use the overlap ratio to quantify how well the computer results and the radiologist's delineation agree. If Pc denote the set of lesion pixels which came from the computer, algorithm result and Pr denote the set of lesion pixels which is came from the radiologist's segmentation, the volume overlap ratio (VOR) is defined as:
![]()
In which the ∩ operator is logical and, ∪ is the logical OR. It takes value between [0 1], when it is zero. It means that there is no overlap and one means the exact overlap.[39]
6. Other criterion
We also describe the accuracy with other parameters: True Positive Volume Fraction (TPVF), True Negative Volume Fraction (TNVF), false positive volume fraction (FPVF), and false negative volume fraction (FNVF). These parameters are defined as follows:[40]
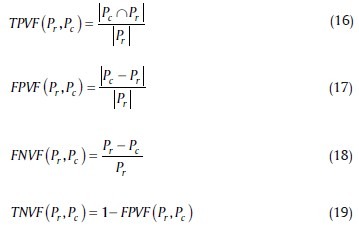
We just use the two of these volume fractions and the sum of them: TPVF and TNVF.
Performance Evaluation for Supervised Classifiers
Before evaluating the segmentation performance in semi-supervised method, we investigate the performance of supervised methods in breast MRI image segmentation at first. For this purpose, three supervised classifiers K-Nearest Neighbors (KNN with k=10), SVM, and Bayesian are trained separately using 120 labeled data. Then, we compute evaluation measures such as VOR, accuracy, and precision of these classifiers for test data using Equation 11-19. Tables 6–8 represent segmentation results of the three supervised classifiers on five test images and their segmentation results have been illustrated in rows 3, 4, and 5 of Table 3. The blue and violet pixels indicate true and false positives, respectively, in segmented images. As it can be observed in Table 4, supervised methods cannot produce acceptable results when we have a few labeled data.
Table 6.
Segmentation results for SVM classifier

Table 8.
Segmentation results for Bayesian classifier

Table 7.
Segmentation results for K.N.N classifier

Performance Evaluation for Unsupervised Method
In this section, we evaluated the performance of Fuzzy c-Means methods as an unsupervised algorithm in breast MRI images segmentation. According to Tables 3, 4, and 9 the Fuzzy c-Means cannot produce proper results compare to IMPST.
Table 9.
Segmentation results for fuzzy c-means

Performance Evaluation for Proposed Approach
In this experiment, IMPST uses Bayesian classifier as the basic classifier. To train this classifier, we set the iteration parameters iteration No to be 400. In Figure 5, classification error rate in each iteration has been shown. After training the classifier, we compute evolution measures for test images. The segmentation results of IMPST have been shown in Table 10 and the row 7 of Table 3illustrates segmented images.
Figure 5.
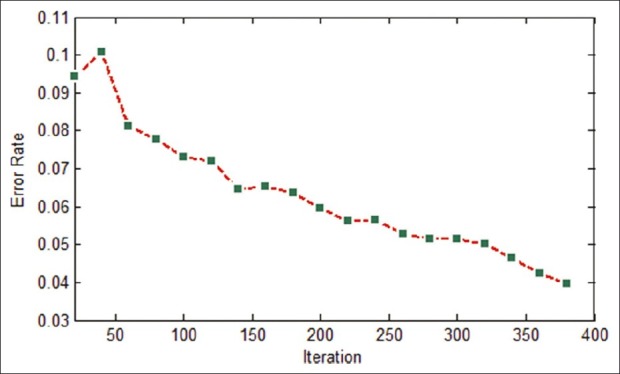
Classification error rate in each iteration
Table 10.
Segmentation results for IMPST classifier

The quantitative evaluation results of all 12 test images are provided in Table 4. The VOR was (59.53±12.09) (Mean±Std dev), (60.0±18.74), (55.47±17.44), (58.68±24.95) and (67.73±16.72) between computer and radiologist for K.N.N, SVM, Bayesian, Fuzzy c-Means and IMPST classifiers, respectively. As it is evident in Table 4, there are statistically significant difference between proposed approach and supervised methods. Generally, our proposed method can produce more proper results compared to supervised and unsupervised method only with 20% labeled data.
To evaluate the performance of the classifiers, Receiver operating characteristic (ROC) analysis also is performed. ROC is based on statistical decision theory and it has been applied widely to the evaluation of clinical performance. The area under the ROC curve is referred Az index. It is used as a measure of the classification performance.
A higher Az indicates better classification performance because a larger value of True Positive (TP) is achieved at each value of False Positive (FP). The value of AZ is 1.0 when the diagnostic detection has perfect performance, which means that TP rate is 100% and FP rate is 0%. The values of AZ have been shown in Table 11.
Table 11.
The values of AZ
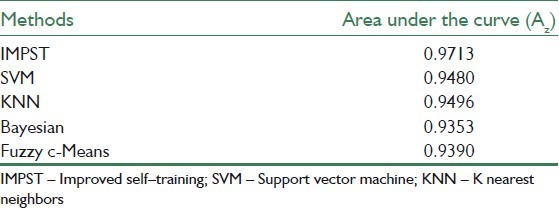
The ROC diagram is shown in the Figure 6.
Figure 6.

Average ROC curves obtained on all testing images using supervised, unsupervised and semi-supervised approaches
CONCLUSION AND DISCUSSION
In this paper, semi-supervised approach is presented as a new approach for breast lesion segmentation in MRIs. This approach evaluates through 9 criteria; Accuracy, VOR, Precision, Specificity, Sensitivity, True Positive Volume Fraction, and True Negative Volume Fraction. The results shows that the proposed method has a higher performance compared to supervised methods, due to interaction with a radiologist. A number of interesting points have been revealed from several test images:
Supervised classifiers have a high performance in image segmentation when they are trained with a large amount of data. But in many cases (such as image processing problems), as repeatedly mentioned, integrating labeled data is expensive. According to the results of experiments, supervised classifiers cannot produce the appropriate results when a few labeled data available
In conditions that limited labeled data are available, presented semi-supervised classifier can produce more appropriate results compared to supervised classifiers by exploiting information which exist in labeled and unlabeled data
By adding a more precise decision policy to Self-Training algorithm, IMPST classifier trains a confident learner. Hence, this approach improves accuracy and precision of segmented images according to experimental results
Unsupervised methods remove the cost of labeling, but, since these methods don′t need any prior knowledge about problem, they have lower performance with respect to supervised and semi- supervised methods.
APPENDIX
The list of three categories (Statistics, Co-occurrence Matrix, Run-Length Matrix) textural features have been used in this paper is given as follows:
Statistic
Mean
Skewness
Absolute deviation
Variance
Kurtosis
Standard deviation
Co-occurrence matrix
Uniformity/Energy/Angular second moment
Entropy
Dissimilarity
Contrast/Inertia
Inverse difference
Correlation
Homogeneity/Inverse difference moment
Autocorrelation
Cluster shade
Cluster prominence
Maximum probability
Sum of squares
Sum average
Sum variance
Sum entropy
Difference variance
Difference entropy
Information measures of correlation (1)
Information measures of correlation (2)
Maximal correlation coefficient
Inverse difference normalized (INN)
Inverse difference moment normalized (IDN)
Run-length matrix
Short Run Emphasis (SRE)
Long Run Emphasis (LRE)
Gray-Level Nonuniformity (GLN)
Run Length Nonuniformity (RLN)
Run Percentage (RP)
Low Gray-Level Run Emphasis (LGRE)
High Gray-Level Run Emphasis (HGRE)
Short Run Low Gray-Level Emphasis (SRLGE)
Short Run High Gray-Level Emphasis (SRHGE)
Long Run Low Gray-Level Emphasis (LRLGE)
Long Run High Gray-Level Emphasis (LRHGE)
BIOGRAPHIES

Reza Azmi, received his BS degree in Electrical Engineering from Amirkabir university of technology, Tehran, Iran in 1990 and his MS and PhD degrees in Electrical Engineering from Tarbiat Modares university, Tehran, Iran in 1993 and 1999 respectively. Since 2001, he has joined Alzahra university, Tehran, Iran. He was an expert member of Image Processing and Multi-Media working groups in ITRC (From 2003 to 2004), Optical Character Recognition working group in supreme council of information and communication technology (From 2006 to 2007) and Security Information Technology and Systems working groups in ITRC (From 2006 to 2008). He was Project Manager and technical member of many industrial projects.

Narges Norozi, received the B.Sc degree in computer engineering from Abhar University, Zanjan, Iran in 2008. Currently she is doing MASc in Artificial Intelligence from Alzahra University, Tehran, Iran. Her research interests include Medical Image processing, Machine Vision and Pattern Recognition.

Robab Anbiaee received her MD degree in Medical College of Shahid Sadooghi University, Yazd, Iran in 1991-1998. She is completed her residency at Medical College of Shahid Beheshti University of Medical Sciences, Iran, Tehran in 2001-2004. Also she is currently Assistant Professor in Department of Radiation oncology for Medical College of Shahid Beheshti University, Iran, Tehran.

Leila Salehi, received his B.Sc. degree in software engineering from Abhar University, Abhar, Iran in 2007 and she is currently study M.Sc. in artificial intelligence in Alzahra University, Tehran. She is interested in medical image processing research

Azardokht Amirzadi received the B.Sc degree in computer engineering from Oloom Fonoon University, Babol, Iran in 2008. Currently she is doing MASc in Artificial Intelligence from Alzahra University, Tehran, Iran. Her research interests include machine learning and computer vision, medical image processing.
Footnotes
Source of Support: Nil
Conflict of Interest: None declared
REFERENCES
- 1.Smith RA, Cokkinides V, Eyre HJ. Cancer screening in the United States, A review of current guidelines, practices, and prospects. CA Cancer J Clin. 2007;57:90–104. doi: 10.3322/canjclin.57.2.90. [DOI] [PubMed] [Google Scholar]
- 2.Pisano ED, Gatsonis C, Hendrick E, Yaffe M, Baum JK, Acharyya S, et al. Diagnostic performance of digital versus film mammography for breast-cancer screening. N Engl J Med. 2005;353:1773–83. doi: 10.1056/NEJMoa052911. [DOI] [PubMed] [Google Scholar]
- 3.Kerlikowske K, Carney PA, Geller B, Mandelson MT, Taplin SH, Malvin K, et al. Performance of screening mammography among women with and without a first-degree relative with breast cancer. Ann Intern Med. 2000;133:855–63. doi: 10.7326/0003-4819-133-11-200012050-00009. [DOI] [PubMed] [Google Scholar]
- 4.Kolb TM, Lichy J, Newhouse JH. Comparison of the performance of screening mammography, physical examination, and breast US and evaluation of factors that influence them: An analysis of 27,825 patient evaluations. Radiology. 2002;225:165–75. doi: 10.1148/radiol.2251011667. [DOI] [PubMed] [Google Scholar]
- 5.Bird RE, Wallace TW, Yankaskas BC. Analysis of cancers missed at screening mammography. Radiology. 1992;184:613–7. doi: 10.1148/radiology.184.3.1509041. [DOI] [PubMed] [Google Scholar]
- 6.Kopans DB. The positive predictive value of mammography. AJR Am J Roentgenol. 1992;158:521–6. doi: 10.2214/ajr.158.3.1310825. [DOI] [PubMed] [Google Scholar]
- 7.Morris EA. Diagnostic breast MR imaging: Current status and future directions. Radiol Clin North Am. 2007;45:863–80. doi: 10.1016/j.rcl.2007.07.002. [DOI] [PubMed] [Google Scholar]
- 8.Saslow D, Boetes C, Burke W, Harms S, Leach MO, Lehman CD, et al. American Cancer Society guidelines for breast cancer screening with MRI as an adjunct to mammography. CA Cancer J Clin. 2007;57:75–89. doi: 10.3322/canjclin.57.2.75. [DOI] [PubMed] [Google Scholar]
- 9.Boetes C, Mus RD, Holland R, Barentsz JO, Strijk SP, Wobbes T, et al. Breast-tumors—Comparative accuracy of MR-imaging relative to mammography and US for demonstrating extent. Radiology. 1995;197:743–9. doi: 10.1148/radiology.197.3.7480749. [DOI] [PubMed] [Google Scholar]
- 10.Esserman L, Hylton N, Yassa L, Barclay J, Frankel S, Sickles E. Utility of magnetic resonance imaging in the management of breast cancer: Evidence for improved preoperative staging. J Clin Oncol. 1999;17:110–9. doi: 10.1200/JCO.1999.17.1.110. [DOI] [PubMed] [Google Scholar]
- 11.Malur S, Wurdinger S, Moritz A, Michels W, Schneider A. Comparison of written reports of mammography, sonography and magnetic resonance mammography for preoperative evaluation of breast lesions, with special emphasis on magnetic resonance mammography. Breast Cancer Res. 2001;3:55–60. doi: 10.1186/bcr271. [DOI] [PMC free article] [PubMed] [Google Scholar]
- 12.Oliver A, Freixent J, Marti J, Perez E, Pont J, Denton ER, et al. A review of automatic mass detection and segmentation in mammographic images. Med Image Anal. 2010;14:87–110. doi: 10.1016/j.media.2009.12.005. [DOI] [PubMed] [Google Scholar]
- 13.Behrens S, Laue H, Althaus M, Boehler T, Kuemmerlen B, Hahn HK, et al. Computer assistance for MR based diagnosis of breast cancer: Present and future challenges. Comput Med Imaging Graph. 2007;31:236–47. doi: 10.1016/j.compmedimag.2007.02.007. [DOI] [PubMed] [Google Scholar]
- 14.Shi J, Sahiner B, Chan HP, Ge J, Hadjiisk L, Helvie MA, et al. Characterization of mammographic masses based on level set segmentation with new image features and patient information. Med Phys. 2008;35:280–90. doi: 10.1118/1.2820630. [DOI] [PMC free article] [PubMed] [Google Scholar]
- 15.Timp S, Karssemeijer N. A new 2D segmentation method based on dynamic programming applied to computer aided detection in mammography. Med Phys. 2004;31:958–71. doi: 10.1118/1.1688039. [DOI] [PubMed] [Google Scholar]
- 16.Harab T, Fujitab H, Iwasec T, Endod T, Horitae K. Automated contour extraction of mammographic mass shadow using an improved active contour model.In proc. International Congress Series. 2004;1268:882–5. [Google Scholar]
- 17.Hill A, Mehnert A, Crozier S. Edge intensity normalization as a bias field correction during balloon snake segmentation of breast MRI. Conf Proc IEEE Eng Med Biol Soc. 2008;2008:3040–3. doi: 10.1109/IEMBS.2008.4649844. [DOI] [PubMed] [Google Scholar]
- 18.Eltonsy NH, Tourassi GD, Elmaghraby AS. A concentric morphology model for the detection of masses in mammography. IEEE Trans Med Imaging. 2007;26:880–9. doi: 10.1109/TMI.2007.895460. [DOI] [PubMed] [Google Scholar]
- 19.Zhang H, Foo SW. Computer aided detection of breast masses from digitized ammograms. IEICE Trans Inform Syst. 2006;E89D:1955–61. [Google Scholar]
- 20.Lucht R, Delorme S, Brix G. Neural network-based segmentation of dynamic MR mammographic images. Magn Reson Imaging. 2002;20:147–54. doi: 10.1016/s0730-725x(02)00464-2. [DOI] [PubMed] [Google Scholar]
- 21.Ertaş G, Gülçür HO, Osman O, Uçan ON, Tunaci M, Dursun M. Breast MR segmentation and lesion detection with cellular neural networks and 3D template matching. Comput Biol Med. 2008;38:116–26. doi: 10.1016/j.compbiomed.2007.08.001. [DOI] [PubMed] [Google Scholar]
- 22.Yao J, Chen J, Chow C. Breast tumor analysis in dynamic contrast enhanced MRI using texture features and wavelet transform. IEEE J Sel Top Signal Process. 2009;3:94–100. [Google Scholar]
- 23.Wu Q, Salganicoff M, Krishnan A, Fussell DS, Markey MK. Interactive lesion segmentation on dynamic contrast enhanced breast MRI using a markov model. In Proc. Med Imaging Image Process. 2006;6144:61444M. [Google Scholar]
- 24.Chen W, Giger ML, Bick U. A fuzzy c-means (FCM)-based approach for computerized segmentation of breast lesions in dynamic contrast-enhanced MR images. Acad Radiol. 2006;13:63–72. doi: 10.1016/j.acra.2005.08.035. [DOI] [PubMed] [Google Scholar]
- 25.Pise N, Kulkarni P. A Survey of Semi-Supervised Learning Methods. In proc. International Conference on Computational Intelligence and Security, IEEE. 2008:30–4. [Google Scholar]
- 26.Blum A, Mitchell T. Combining labeled and unlabeled data with co-training. In proc. Proceedings of the 11th Annual Conference on Computational Learning Theory: Madison. 1998:92–100. [Google Scholar]
- 27.Maeireizo B, Litman D, Hwa R. Co-training for predicting emotions with spoken dialogue data. In Proc. of Annual Meeting of the Association for Computational Linguistics. 2004:202–5. [Google Scholar]
- 28.Chen W, Giger ML, Bick U, Newstead GM. Computerized interpretation of breast MRI: Investigation of enhancement-variance dynamics. Med Phys. 2004;31:1076–82. doi: 10.1118/1.1695652. [DOI] [PubMed] [Google Scholar]
- 29.Twellmann T, Lichte O, Nattkemper TW. An adaptive tissue characterization network for model-free visualization of dynamic contrast-enhanced magnetic resonance image data. IEEE Trans Med Imaging. 2005;24:1256–66. doi: 10.1109/TMI.2005.854517. [DOI] [PubMed] [Google Scholar]
- 30.Zheng Y, Englander S, Baloch S, Zacharaki EI, Fan Y. STEP: Spatial-temporal enhancement pattern, for MR-Based breast tumor diagnosis. In Proc. ISBI: Arlington, VA. 2007:520–3. [Google Scholar]
- 31.Gibbs P, Turnbull LW. Textural analysis of contrast-enhanced MR images of the breast. Magn Reson Med. 2003;50:92–8. doi: 10.1002/mrm.10496. [DOI] [PubMed] [Google Scholar]
- 32.Tourassi GD. Journey toward computer-aided diagnosis: Role of image texture analysis. Radiology. 1999;213:317–20. doi: 10.1148/radiology.213.2.r99nv49317. [DOI] [PubMed] [Google Scholar]
- 33.Li L, Mao F, Qian W, Clarke LP. Wavelet transform for directional feature extraction in medical imaging. In Proc Int Conf Image Process IEEE. 1997;3:500–3. [Google Scholar]
- 34.Haralick R, Shanmugam K, Dinstein I. Texture features for image classification. IEEE Trans Syst Man Cybern. 1973;SMC-3:610–21. [Google Scholar]
- 35.Galloway MM. Texture analysis using gray level run lengths. Comput Vis Graph. 1975;4:172–9. [Google Scholar]
- 36.Xu G, Zhang Y, Li L. Berlin: Springer Press; 2010. Web Information Systems Engineering and Internet Technologies; p. 56. [Google Scholar]
- 37.Filipovych R, Davatzikos C. Semi-supervised pattern classification of medical images: Application to mild cognitive impairment (MCI) Neuroimage. 2011;22:1109–19. doi: 10.1016/j.neuroimage.2010.12.066. [DOI] [PMC free article] [PubMed] [Google Scholar]
- 38.Najjar M, Cocquerez JP, Ambroise C. A Semi -supervised Learning Approach to Image Retrieval. Die Deutsche Arbeitsqeminschaft fur Mustererkennug Symposium. 2002 Sep 18; [Google Scholar]
- 39.Cui YF. Malignant lesion segmentation in contrast-enhanced breast MR images based on the marker-controlled watershed. Med Phys. 2009;36:4359–69. doi: 10.1118/1.3213514. [DOI] [PMC free article] [PubMed] [Google Scholar]
- 40.Fan X, Yang J, Cheng L. A novel segmentation method for MR brain images based on fuzzy connectedness and FCM. In Proc. Lect Notes Comput Sci. 2005;3613:505–13. [Google Scholar]


