Abstract
Electro encephalography (EEG) is one of the most reliable sources to detect sleep onset while driving. In this study, we have tried to demonstrate that sleepiness and alertness signals are separable with an appropriate margin by extracting suitable features. So, first of all, we have recorded EEG signals from 10 volunteers. They were obliged to avoid sleeping for about 20 hours before the test. We recorded the signals while subjects did a virtual driving game. They tried to pass some barriers that were shown on monitor. Process of recording was ended after 45 minutes. Then, after preprocessing of recorded signals, we labeled them by drowsiness and alertness by using times associated with pass times of the barriers or crash times to them. Then, we extracted some chaotic features (include Higuchi's fractal dimension and Petrosian's fractal dimension) and logarithm of energy of signal. By applying the two-tailed t-test, we have shown that these features can create 95% significance level of difference between drowsiness and alertness in each EEG channels. Ability of each feature has been evaluated by artificial neural network and accuracy of classification with all features was about 83.3% and this accuracy has been obtained without performing any optimization process on classifier.
Keywords: Alertness, drowsy driving, electro encephalography, fractal dimensions, two-tailed t-test
INTRODUCTION
One of the important applications of electro encephalography (EEG) signal is to study about the drowsiness and alertness level of operators who are forced to do monotonous, but attention demanding jobs (air traffic controllers or truck drivers and etc...).[1] One of the important issues in most of the studies is preventing car accidents which happen each year because of driver's drowsiness. So it is necessary to have a real time system that supervises driver's drowsiness continuously. Researches about drivers’ drowsiness detection have been done on some physiological indicators. The most important indicators are biomedical signals such as: EEG, electrooculography (EOG), electrocardiography (ECG) and electromyography (EMG). In some studies, researchers gave attention to video and image processing; they have used driver's eye and face videos for drowsiness detection. Ueno and his collegeous[2] developed a system that uses image processing technology and alertness is detected on the basis of the degree to which the driver's eyes are open or closed. In 1998, Boverie et al.,[3] described a new aproach for driver's drowsiness detection based on analysis of their eyelid movement. Grace[4] introduced a system with an audible tone. The alarm tone triggers are associated with PERCLOS calculated over three minutes. Time series of interhemispheric and intrahemispheric cross spectral densities of full spectrum EEG is another study in 2001 by Vuckovic et al.[5] They used three types of artificial neural networks: (1) the linear network, (2) the non-linear artificial neural network (ANN), and (3) the Learning Vector Quantization (LVQ) neural network that gave the best results in classification about 94.37%.[5] Lin et al.[6] proposed a new approach for drowsiness detection based on combination of EEG power spectra estimation, independent component analysis, and fuzzy neural network in a dynamic virtual-reality-based driving environment. In 2005, Abdulhamit Subasi[7] used wavelet method, in which he extracted some statistical features from wavelet sub bands. He used artificial neural networks for classification. Total accuracy in this study for alertness, drowsiness, and sleep detection by ANN was above 92%. Papadelis et al.[8] in 2006 used the Relative Band Ratio (RBR) of the EEG frequency bands, the Shannon Entropy, and the Kullback-Leibler (KL) Entropy that were estimated for each one second segment. Then statistical tests were used for drowsiness detection. In 2007, Yoshida et al.[9] proposed a new method for analyzing brain activity from EEG based on a concept of instantaneous equivalent bandwidths (IEBWs) to track bandwidths changes of EEG signals. This method used positive time-frequency distributions. Investigation of the relationship between changes in the EEG and also slow eye movements (SEMs) in the EOG at the wake-sleep transition is another study in 2007. In this study, wavelet transform and energy functions were used and SEMs are detected automatically by a computerized system.[10] Another study in 2007 was focused on total variant of EEG signal with reduced number of channels.[11] For detailed classification of drowsiness, authors used alpha waves. In an article published in 2008, Hu Shuyan et al. tried to predict of drowsiness by employing support vector machines with eyelid related parameters extracted from EOG data as features.[12] The accuracy of drowsiness detection for very sleepy peoples is quite high.[3] Michail et al.[13] demonstrated that power spectral analysis of driver's heart rate and changes in fractal dimension of EEG signal are associated with driving errors. Another paper in 2008 decomposed EEG signal to sub bands by wavelet transform and then extracted Shannon entropy of each sub bands. Average accuracy of alert, drowsy and sleep classification by usage of adaptive neuro-fuzzy inference system is above 98%.[14] Another method was dynamic clastering which was introduced in 2008. This method was based on EEG to estimate vigilance states and used temporal series information to supervise EEG data clustering.[15] Kurt et al.[1] used wavelet transform for decomposition of EEG signal to its sub bands. For increasing the accuracy of diagnosing the transition from wakefulness to sleep, they applied EEG sub bands and also left and right EOG and chine EMG to artificial neural network. Accuracy of classification was above 97% for sleep, alert and drowsy states. Finally in 2009, Yeo et al.[16] showed that support vector machines are the best classifier for wake to sleep transition diagnosis. Samples of EEG data from both states were used to train the SVM program.
In this study, we have defined a new protocol for data acquisition based on driving condition. Introduced protocol is a safe and simple one for drowsy driving data aquisition, because in some previous protocols, researchers have not given attention to driving situation. It means that they have recoarded EEG signal from drowsy subjects in usual condition, but not while driving.[1,5,7,14] Some data aquisitions have been done when subjects drive a real car.[8] This protocol is the best way for data recording from drowsy drivers, but has some disadvantages: 1) it is really expensive and time consuming, 2) it makes subjects stressfull because subjects know that it is possible to get drowsy and have driving events, so EEG data is a mixture of stress and drowsiness. Labratory researches have shown that in reality, drivers that get drowsy are not aware of their drowsiness, so before driving events they have no stress or anxiety about incidence of accident. Because of this, we have simulated driving condition by a simple driving game virtually. Our protocol was a safe and simple one; in our virtual driving condition, subjects were relaxed and they were not under stress; so EEG signals arise from drowsiness, but not out of stress. After data acquisition, we have computed logarithm of energy of EEG signal as a feature and Higuchi's and petrosian's fractal dimensions as chaotic features. Then we have shown that these features can be able to separate alertness and drowsiness levels of drivers. Then, two-tailed t-test is done to distinguish the significance level of difference between the alertness and drowsiness.
MATERIALS AND METHODS
One of important features of chaotic signals is fractal dimension. Calculation of signal's fractal dimension makes it possible to investigate the geometry of base of attraction and complexity of signal. Fractal dimensions are computable in various approaches. Some of these measures are Higuchi's and Petrosian's fractal dimensions that are computable in the following ways:
Higuchi's Fractal Dimension
The Higuchi algorithm is an efficient method to estimate fractal dimension of a signal, because it uses lower number of samples of data.[17] So it can compute fractal dimension with a good temporal resolution. In this method, for each values of k from 1 to kmax, a new time series is generated from given EEG data, according to Eq. 1.

Where m is first point of each series.
For each xkm, Lm(k) the length of is equal to:

Where N is number of samples in original signal. The  is a normalization coefficient.
For k, from 1 to kmax, we obtain kmax number of lengths. Mean values of these lengths are computed when the value of k is fixed.

Slope of the best estimated line with minimum error for the graph of log (L(k)) vs. log (1/k) is the best estimation of Higuchi's fractal dimension.
Petrosian's Fractal Dimension
Petrosian's algorithm is one of the simplest and fastest methods for estimation of fractal dimension. It is based on change of sign of signal's derivation. But in discrete signals, derivation can defined as subtraction of consecutive signals. It can be estimated by following expression:

Where NΔ is number of changes in sign of signal's derivation and D is Petrosian's Fractal Dimension and n is the number of signal's samples.
Logarithm of Energy of Signal
Signal can define as vibrations along time, so an area under a special curve is a suitable description for energy of signal. But this curve should be calculated in a way that negative values of signal do not cause to decrease power of signal.[18] So, squared value of signal along the time can be the best curve for this aim. Assume that x(n) is a signal with N sample, energy of this signal is calculated in following way:

Where xi stands for a sample of signal x(n). Usually logarithm of energy (log10(E)) is used as a feature.
DATA AQUISITION
Subjects
Ten volunteers of Master of Science students of engineering faculty of Shahed University participated in this study. The group consisted of three females and seven males with a mean age of 27.67 years and driving experience of about eight years. People were obliged to be sleep deprived at least 20 hours before the data recording and took no soporific medicine at least three days before the test. It should be mentioned that all the 10 subjects were selected from people who accepted and fulfilled all the obligations. The Epworth Sleepiness Scale (ESS)[19] was used to pre-screen and to determine the level of daytime sleepiness. Total score in Epworth test is 24 that indicate severe sleepiness. But Epworth scores for selected subjects were in range of normal alertness (up to 8) and mild sleepiness (between 8 and 11).
Equipments
In this research, we used portable EEG equipment, NCC (Z2N-24W), 16 bits with 24 channels and a sampling rate of 128-Hz. We needed long time recordings of EEG data, so we had to use golden surface electrodes that were fixed on EEG cap. In order to increase the connection between electrodes and scalp surface, we used special conductor jells. EEG recordings were done according to 10-20 standard protocol. We recorded left EOG signal simultaneously, so removing EOG artifacts will be possible.
At the defined bipolar montage for EEG equipment, left and central channels had been recorded by the channel A1 (left ear electrode) and right channels according to A2 (right ear electrode) and left EOG had been recorded by the channel FP1. For reaching the pure signal of each channel, we have subtracted them from A1, A2, and FP1. Finally, we have used 19 channels listed in Table 1. Placements of recorded channels have been shown in Figure 1.
Table 1.
P values of two-tailed t-test for Higuchi's and Petrosian's fractal dimensions and logarithm of energy
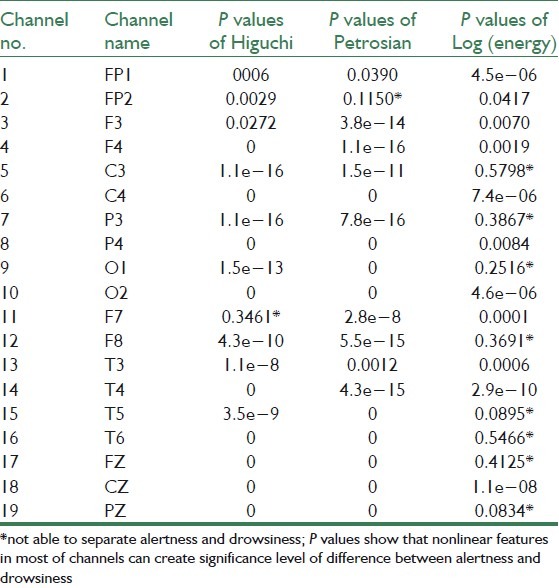
Figure 1.
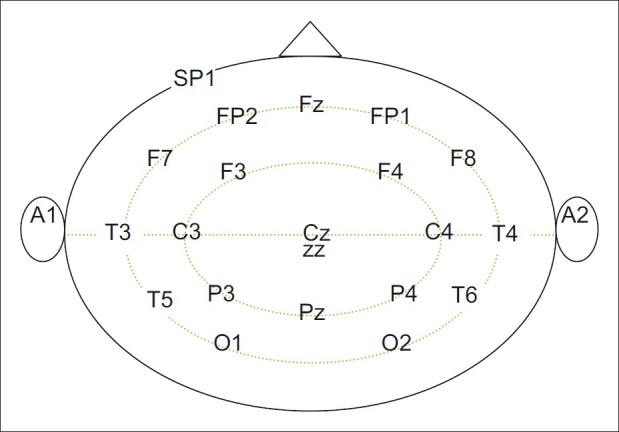
Placement of recorded channels in defined montage
Virtual Driving Environment
As mentioned before, data collection is done in virtual driving condition where subjects could feel drowsiness; for this reason, we had decided to use a simple driving game with minimum tension. This game should be able to show times of passing and crashing to the barriers appearing on monitor [Figure 2]. The driving game was a two dimensional computer game; it consisted of a monotonous forward road with the lowest diversity of colors. Before starting the game, temporal period for barriers were entered as an input by operator. These barriers were square shape and appeared on monitor according to Poisson's distribution. We designed this game and we implemented it on JAVA space. Times of passes were saved on a special file, if driver could pass a barrier. But if he or she could not pass it, this time were saved as time of crash on that file. By an automatic alarm tone, the subjects could be aware of driving events (e.g. crash) and it could make them alert. The mentioned file associated with passes and crashes are available after the game ended.
Figure 2.

Designed virtual driving game for data collection. (a) In this figure the barrier comes near to the subject and subject should try to pass it. (b) Subject has crashed to the barrier. Crash time has been shown on monitor
Data collection was done in a quiet room with normal luminosity. During the EEG data collection, we also recorded videos of faces and eyes of subjects by a webcam installed on the computers on which the volunteers were playing the driving game.
We collected data in three to four sessions for each subject and duration of each session was about 45 minutes. We had given special questionnaires to subjects before the test; these questionnaires included group's personal information and all necessary knowledge about recordings. At the end of data collection, subjects described us their mental and physical conditions during the test.
Data Preprocessing
For data preparation, the recordings were band pass filtered between 0.5 and 30 Hz. The band pass filter was a type 1 Chebyshev filter with order 2. For 50 Hz noise removal, we used a notch filter. Then, these recordings were divided to two second epochs (each epoch consisting 256 samples, without any overlap to each other). Movement artifacts were removed visually. Every two second segments have time tags, so we removed segments associated with times of artifacts. Video recording were simultaneous with data recording and driving game; so we used pass and crash times of driving game for labeling of EEG datasets. The levels of labeling are shown in Figure 3.
Figure 3.
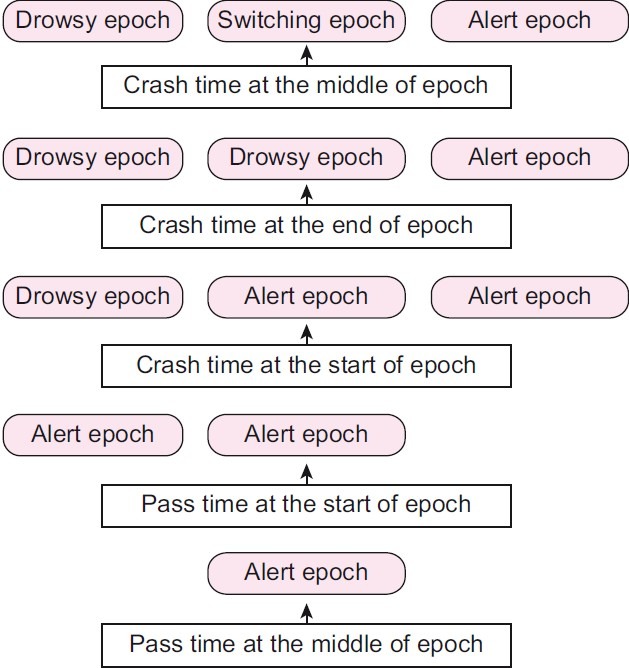
Steps for labeling of two seconds epochs of recorded EEG by usage of times for pass and crash that was saved in driving game's output file for each subject
Times of passes or crashes were marked in each 2 s epochs using game's output file. For example, If crash was happened at the end of epoch, we considered this and previous epoch as drowsiness. But subsequent epoch was labeled as alertness, because of alarm tone. To be sure about accuracy of mentioned labels, we used video recordings and subject's descriptions about his or her mental and physical conditions during the virtual driving. For example, if a subject passed a barrier, but according to the video recording, he or she was drowsy during the passing, we eliminated corresponding EEG and if a subject crashed to a barrier, but he or she said that this event was happened in vigilance; corresponding EEG was eliminated, according to the recorded video.
Statistical Analysis of Datasets
After labeling process, we had 843 observations for each class of drowsiness and alertness in 19 channels.
Each observation was two seconds (256 samples). For analysis of datasets, we have extracted logarithm of energy and Higuchi's and Petrosian's Fractal dimensions. List of all 19 channels is shown in Table 1.
Chaotic features have been calculated in one second windows including 128 samples with an overlap of 127 samples. Then we have used mean values of yielding time series. The main reason for calculation of fractal dimensions in one second windows is to follow variations of fractal dimensions before a crash or pass for future studies on drowsiness prediction. Logarithm of energy has been calculated in the same way. For visual evaluation of ability of extracted features in distinguishing drowsy and alert classes, we computed mean of extracted features over trials for each channel. Then we have plotted them according to channels in Figures 4–6. As shown in Figures 4–6, Higuchi's and Petrosian's fractal dimensions are more powerful than logarithm of energy in alertness and drowsiness distinguishing. It is considerable that mean of Higuchi's and Petrosian's fractal dimensions over trials is higher when the subjects are alert than when they are drowsy. So it can demonstrate that complexity of brain activity in alertness is high, but when brain is drowsy, its activity is less complex than alertness. We can conclude that in sleep onset, the brain have low activity and low energy, because of this, sleepy drivers lose the ability of decision making; they cannot react to the stimulants quickly, so incidence of car accidents in drowsy driving is likely.
Figure 4.
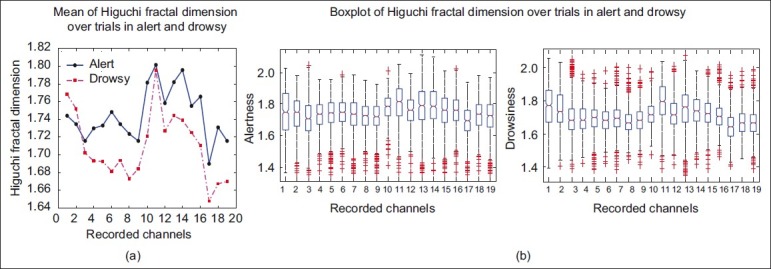
Mean and variance of Higuchi's fractal dimension. (a) Mean of Higuchi's fractal dimension of all observations in each channel for drowsy and alert. (b) Box plot of Higuchi's fractal dimension over trials. In this Figure mean values and variance of all observations in alertness and drowsiness in each channel can be seen
Figure 6.
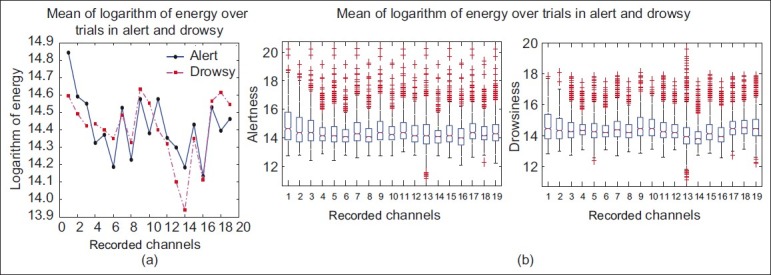
Mean and variance of logarithm of energy. (a) Mean of logarithm of energy of all observations in each channel for drowsy and alert. (b) Box plot of logarithm of energy over trials. In this figure mean values and variance of all observations in alertness and drowsiness in each channel can be seen
Ability of extracted features in alertness and drowsiness discrimination can be studied more closely with statistical tests. In this study, we have used two-tailed t-test. T-test can give us an indication of separateness of alertness and drowsiness. This kind of statistical test have been applied on Higuchi's and Petrosian's fractal dimension and also on logarithm of energy of signal. The results have been shown in Table 1. P values of t-tests show that difference between fractal dimensions in alertness and drowsiness are significant in most of channels. But this test demonstrate that logarithm of energy just in some channels can lead to significant difference. P values of marked channels by * are above 0.05, so these channels cannot create significant difference between two classes.
According to Table 1, each chaotic feature (i.e. fractal dimensions) is more reliable than logarithm of energy in separation of alertness and drowsiness. Mean of these features over trials can be seen in Figures 4 and 5. According to these figures, we can evaluate the ability of mentioned features for discriminating two classes. Fractal dimensions in most of channels can create 95% of significant level. It can be demonstrated by P values in Table 1.
Figure 5.
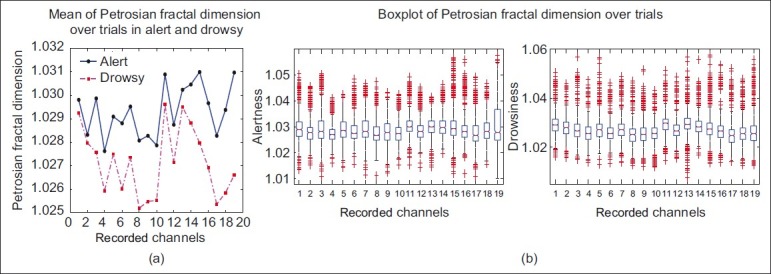
Mean and variance of Petrosian's fractal dimension. (a) Mean of Petrosian's fractal dimension of all observations in each channel for drowsy and alert. (b) Box plot of Petrosian's fractal dimension over trials. In this figure mean values and variance of all observations in alertness and drowsiness in each channel have been shown
CLASSIFICATION RESULTS
For better evaluation of ability of each feature in distinguishing of alert and drowsy classes, we have used a classifier. Accuracy, sensitivity, and specificity of classification are shown in Table 2. Classifier was a feed forward ANN with following structure:
Table 2.
Classification results with Higuchi's and Petrosian's fractal dimensions and logarithm of energy

-
a)
Nineteen neurons in input layer equal to dimension of dataset and number of used channels
-
b)
Five neurons in hidden layer with tangent sigmoid function
-
c)
One neuron in output layer with logarithm sigmoid function
-
d)
Method of training was Levenberg-Marquardth
-
e)
Learning rate: 0.0001
-
f)
Number of Epochs: 200
-
g)
Input data consisted of 1686 observations.
Dataset have been divided to training and test parts for 10 times. Each time, 80% of dataset have been used for training and 20% for test process. Final error of learning is mean of 10 obtained errors.
According to Table 2, despite of P values in Table 1, classification results have shown that logarithm of energy does a good job in discriminating of alert and drowsy. It shows that bad channels (i.e. channels with P values more than 0.05) in mixture of good channels have better operation in classification process.
In values more than 0.05) in mixture of good channels have better operation in classification process.
In Table 3, results of classification with all extracted features in every channel have been shown. Used ANN had 57 neurons in input layer and input data consisted of 1686 observations.
Table 3.
Classification results with all extracted features

CONCLUSION
In this study, we have tried to introduce a new simple protocol for EEG data collection from drowsy drivers. We have recorded EEG data in a virtual driving situation, an environment that is made based on reality. This virtual driving situation was a laboratory circumference: A two dimensional computer driving game during which subjects tried to pass the barriers that appeared on monitor. Participants were forced to be sleep deprived at least 20 hours before the test. After recording EEG and EOG signals and also video signals synchronously, we did some pre-processing on datasets, such as: Filtering and labeling of them as drowsiness and alertness. Feature extraction from recorded signals was the next step. In this step, we have computed Higuchi's and Petrosian's fractal dimensions as nonlinear features and also logarithm of energy of EEG channels. We have shown that the extracted features are able to discriminate alertness and drowsiness and it is prominent in most of channels. As shown in Table 1, channels that have P values lower than 0.05 can create at least 95% of significant level for distinguishing of drowsiness and alertness levels by associated features.
Ability of extracted features in discriminating alertness and drowsiness has been evaluated by ANN classifier. The results have been shown in Tables 2 and 3. In spite of P values in Table 1, it is clear that mixture of channels does a good operation in classification, especially logarithm of energy that has not had P values lower than 0.05 in some channels.
According to Figure 4–6, mean of extracted features over trials in alertness level is higher than drowsiness. This demonstrates that brain is in lowest level of activity and complexity when driver is fatigue and drowsy. So, drivers in this situation lose their concentration and control and consequently they are not able to have a quick reply to motives. Actually by using these features two states of features are distinct and it is possible to make drowsy drivers alert by an alarm, so this discrimination would be useful in accident preventing. Results of classification also show that accuracy of classification by these features is above 83%. This is an evident that drowsy driving detection by mentioned features is possible. But comparison would have no meaning since the situations for data collection in previous and present studies are different. But our new protocol would be a suitable and simple way for data collection in virtual driving condition. As mentioned before, we have collected EEG data in virtual driving condition using a simple two dimensional driving game. This game has been designed and implemented for this aim in JAVA space.
BIOGRAPHIES

Zahra Mardi received M.S. Degree in Biomedical Engineering (Bioelectric) from Shahed university of Tehran, Iran in 2011. Her research interests have been in the area of Biomedical signal processing especially EEG signals, drowsy drivers’ detection from EEG signals, Brain Computer Interface Systems and Chaos Theory

Seyedeh Naghmeh Miri Ashtiani received M.S. Degree in Biomedical Engineering (Bioelectric) from Shahed University of Tehran, Iran in 2011. Her research interests have been in the area of biomedical signal processing especially EEG, Biomedical image processing and Modeling of Biomedical signals particularly, ECG signals.

Mohammad Mikaili received the B.S. Degree in Electronic Engineering from Tehran University, Tehran, Iran, in 1989, and the M.S. and Ph.D. Degrees in Biomedical Engineering from the Amirkabir University, Tehran, Iran, in 1994 and 2001, respectively. Since 2001, he has been with Shahed university,where he is currently an Associate Professor with the School of Engineering. His current research interests include Biomedical signal processing, Sleep EEG analysis and BCI systems.
Footnotes
Source of Support: Nil
Conflict of Interest: None declared
REFERENCES
- 1.Kurt MB, Sezgin N, Akin M, Kirbas G, Bayram M. The ANN-based computing of drowsy level. Expert Syst Appl. 2009;36:2534–42. [Google Scholar]
- 2.Ueno H, Kaneda M, Tsukino M. Development of drowsiness detection system. In Proc. of 1994 vehicle navigation and information systems Conference, Yokohama, Japan, IEEE. 1994:15–20. [Google Scholar]
- 3.Boverie S, Leqellec JM, Hirl A. Intelligent systems for video monitoring of vehicle cockpit. In The 1998 international congress and exposition ITS: Advanced Controls and vehicle navigation systems. 1998:1–5. SAE international; SAE Technical Paper 980613 doi:10.4271/980613. [Google Scholar]
- 4.Grace R. 2001. Drowsy driver monitor and warning system. In International driving symposium on human factors in driver assessment, training and vehicle design, Aspen, CO; pp. 201–208. citeseer. [Google Scholar]
- 5.Vuckovic A, Radivojevic V, Chen AC, Popovic D. Automatic re cognition of alertness and drowsiness from EEG by an artificial neural network. Med Eng Phys. 2002;24:349–60. doi: 10.1016/s1350-4533(02)00030-9. [DOI] [PubMed] [Google Scholar]
- 6.Lin CT, Chen YC, Wu RC, Liang SF, Huang TY. Assessment of Driver's Driving Performance and Alertness Using EEG-based Fuzzy Neural Networks, ISCAS 2005. IEEE International Symposium on Circuits and Systems. 2005;1:152–5. [Google Scholar]
- 7.Subasi A. Automatic recognition of alertness level from EEG by using neural Network and wavelet coefficients. Expert Syst Appl. 2005;28:701–11. [Google Scholar]
- 8.Papadelis C, Kourtidou-Papadeli C, Bamidis PD, Chouvarda I. Indicators of Sleepiness in an ambulatory EEG study of night driving. in Proc. of the 28th IEEE EMBS Annual International Conference New York City, USA, Aug 30-Sept 3. 2006 doi: 10.1109/IEMBS.2006.259614. [DOI] [PubMed] [Google Scholar]
- 9.Yoshida H, Kuramoto H, Sunada Y, Kikkawa S. EEG Analysis in Wakefulness Maintenance State Against Sleepiness by Instantaneous Equivalent Bandwidths. In proc. of the 29th Annual International Conference of the IEEE EMBS Cité Internationale, Lyon, France. 2007 Aug 23-26; doi: 10.1109/IEMBS.2007.4352212. [DOI] [PubMed] [Google Scholar]
- 10.Magosso E, Ursino M, Provini F, Montagna P. Wavelet Analysis of Electroencephalographic and Electro-oculographic Changes During the Sleep Onset Period. Proc of the 29th Annual International Conference of the IEEE EMBS Cité Internationale, Lyon, France. 2007 Aug 23-26; doi: 10.1109/IEMBS.2007.4353212. [DOI] [PubMed] [Google Scholar]
- 11.Byung-Chan Chang, Jung-Eun Lim, Hae-Jin Kim, Bo-Hyeok Seo. A study of classification of the level of sleepiness for the drowsy driving prevention. SICE Annual Conference 2007, Kagawa University, Japan. 2007 Sep 17-20; [Google Scholar]
- 12.Hu Shuyan, Zheng Gangtie. Driver drowsiness detection with eyelid related parameters by Support Vector Machine. [Last accessed on 2008]. Expert Systems with Applications. Available from: http://www.elsevier.com/locate/eswa .
- 13.Michail E, Kokonozi A, Chouvarda I, Maglaveras N. EEG and HRV markers of sleepiness and loss of control during car driving. th Annual International IEEE EMBS Conference Vancouver, British Columbia, Canada. 2008 Aug 20-24; doi: 10.1109/IEMBS.2008.4649724. [DOI] [PubMed] [Google Scholar]
- 14.Yildiz A, Akin M, Poyraz M, Kirbas G. Application of adaptive neuro-fuzzy inference system for vigilance level estimation by using wavelet-entropy feature extraction. Expert Syst Appl. 2008;36:7390–7399. [Google Scholar]
- 15.Li-Chen Shi, Bao-Liang Lu. Dynamic Clustering for Vigilance Analysis Based on EEG. 30th Annual International IEEE EMBS Conference Vancouver, British Columbia, Canada. 2008 Aug 20-24; doi: 10.1109/IEMBS.2008.4649089. [DOI] [PubMed] [Google Scholar]
- 16.Yeo MV, Li X, Shen K, Wilder-Smith Einar P.V. Can SVM be used for automatic EEG detection of drowsiness during car driving? Saf Sci. 2009;47:115–24. [Google Scholar]
- 17.Higuchi T. Approach to an irregular time series on the basis of the fractal theory. Physica D. 1988;31:277–83. [Google Scholar]
- 18.Selik M, Baraniuk R, Blair A. Signal Energy vs.Signal Power. Connexions module: M10055. Version 2.10: Aug 12, 2004 3:58 pm GMT-5, Available from: http://cnx.org/content/m10055/2.10/
- 19. [Last accessed on 2011 Sept 26]. Available from: http://www.sleepapnea.org/assets/files/pdf/ESS%20PDF%201990-97.pdf .


