Abstract
Objective
The age-related effects of fasting on lipolysis, the production of ketone bodies, and plasma insulin levels were studied in male 3-, 8-, and 32-week-old Sprague–Dawley rats.
Methods
The rats were divided into fasting and control groups. The 3-, 8- and 32-week-old rats tolerated fasting for 2, 5, and 12 days, respectively.
Results
Fasting markedly reduced the weights of perirenal and periepididymal white adipose tissues in rats in the three age groups. The mean rates of reduction in both these adipose tissue weights during fasting periods were higher in the order of 3 > 8 > 32-week-old rats. Fasting transiently increased plasma free fatty acid (FFA), total ketone body, β-hydroxybutyrate, and acetoacetate concentrations in the rats in the three age groups. However, plasma FFA, total ketone body, β-hydroxybutyrate, and acetoacetate concentrations in the 3-week-old rats reached maximal peak within 2 days after the onset of fasting, although these concentrations in the 8- and 32-week-old rats took more than 2 days to reach the maximal peak. By contrast, the augmentation of plasma FFA, total ketone body, β-hydroxybutyrate, and acetoacetate concentrations in the rats in the three age groups had declined at the end of each experimental period. Thus, the capacity for fat mobilization was associated with tolerance to fasting. Plasma insulin concentrations in the rats in the three age groups were dramatically reduced during fasting periods, although basal levels of insulin were higher in the order of 32 > 8 > 3 week-old rats.
Conclusion
These results suggest that differences in fat metabolism patterns among rats in the three age groups during prolonged fasting were partly reflected the metabolic turnover rates, plasma insulin levels, and amounts of fat storage.
Keywords: Lipolysis; Ketone body production; β-hydroxybutyrate, and acetoacetate; Fasting; Aging
Keywords: Medicine & Public Health; Occupational Medicine/Industrial Medicine; Environmental Health; Public Health/Gesundheitswesen; Medicine/Public Health, general; Health Promotion and Disease Prevention
Introduction
Lipolysis during fasting is a crucial adaptive response to supply free fatty acid (FFA) as an energy substrate to peripheral tissues, and is known to be hormonally regulated [1–4]. As the fasting period is prolonged, surplus FFA is metabolized to ketone bodies, including β-hydroxybutyrate, acetoacetate, and acetone, in the liver mitochondria, and then the ketone bodies are utilized as alternative energy substrates to glucose in a variety of tissues, such as brain, heart, kidney, and skeletal muscles [2, 5–10]. In addition, ketone bodies suppress glucose consumption in the brain [11–13]. Thus, ketone bodies play essential roles in adaptive responses to fasting, although fasting ketonuria is commonly observed in women and is associated with a growing risk of diabetic ketoacidosis [14].
Of note, nutritional states are dramatically changed with aging. For example, the suckling-weaning transition, observed in most mammals, induces fundamental changes in nutritional levels [15, 16]. At the end of the suckling period, as the milk intake is gradually replaced by a solid food diet, carbohydrate intake become more predominant than fat intake [9, 15]. Furthermore, during the postnatal growth period, protein turnover is very high, and proteins are rapidly synthesized in most tissues, particularly in skeletal muscles [17, 18]. On the contrary, as animals reach their mature size, the protein turnover rate is moderate [17, 18]. Therefore, growing animals require a greater energy supply than mature animals. Thus, prolonged fasting would be expected to harm energy homeostasis more quickly in order of age. However, little evidence for this has been obtained so far.
We previously demonstrated that fasting-induced reductions of plasma glucose and triglyceride concentrations showed clearly different patterns among 3-, 8- and 32-week-old rats [19]. The reducing effects of fasting on plasma glucose and triglyceride levels were larger in the order of 3 > 8 > 32 week-old rats [19]. However, it is still unclear how fasting affected fat metabolism, which plays biologically important roles in supplying energy substrates to various tissues during fasting, in these three age groups of rats. The age-related effects of fasting on plasma levels of hormones could be also integrated into lipolytic patterns. Therefore, in the present study, to provide information about age-dependent patterns of adaptive responses to fasting via fat metabolism, the age-related effects of fasting on lipolysis and the production of ketone bodies and insulin were investigated in 3-, 8- and 32-week-old rats.
Materials and methods
Experimental procedure and animal care
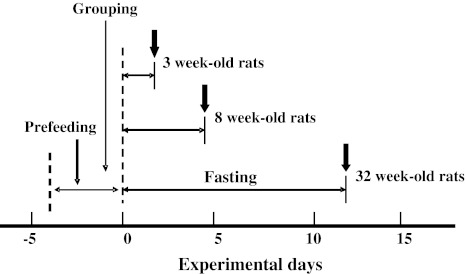
The experimental protocol is shown in Fig. 1, and it was approved by the Committee on Animal Care and Use, Waseda University, and followed the Guiding principles of the care and use of animals in the field of physiological sciences of the Physiological Society of Japan [20].
Fig. 1.
Experimental protocol. Pre-feedings were carried out for 4 days. After the pre-feedings, rats in three age groups were divided into fasting (FAS) and control (CON) groups. Beginning on the next day, the 3-, 8-, and 32-week-old rats in the FAS group were deprived of food for 2, 5, and 12 days, respectively. During the experimental periods, body weights were measured. Plasma free fatty acid (FFA), total ketone body, β-hydroxybutyrate, and insulin concentrations were assayed. On the final days of fasting, the perirenal and periepididymal white adipose tissues were isolated and weighed (downwardarrows)
Male Sprague–Dawley 3-, 8-, and 32-week-old rats (Charles River, Tokyo, Japan) were pre-fed for 4 days to allow adaptation to their new environments, and then divided into fasting (FAS; n = 8–9) and control (CON; n = 8) groups. Fasting was started at 0800 hours for the 3- and 8-week-old rats, and at 1000 hours for the 32-week-old rats. Our preliminary data showed that the 3-, 8-, and 32-week-old rats began to die at 3, 6, and 13 days after feeding, respectively. Therefore, fasting of the 3-, 8-, and 32-week-old rats was maintained for 2, 5, and 12 days, respectively. The animals were housed individually in stainless-steel cages at a controlled temperature (23–26°C) and a relative humidity of 45–60% with light–dark cycles [0700–1900 hours (light) and 1900–0700 hours (dark)] [21–23]. Animal chow (CE-2 cubic type; CLEA Japan, Tokyo, Japan) and once-boiled tap water were provided to the rats ad libitum. The time range of food intake during the experiment was accurately determined, and animal chow was removed within 1 h before blood sampling. During the experimental period, the body weights were measured in the morning, daily for the 3- and 8-week-old rats and every 2 days for the 32-week-old rats.
Blood sampling and white adipose tissue isolation
Bloods were collected in heparinized microcapillary tubes from the tail vein, immediately before the onset of fasting, and then 6, 12 h, 1 day, 36 h and 2 days after the onset of fasting for 3-week-old rats, 12 h, 1, 2, 3, 4 and 5 days after the onset of fasting for 8-week-old rats, and 1, 2, 4, 8, 10 and 12 days after the onset of fasting for 32-week-old rats, because the tolerance to fasting differed among the three age groups of rats [19]. Obtained bloods were centrifuged at 12,000 rpm for 5 min, and then plasma fractions were assayed [24]. On the final days of fasting, perirenal and periepididymal white adipose tissues were isolated, and weighed promptly [25].
Plasma assays
Plasma FFA concentration was assayed with the NEFA C-test Wako (Wako Pure Chemical, Tokyo, Japan). Plasma total ketone body and β-hydroxybutyrate concentrations were assayed with the Autokit total ketone bodies (Wako Pure Chemical) and Autokit 3-HB (Wako Pure Chemical), respectively. Plasma acetoacetate concentration was calculated by subtracting the plasma β-hydroxybutyrate concentration from the plasma total ketone body concentration [2, 5]. Plasma insulin analyses were carried out with the Rebis insulin-rat T (Shibayagi, Shibukawa, Japan), based on an enzyme-linked immunosorbent assay (ELISA). The microplate reader used for the insulin assay was Model 550 type (Bio-Rad, Tokyo, Japan).
Statistical analyses
Data are presented as means ± standard error of mean (SEM). The effects of fasting on the body weight and plasma FFA, ketone body, and insulin concentrations were evaluated by a two-way analysis of variance (ANOVA) for repeated measures. Subsequent post-hoc analyses to determine significant differences between the FAS and the CON groups were performed by Fisher’s protected least significant difference (PLSD) test. The effects of fasting on the weights of white adipose tissues were evaluated by a one-way ANOVA. Differences were considered significant when p was <0.05.
Results
Body weights and white adipose tissue weights
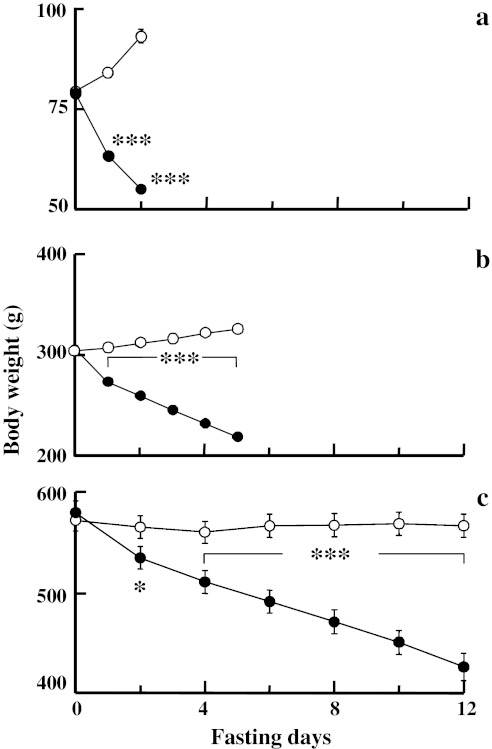
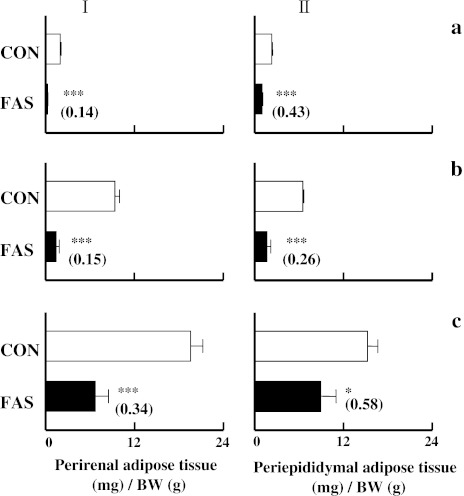
As shown in Fig. 2a, b, body weight gains in 3- and 8-week-old rats were gradually suppressed with increasing fasting periods. Body weight in 32-week-old rats was clearly reduced during the fasting period (Fig. 2c). The mean rates of suppression of body weight during the fasting periods were estimated as 20.5, 6.6, and 2.0% per day in the 3-, 8- and 32-week-old rats, respectively. Both the weights of the perirenal and periepididymal white adipose tissues, as proportions per body weight, in the rats in the three age groups were significantly lower in the FAS group than in the CON group (Fig. 3). From these results, the mean rates of suppression of perirenal adipose tissue weights during the fasting periods were estimated as 43.0, 17.0, and 5.1% per day in the 3-, 8- and 32-week-old rats, respectively. Similar estimations were also made for periepididymal adipose tissue weights.
Fig. 2.
Effects of fasting on the body weights of a 3-, b 8-, and c 32-week-old rats. The values are shown as means ± SEM. Open circles CON groups (n = 8) and closed circles FAS groups (n = 8–9). Statistics: *p < 0.05 and ***p < 0.001 (vs. CON groups)
Fig. 3.
Effects of fasting on the weights of perirenal (I) and periepididymal (II) white adipose tissues in a 3-, b 8-, and c 32-week-old rats. The values are shown as means ± SEM. Open bars CON groups (n = 8) and closed bars FAS groups (n = 8–9). Values in parentheses are relative ratios of the FAS groups to the CON groups. Statistics: *p < 0.05 and ***p < 0.001 (vs. CON groups). BW body weight
Plasma FFA concentrations
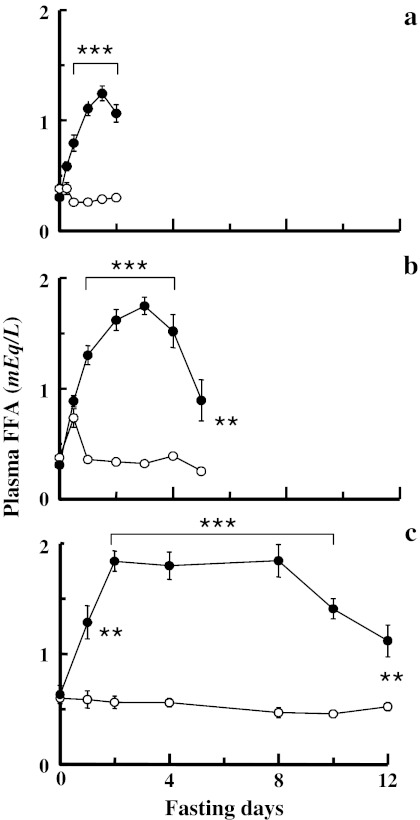
As shown in Fig. 4, plasma FFA concentrations were transiently increased during the fasting periods in rats in all the age groups. Plasma FFA concentrations in 3-week-old rats reached the peak 36 hrs after the onset of fasting, and then began to return to the level of CON group (Fig. 4a). In 8-week-old rats, plasma FFA concentrations reached the peak on the 3rd day, and then began to return to the level of CON group (Fig. 4b). In 32-week-old rats, plasma FFA concentrations reached the peak on the 2nd day after the onset of fasting, were maintained at the highest levels until the 8th day, and then began to return to the level of CON group (Fig. 4c).
Fig. 4.
Effects of fasting on plasma FFA concentrations in a 3-, b 8-, and c 32-week-old rats. The values are shown as means ± SEM. Open circles CON groups (n = 8) and closed circles FAS groups (n = 8–9). Statistics: **p < 0.01 and ***p < 0.001 (vs. CON groups)
Plasma ketone body concentrations
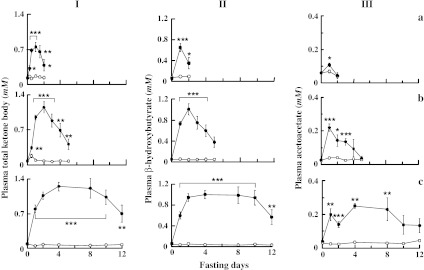
As shown in Fig. 5, plasma ketone body concentrations as well as plasma FFA concentrations were transiently increased during fasting periods in rats in the three age groups. Plasma total ketone body concentrations in 3-week-old rats reached the peak on the 1st day, and then started to return to the level of CON group (Fig. 5aI). In 8-week-old rats, plasma total ketone body concentrations reached the peak on the 2nd day, and then gradually returned to the basal level as the fasting period continued (Fig. 5bI). Plasma total ketone body concentrations in 32-week-old rats reached the peak on the 4th day, were maintained at the highest levels until the 8th day, and then started to return to the level of CON group (Fig. 5cI). The maximal peak values of plasma total ketone body concentrations during the fasting periods were higher in the order of 32 = 8 > 3 week-old rats. Plasma β-hydroxybutyrate concentrations in rats in the three age groups were increased during the fasting periods, and these patterns were similar to those of the plasma total ketone body concentrations (Fig. 5I, II). When plasma acetoacetate concentrations were calculated, these parameters showed similar patterns to those of the other ketone body concentrations (Fig. 5III).
Fig. 5.
Effects of fasting on plasma total ketone body (I), β-hydroxybutyrate (II), and acetoacetate (III) concentrations in a 3-, b 8-, and c 32-week-old rats. The values are shown as means ± SEM. Open circles CON groups (n = 8) and closed circles FAS groups (n = 8–9). Statistics: *p < 0.05, **p < 0.01 and ***p < 0.001 (vs. CON groups)
Plasma insulin concentrations
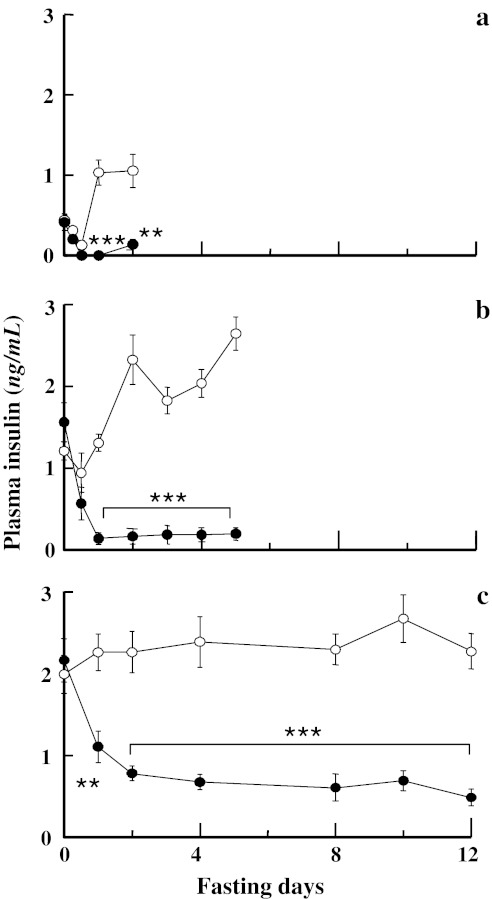
As shown in Fig. 6, plasma insulin concentrations were dramatically reduced during the fasting periods in rats in the three age groups. Plasma insulin concentrations in the FAS group on the final day of fasting were 0.13, 0.07, and 0.21 times significantly lower than those in the CON group, in 3-, 8-, and 32-week-old rats, respectively (Fig. 6).
Fig. 6.
Effects of fasting on plasma insulin concentrations in a 3-, b 8-, and c 32-week-old rats. The values are shown as means ± SEM. Open circles CON groups (n = 8) and closed circles FAS groups (n = 8–9). Statistics: **p < 0.01 and ***p < 0.001 (vs. CON groups)
Discussion
Free fatty acids generated by lipolysis are utilized as energy sources in peripheral tissues as well as serving as metabolic precursors of ketone bodies in the liver [26]. Ketone body production is partly regulated by the amount of FFA supplied to the liver [26, 27]. Indeed, in the present study, the changes in plasma FFA and ketone body concentrations during fasting periods showed similar patterns (Figs. 4, 5). These patterns were observed in rats in the three age groups (Figs. 4, 5), indicating that FFA mobilization and subsequent ketone body production are generally crucial adaptive responses to fasting in both mature and growing animals.
However, plasma FFA and ketone body concentrations in 3-week-old rats reached their maximal peak within 2 days after the onset of fasting, while those in the 8- and 32-week-old rats took more than 2 days (Figs. 4, 5). These differing results may be caused by several factors, such as differences in metabolic turnover rates and hormonal levels. It is generally accepted that metabolic turnover rates are markedly higher in growing rats than in mature rats [16–18]. Thus, during fasting periods, the primary energy sources in plasma, glucose and triglyceride, are more rapidly depleted in growing rats than in mature rats [19], and this leads to an earlier initiation of lipolysis and subsequent FFA mobilization in growing rats than in mature rats. By contrast, lipolysis is regulated by the levels of various hormones. Of these hormones, insulin stimulates the dephosphorylation of hormone-sensitive lipase (HSL), the rate-limiting enzyme of lipolysis, and thus inhibits its enzymatic activity [28]. In addition, insulin also suppresses the expression level of hepatic mitochondrial 3-hydroxy-3-methylglutaryl (HMG)-CoA synthase, the rate-limiting enzyme of ketone body production [29]. The suckling period is known to be characterized by higher plasma glucagon and lower plasma insulin levels [26]. The activities of enzymes of fatty acid oxidation and ketogenesis are known to be higher in growing rats, particularly during the suckling period [4, 16]. We demonstrated that the basal levels of plasma insulin concentrations in rats in the non-fasting group were in the order of 32 > 8 > 3 week-old rats (Fig. 6), and that plasma insulin concentrations in 3- and 8-week-old rats were gradually elevated with aging (Fig. 6a, b). Therefore, it is conceivable that low basal levels of insulin in growing periods enable the earlier mobilization of FFA to plasma and the production of ketone bodies after the onset of fasting. Furthermore, throughout the fasting periods, plasma FFA levels were transiently increased, and then began to return to basal levels, although plasma insulin levels were dramatically suppressed. These phenomena may be explained by fasting-induced reductions of HSL expression and its enzymatic activity.
Of note, plasma FFA and ketone body concentrations during fasting periods were relatively higher in 32- and 8-week-old rats than in 3-week-old rats (Figs. 4, 5). Further, the augmentations of these parameters in rats in the three age groups had declined at the end of each experimental period (Figs. 4, 5), indicating that the capacity for fat mobilization is associated with the tolerance to fasting. These differences in the capacities of FFA mobilization and ketone body production among the rats in the three age groups may have been caused mainly by the amounts of fat storage in the body. In fact, white adipose tissue masses were larger in the order of 32 > 8 > 3 week-old rats (Fig. 3). Both perirenal and periepididymal white adipose tissue masses in 8- and 3-week-old rats were dramatically reduced at the end of fasting (Fig. 3), showing that fat storage in 3- and 8-week-old rats was depleted by prolonged fasting.
In conclusion, fasting-induced lipolysis, FFA mobilization, and subsequent ketone body production showed maximum levels within 2 days after the onset of fasting in 3-week-old rats, but the maximum levels were shown more than 2 days after the onset of fasting in 8- and 32-week-old rats. In addition, the capacities for FFA mobilization and ketone body production during fasting periods were larger in mature rats than in growing rats. These results may reflect differences in metabolic turnover rates, plasma insulin levels, and the amounts of fat storage among the rats in the three age groups.
Acknowledgments
The present study was partly supported by a Grant-in-Aid from the Japanese Ministry of Education, Culture, Sports, Science and Technology (2007–2008, A 07129800 for K.I. and K.T.), a Grant-in-Aid from Ibuka’s Memorial Fund for Oriental Medicine, Advanced Research Center for Human Sciences, Waseda University (2007–2009, for K.I.), a Grant-in-Aid from the Academic Frontier Project of the Ministry of Education, Culture, Sports, Science and Technology, Japan (Waseda University, 2005–2009, 05F012 for K.I.), and a Grant-in-Aid from the Global Center Of Excellence (COE) program, Graduate School of Sport Sciences, Waseda University (2009–2013, for K.I.) of the Ministry of Education, Culture, Sports, Science and Technology, Japan.
Conflict of interest
There is no conflict of interest with any organization.
References
- 1.Garber AJ, Menzel PH, Boden G, Owen OE. Hepatic ketogenesis and gluconeogenesis in humans. J Clin Invest. 1974;54:981–989. doi: 10.1172/JCI107839. [DOI] [PMC free article] [PubMed] [Google Scholar]
- 2.Williamson DH, Whitelaw E. Physiological aspects of the regulation of ketogenesis. Biochem Soc Symp. 1978;43:137–161. [PubMed] [Google Scholar]
- 3.Beylot M. Regulation of in vivo ketogenesis: role of free fatty acids and control by epinephrine, thyroid hormones, insulin and glucagons. Diabetes Metab. 1996;22:299–304. [PubMed] [Google Scholar]
- 4.Kalderon B, Mayorek N, Berry E, Zevit N, Bar-Tana J. Fatty acid cycling in the fasting rat. Am J Physiol Endocrinol Metab. 2000;279:E221–E227. doi: 10.1152/ajpendo.2000.279.1.E221. [DOI] [PubMed] [Google Scholar]
- 5.Fukao T, Lopaschuk GD, Mitchell GA. Pathways and control of ketone body metabolism: on the fringe of lipid biochemistry. Prostaglandins Leukot Essent Fatty Acids. 2004;70:243–251. doi: 10.1016/j.plefa.2003.11.001. [DOI] [PubMed] [Google Scholar]
- 6.Kraemer FB, Shen WJ. Hormone-sensitive lipase: control of intracellular tri-(di-)acylglycerol and cholesteryl ester hydrolysis. J Lipid Res. 2002;43:1585–1594. doi: 10.1194/jlr.R200009-JLR200. [DOI] [PubMed] [Google Scholar]
- 7.Owen OE, Felig P, Morgan AP, Wahren J, Cahill GF., Jr Liver and kidney metabolism during prolonged starvation. J Clin Invest. 1969;48:574–583. doi: 10.1172/JCI106016. [DOI] [PMC free article] [PubMed] [Google Scholar]
- 8.Owen OE, Morgan AP, Kemp HG, Sullivan JM, Herrera MG, Cahill GF., Jr Brain metabolism during fasting. J Clin Invest. 1967;46:1589–1595. doi: 10.1172/JCI105650. [DOI] [PMC free article] [PubMed] [Google Scholar]
- 9.Nehlig A. Brain uptake and metabolism of ketone bodies in animal models. Prostaglandins Leukot Essent Fatty Acid. 2004;70:265–275. doi: 10.1016/j.plefa.2003.07.006. [DOI] [PubMed] [Google Scholar]
- 10.Hasselbalch SG, Knudsen GM, Jakobsen J, Hageman LP, Holm S, Paulson OB. Blood–brain barrier permeability of glucose and ketone bodies during short-term starvation in humans. Am J Physiol. 1995;268:E1161–E1166. doi: 10.1152/ajpendo.1995.268.6.E1161. [DOI] [PubMed] [Google Scholar]
- 11.Francois B, Bachmann C, Schutgens R. Glucose metabolism in a child with 3-hydroxy-3-methyl-glutaryl-coenzyme A lyase deficiency. J Inherit Metab Dis. 1981;4:163–164. doi: 10.1007/BF02263641. [DOI] [Google Scholar]
- 12.Randle PJ, Newsholme EA, Garland PB. Regulation of glucose uptake by muscle. 8. Effects of fatty acids, ketone bodies and pyruvate, and of alloxan-diabetes and starvation, on the uptake and metabolic fate of glucose in rat heart and diaphragm muscles. Biochem J. 1964;93:652–665. doi: 10.1042/bj0930652. [DOI] [PMC free article] [PubMed] [Google Scholar]
- 13.Sherwin RS, Hendler RG, Felig P. Effect of ketone infusions on amino acid and nitrogen metabolism in man. J Clin Invest. 1975;55:1382–1390. doi: 10.1172/JCI108057. [DOI] [PMC free article] [PubMed] [Google Scholar]
- 14.Keely E, Montoro MN. Type 1 and type 2 diabetes. In: Rosene-Montella K, Keely E, Barbour LA, Lee RV, editors. Medical care of the pregnant patient. Philadelphia: American College of Physicians; 2008. pp. 233–255. [Google Scholar]
- 15.Dymsza HA, Czajka DM, Miller SA. Influence of artificial diet on weight gain and body composition of the neonatal rat. J Nutr. 1964;84:100–106. doi: 10.1093/jn/84.2.100. [DOI] [PubMed] [Google Scholar]
- 16.Girard J, Ferre P, Pegorier JP, Duee PH. Adaptations of glucose and fatty acid metabolism during perinatal period and suckling–weaning transition. Physiol Rev. 1992;72:507–562. doi: 10.1152/physrev.1992.72.2.507. [DOI] [PubMed] [Google Scholar]
- 17.Goldspink DF, Kelly FJ. Protein turnover growth in the whole body, liver and kidney of the rat from the foetus to senility. Biochem J. 1984;217:507–516. doi: 10.1042/bj2170507. [DOI] [PMC free article] [PubMed] [Google Scholar]
- 18.Lewis SE, Kelly FJ, Goldspink DF. Pre- and post-natal growth and protein turnover in smooth muscle, heart and slow- and fast-twitch skeletal muscles of the rat. Biochem J. 1984;217:517–526. doi: 10.1042/bj2170517. [DOI] [PMC free article] [PubMed] [Google Scholar]
- 19.Higashino Y, Tachiyashiki K, Suzuki Y, Shirato K, Imaizumi K. Food-deprivation-induced changes of plasma energy substrate levels in infant, adult and aged rats. Jpn J Physiol. 2003;54(Suppl):S233. [Google Scholar]
- 20.The Physiological Society of Japan Guiding principles of the care and use of animals in the field of physiological sciences. Jpn J Physiol. 2004;54:98. [Google Scholar]
- 21.Sato S, Nomura S, Kawano F, Tanihata J, Tachiyashiki K, Imaizumi K. Effects of the β2-agonist clenbuterol on β1- and β2-adrenoceptor mRNA expressions of rat skeletal and left ventricle muscles. J Pharmacol Sci. 2008;107:393–400. doi: 10.1254/jphs.08097FP. [DOI] [PubMed] [Google Scholar]
- 22.Kawano F, Tanihata J, Sato S, Nomura S, Shiraishi A, Tachiyashiki K, Imaizumi K. Effects of dexamethasone on the expression of β1-, β2- and β3-adrenoceptor mRNAs in skeletal and left ventricle muscles in rats. J Physiol Sci. 2009;59:383–390. doi: 10.1007/s12576-009-0046-6. [DOI] [PMC free article] [PubMed] [Google Scholar]
- 23.Sato S, Nomura S, Kawano F, Tanihata J, Tachiyashiki K, Imaizumi K. Adaptive effects of the β2-agonist clenbuterol on expression of β2-adrenoceptor mRNA in rat fast-twitch fiber-rich muscles. J Physiol Sci. 2010;60:119–127. doi: 10.1007/s12576-009-0075-1. [DOI] [PMC free article] [PubMed] [Google Scholar]
- 24.Imaizumi K, Sato S, Kumazawa M, Arai N, Aritoshi S, Akimoto S, Sakakibara Y, Kawashima Y, Tachiyashiki K. Capsaicinoids-induced changes of plasma glucose, free fatty acid and glycerol concentrations in rats. J Toxicol Sci. 2011;36:109–116. doi: 10.2131/jts.36.109. [DOI] [PubMed] [Google Scholar]
- 25.Nomura S, Ichinose T, Jinde M, Kawashima Y, Tachiyashiki K, Imaizumi K. Tea catechins enhance the mRNA expression of uncoupling protein 1 in rat brown adipose tissue. J Nutr Biochem. 2008;19:840–847. doi: 10.1016/j.jnutbio.2007.11.005. [DOI] [PubMed] [Google Scholar]
- 26.Chandramouli V, Ekberg K, Schumann WC, Kalhan SC, Wahren J, Landau BR. Quantifying gluconeogenesis during fasting. Am J Physiol. 1997;273:E1209–E1215. doi: 10.1152/ajpendo.1997.273.6.E1209. [DOI] [PubMed] [Google Scholar]
- 27.Laffel L. Ketone bodies: a review of physiology, pathophysiology and application of monitoring to diabetes. Diabetes Metab Res Rev. 1999;15:412–426. doi: 10.1002/(SICI)1520-7560(199911/12)15:6<412::AID-DMRR72>3.0.CO;2-8. [DOI] [PubMed] [Google Scholar]
- 28.Johnston D, Alberti KG. Hormonal control of ketone body metabolism in the normal and diabetic state. Clin Endocrinol Metab. 1982;11:329–361. [PubMed] [Google Scholar]
- 29.Casals N, Roca N, Guerrero M, Gil-Gómez G, Ayté J, Ciudad CJ, Hegardt FG. Regulation of the expression of the mitochondrial 3-hydroxy-3-methylglutaryl-CoA synthase gene. Its role in the control of ketogenesis. Biochem J. 1992;283(Pt. 1):261–264. doi: 10.1042/bj2830261. [DOI] [PMC free article] [PubMed] [Google Scholar]


