

Abstract
How do emotional events readily capture our attention? To address this question we used neural tracers to label pathways linking areas involved in emotional and attentional processes in the primate brain (Macaca mulatta). We report that a novel pathway from the amygdala, the brain's emotional center, targets the inhibitory thalamic reticular nucleus (TRN), a key node in the brain's attentional network. The amygdalar pathway formed unusual synapses close to cell bodies of TRN neurons and had more large and efficient terminals than pathways from the orbitofrontal cortex and the thalamic mediodorsal nucleus, which similarly innervated extensive TRN sites. The robust amygdalar pathway provides a mechanism for rapid shifting of attention to emotional stimuli. Acting synergistically, pathways from the amygdala and orbitofrontal cortex provide a circuit for purposeful assessment of emotional stimuli. The different pathways to TRN suggest distinct mechanisms of attention to external and internal stimuli that may be differentially disrupted in anxiety and mood disorders and may be selectively targeted for therapeutic interventions.
Introduction
The inhibitory thalamic reticular nucleus (TRN) is a key node in the brain's circuit for attention (Crick, 1984; Montero, 1997; Weese et al., 1999; Pinault, 2004; McAlonan et al., 2008; Petrof and Brown, 2010). Situated between the thalamus and cortex, the TRN receives projections from all cerebral cortices and their associated thalamic nuclei, but sends inhibitory output only to the thalamus. Through this circuitry, the TRN is in a strategic position to filter signals at an early stage of processing and gate thalamocortical communication.
Projections from sensory and motor cortices and their thalamic nuclei map topographically on TRN (for review, see Guillery and Harting, 2003; Pinault, 2004; Zikopoulos and Barbas, 2007a). In sharp contrast, some prefrontal cortices have widespread projections that extend beyond the frontal sector of TRN to sites innervated by sensory and motor cortices (Zikopoulos and Barbas, 2006). This unique type of projection is found for dorsolateral prefrontal cortex (DLPFC) and posterior orbitofrontal cortex (pOFC), and their associated mediodorsal thalamic nucleus (MD), which have a key role in cognition, emotion and memory. Through these projections, the DLPFC and pOFC may control the passage of signals through the thalamus to shift attention to relevant stimuli and suppress distracters (Barbas and Zikopoulos, 2007).
Emotionally significant events capture our attention quickly, but the underlying circuit mechanism is not well understood. The amygdala is a key structure for processing signals with emotional import and is connected with both MD and the orbitofrontal cortex (for review, see Ghashghaei et al., 2007; Barbas, 2007). Based on the strong linkage among these structures, we reasoned that the amygdala may also project to TRN to help direct attention to emotional stimuli and expedite their access to the cortex. Here we show that axons from the amygdala terminate widely in TRN, in a pathway not described previously in any species. Moreover, we provide evidence of specialized synapses, suggesting that the amygdala may act in concert with the orbitofrontal cortex and its principal thalamic nucleus (MD) to rapidly assess and transfer emotionally significant stimuli to the cortex and veto access to distractions. This robust tripartite circuitry may add another layer to the control of the flow of information for emotions and the ability to attend to relevant signals and ignore the myriad of external and internal stimuli that intrude on our senses, thoughts, and feelings.
Materials and Methods
Subjects
Experiments were conducted on 10 adult rhesus monkeys (Macaca mulatta; three male, seven female) in accordance with the NIH Guide for the Care and Use of Laboratory Animals. The experiments were approved by the Institutional Animal Care and Use Committees at Boston University School of Medicine, Harvard Medical School, and New England Primate Research Center. Procedures were designed to minimize animal suffering and reduce the number of animals used.
Surgical procedures, injection of neural tracers, and tissue preparation
Before injection of neural tracers we obtained scans of each brain using magnetic resonance imaging (MRI) to calculate the stereotaxic coordinates for each injection. One week after the MRI, the monkeys were anesthetized with ketamine hydrochloride (10–15 mg/kg, i.m.) followed by gas anesthetic (isoflurane) until a surgical level of anesthesia was accomplished. Surgery was performed under aseptic conditions while heart rate, muscle tone, respiration, and pupillary dilatation were closely monitored. The monkeys were placed in a stereotaxic apparatus, and a small region of the cortex was exposed.
Distinct neural tracers were injected in the right and left hemispheres, as indicated in Table 1 (for a map of several injection sites, see Fig. 1). We injected tracers in posterior orbitofrontal cortices [orbitofrontal area 13 and orbital proisocortex (OPro)], the amygdala [basomedial (BM), basolateral (BL), and cortical nuclei (Co)], and the thalamic MD nucleus, guided by stereotaxic coordinates from the MRI scans. The halo from tracer injections in the amygdala included in some cases the anterior amygdalar area (AAA), the central nucleus (Ce), the intercalated masses (IM), and the medial nucleus (Me), but the labeling was not different from the cases with well-defined injections restricted in BM, BL, and Co. We injected the anterograde tracers [10 kDa molecular weight (MW)] biotinylated dextran amine (BDA), fluoroemerald (FE; dextran fluorescein), fluororuby (FR; dextran tetramethylrhodamine), cascade blue (CBl), and Lucifer yellow (LY; dextran, Lucifer yellow, anionic, lysine fixable). All dyes were from Invitrogen and were diluted to 10 mg/ml. These tracers also act as retrograde tracers (especially in the 3 kDa MW), but the extent of retrograde labeling in our material was restricted to sporadic labeling of cell bodies and proximal dendrites of projection neurons, and the tracer did not enter axon collaterals, as described previously (Reiner et al., 2000; Zikopoulos and Barbas, 2006). In some cases we injected the retrograde tracer fast blue (FB) in the thalamus (MD; 1% solution, volume of 0.3 μl; Sigma). Transsynaptic transport of these tracers has not been observed. In each case, the tracer was injected in two to four penetrations and, for the cortical injections, at a depth of 1.2–1.6 mm below the pial surface. After injection, the needle was left in place for 10–15 min to allow the dye to penetrate at the injection site and prevent upward diffusion of the dye upon retraction of the needle. All injections were restricted to the regions of interest, with little or no damage of the surrounding tissue and minimal spread of the dyes. As an added control, we examined overall projections from pOFC, MD, and the amygdala and their laminar pattern in the cortex and confirmed expected connectivity patterns, as highlighted in Results.
Table 1.
Cases, hemisphere injected, type of neural tracers used, injection sites, and cases used for light or electron microscopy
| Case | Hemisphere | Tracer | Type | Injection site (Core; halo) | LM/EM |
|---|---|---|---|---|---|
| AZ | Right | BDA | Anterograde | Amygdala (BM, BL) | # |
| BB | Left | BDA | Anterograde | Amygdala (BM, BL; AAA) | # |
| BB | Right | BDA | Anterograde | Amygdala (Co, BM, BL; AAA, IM) | # |
| BD | Left | BDA | Anterograde | Amygdala (BL; Ce) | # |
| BD | Right | BDA | Anterograde | Amygdala (Me, Co, BM, BL) | # |
| BL | Right | FR | Anterograde | Amygdala (Co) | #,* |
| BL | Left | FR | Anterograde | Amygdala (BL) | #,* |
| BM | Left | FE | Anterograde | Amygdala (BL) | # |
| BK | Right | CBl | Anterograde | OPro | # |
| BK | Left | FE | Anterograde | OPro | # |
| BJ | Right | LY | Anterograde | OPro | # |
| BI | Left | LY | Anterograde | Posterior 13 | # |
| BH | Right | LY | Anterograde | 13 | # |
| BM | Left | FR | Anterograde | OPro | # |
| BB | Left | FE | Anterograde | Thalamus (MDmc) | # |
| BD | Left | FB | Retrograde | Thalamus (MDmc) | # |
| BG | Right | FB | Retrograde | Thalamus (MD) | # |
13, Orbitofrontal area 13.
#Light microscopy (LM);
*EM.
Figure 1.
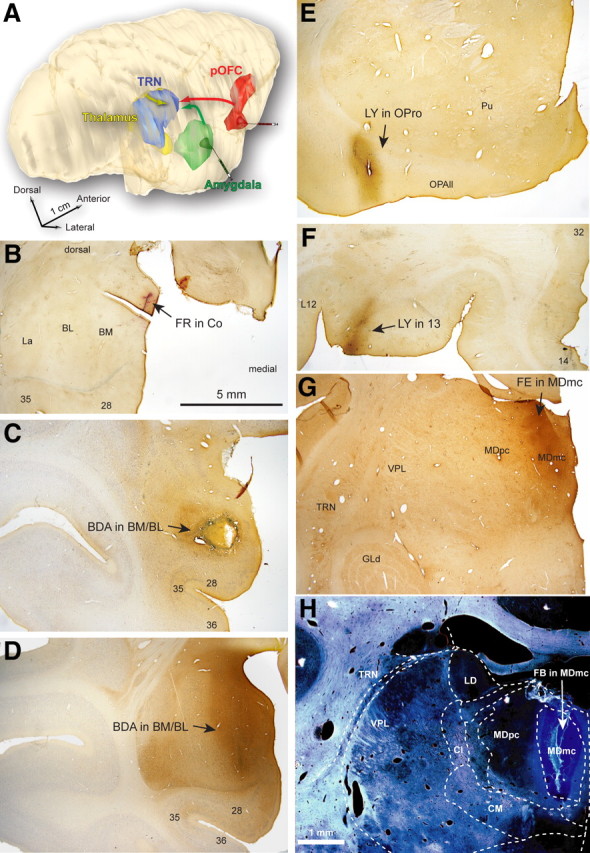
Experimental design and representative tracer injections. A, Bidirectional tracers were injected in the amygdala (green), pOFC (red), and MD (yellow) to study the distribution and overlap of pathways terminating in TRN (blue). The 3D reconstruction of a rhesus monkey brain from serial sections shows the relative position of areas included in the study. B–H, Low-magnification bright-field images of sites injected with neural tracers in amygdalar nuclei (Co, BM, and BL; B–D), orbitofrontal cortex (area OPro, orbitofrontal area 13; E, F), and in the MDmc (G, H) (Table 1). Areas: 28, entorhinal area 28; 35, perirhinal area 35; 36, perirhinal area 36. Cl, Centrolateral nucleus; CM, centromedian nucleus; GLd, dorsal–lateral geniculate nucleus; LD, lateral–dorsal nucleus; OPAII, orbital periallocortex; Pu, putamen; VPL, ventral–posterior–lateral nucleus. Scale bars: (in B) B–F, 5 mm; (in H) G, H, 1 mm.
After a survival period of 18 d, the animals were anesthetized with a lethal dose of sodium pentobarbital (>50 mg/kg, to effect) and transcardially perfused with 4% paraformaldehyde or, for electron microscopy, 4% paraformaldehyde and 0.2% glutaraldehyde in 0.1 m phosphate buffer (PB), pH 7.4. The brains were removed from the skull, photographed, and cryoprotected in graded solutions of sucrose (10–30%) in 0.01 m PBS to preserve the fine structure of the tissue. Brains were then frozen in −75°C isopentane (Fisher Scientific) and cut on a freezing microtome in the coronal plane at 50 μm to produce 10 series. In cases with injection of fluorescent tracers, one series was mounted on glass slides and coverslipped to map labeled neurons and terminals. The borders of amygdalar and thalamic nuclei and the cortex were determined in Nissl- and AChE-stained sections.
Immunohistochemistry for light microscopy
Free-floating sections were incubated in 0.05 m glycine and preblocked in 5% normal goat serum and 5% bovine serum albumin with 0.2% Triton X-100. In cases with BDA injections, sections were rinsed in 0.01 m PBS and incubated for 1 h in an avidin-biotin HRP complex (AB Kit; Vector laboratories; diluted 1:100 in 0.01 m PBS with 0.1% Triton X-100). The sections were then washed and processed for immunoperoxidase reaction using diaminobenzidine (DAB; Zymed). Sections were mounted, dried, and coverslipped with Permount or Entellan (Merck).
In some cases with FE, FR, CBl, and LY injections, we used polyclonal antibodies (anti-fluorescein/Oregon Green, anti-tetramethylrhodamine, anti-cascade blue, and anti-LY, 1:800; Invitrogen) to convert the fluorescent tracers and visualize them by the peroxidase-catalyzed polymerization of DAB. Since in most cases there was also a BDA injection in one of the brain hemispheres, we used an Avidin-Biotin blocking kit (Vector Labs) to saturate biotin binding sites from BDA, and then used a biotinylated secondary antibody and an avidin–biotin–peroxidase kit to label axon terminals with DAB. In some experiments we used nonbiotinylated polyclonal anti-rabbit secondary antibody followed by tertiary anti-rabbit solution (PAP method, 1:200; Sternberger Monoclonals) to avoid cross-reaction with the BDA, which yielded similar labeling.
To identify TRN inhibitory neurons, we used antibodies against the neurotransmitter GABA or the calcium binding protein parvalbumin (PV), which labels inhibitory neurons in TRN. The tissue was incubated overnight in primary antibody for GABA (1:1000, mouse monoclonal, Sigma; or 1:1000, rabbit polyclonal, Diasorin) or PV (1:2000; mouse monoclonal, Millipore Bioscience Research Reagents; or rabbit polyclonal, Swant). The sections were rinsed in PBS, incubated for 4 h with a goat anti-rabbit (for GABA and PV polyclonal) or anti-mouse IgG (for GABA and PV monoclonals) conjugated with the fluorescent probes Alexa Fluor 488 (green) or 568 (red; 1:100; Invitrogen), and thoroughly rinsed with PBS. In some cases, for PV labeling a biotinylated secondary antibody and an avidin–biotin–peroxidase kit was used to label PV+ structures with DAB. To exclude nonspecific immunoreactivity, we performed control experiments with sections adjacent to those used in the experiments described above. These included omission of the primary antibodies and incubation with all secondary or tertiary antisera. Control experiments resulted in no immunohistochemical labeling.
Preembedding immunohistochemistry for electron microscopy
Sections treated for bright-field BDA, FE, FR, CBl or LY were processed for electron microscopy. We used the protocols described above; however, Triton X-100 concentration in all solutions was reduced to 0.025%. To determine the relationship of labeled boutons from pOFC and the amygdala with inhibitory TRN neurons, we double labeled sections using antibodies against GABA or PV and preembedding immunohistochemistry, and visualized label with gold-conjugated anti-mouse or anti-rabbit secondary antibodies (1:50; gold particle diameter, 1nm; GE Healthcare). To prevent diffusion of the gold particles, tissue was postfixed in a variable wattage microwave oven (Biowave; Pelco) with 6% glutaraldehyde at 150 W. Labeling was intensified with the use of the GE Healthcare silver enhancement kit (IntenSE). Tissue sections were mounted on slides and quickly viewed under the light microscope, and small blocks of sections with anterograde and GABA or PV label were cut under a dissecting microscope, postfixed in 1% osmium tetroxide with 1.5% potassium ferrocyanide in PB, washed in buffer (PB) and water, and dehydrated in an ascending series of alcohols. While in 70% alcohol, sections were stained with 1% uranyl acetate for 30 min. Subsequently, sections were cleared in propylene oxide and embedded in Araldite at 60°C. Serial ultrathin sections (50 nm) were cut with a diamond knife (Diatome) using an ultramicrotome (Ultracut; Leica) and collected on single slot grids for viewing with a transmission electron microscope (JEOL 100CX).
Bouton population analysis and density estimation
We analyzed anterograde labeling in the TRN at high magnification (1000×) using unbiased stereological methods as described previously (Zikopoulos and Barbas, 2006). Power and progressive mean analyses were used to determine the systematic, random sampling fraction, which was 1/100 of the total volume of the region studied and resulted in measuring the morphological characteristics of >2000 labeled bouton profiles in each case. In four cases, we sampled labeling in TRN exhaustively to map the distribution and overlap of labeled boutons and measure their size. These cases included tracer injections in BL/BM (case BB), Co (case BK), OPro (case BK), and MD (case BG). The morphological characteristics measured were the major diameter and surface area.
We estimated the number of anterogradely labeled boutons in TRN using the unbiased stereological method of the optical fractionator as described previously (Zikopoulos and Barbas, 2006), with the aid of a semiautomated commercial system (StereoInvestigator; MicroBrightField). Large and small boutons were counted separately and systematically distinguished based on the results of the preceding bouton population analyses. The sampling fraction was 1/160 of the total volume of TRN and was achieved by setting the disector counting frame at 100 × 100 μm and the grid size at 400 × 400 μm. The total number of boutons counted in the systematic random samples was multiplied with the denominator of the sampling fraction to provide an estimate of the total number of labeled boutons. The volume of TRN was estimated by multiplying the number of measured disectors with the same denominator and was used to assess the density of labeled boutons in each case by dividing the total number of boutons by the corresponding TRN volume. We normalized data by expressing the density of large and small boutons as a percentage of the total density of all boutons mapped in each case.
Imaging, 3D reconstruction, and overlap analysis
Light and confocal microscopy.
We outlined brain sections, placed cytoarchitectonic borders of TRN, and mapped labeled pathways in each case with the aid of a commercial computerized microscope system and motorized stage (Neurolucida; MicroBrightField). The procedure involves setting a reference point for every brain hemisphere analyzed, and as a result the outlines are automatically registered and aligned to the actual corresponding sections, retaining information about the 3D coordinates of every mark or trace. We used these sections and outlines for stereological analyses of the anterograde labeling. We also mapped retrogradely labeled neurons in the TRN directed to MD and marked their stereotaxic coordinates.
To compare the topography and distribution of anterograde and retrograde labeling across cases and exhibit their overlap in TRN, we reconstructed in three dimensions the entire nucleus using the free, open source software Reconstruct (Fiala, 2005). We used the reconstructed nucleus from a representative case as reference, as described previously (Zikopoulos and Barbas, 2006). This process was possible because of the stereotypy of TRN among animals regardless of overall brain size. We found previously that TRN has similar shape and position in the thalamus across animals and contains ∼1,000,000 neurons per brain hemisphere (Zikopoulos and Barbas, 2006).
We imported the reference outlines along with outlines containing 3D information about the topography of labeling from all other cases in Reconstruct and coregistered and aligned them to generate 3D models. As a result, all markers and traces were registered stereotaxically and superimposed on the 3D models. This method made it possible to compare the relative distribution of different cortical, amygdalar, and thalamic axon terminations in TRN, and labeled TRN neurons that project to MD. To assess the accuracy of the relative overlaps, we injected the amygdala and pOFC of the same hemisphere in one case (BM) and mapped the two pathways in TRN using absolute stereotaxic coordinates. The independent analyses yielded similar results.
We acquired image stacks of several focal planes in each area of interest resulting in pictures with high depth of field of 50-μm-thick sections focused throughout the extent of their z-axes. We viewed sections under high magnification at a confocal laser microscope (Olympus Fluoview) and captured stacks of images. We applied 3D-deconvolution algorithms to images before analysis with the aid of Autodeblur (Media Cybernetics). In case BM, we assessed the overlap/colocalization of amygdala and pOFC pathways in TRN using three independent methods. Confocal red–green–blue (RGB) stacks, in which each pathway appeared in one channel, were imported in ImageJ, where we manually selected and measured the surface areas of the region that contained signal and the region of overlap (the percentage equaled the region of overlap divided by the region that contained signal). Using the same principle, we independently estimated colocalization using the “ColocalizeRGB” plug-in in ImageJ. In a third approach, used in all cases, we used discriminant analysis to assess the similarity of the Euclidean distances of relative stereotaxic coordinates for each labeled bouton within and between pathways. Stacks were reconstructed in 3D and rotated, in 1° increments in the x, y, or z-axis, using the ImageJ “3D-project” plug-in, to visualize overlaps. Photomicrographs were prepared with Adobe Photoshop (Adobe Systems), and overall brightness and contrast were adjusted without retouching.
In case BM, with injection of distinct tracers in the amygdala and pOFC of the same hemisphere, we visualized close appositions of amygdalar and pOFC terminals onto the same TRN neurons, using triple-labeled tissue to capture confocal RGB stacks. Terminations from the amygdala were labeled with FE (green fluorescence) and they appeared exclusively in the green channel. Boutons from pOFC were labeled with FR, fluoresced red, and appeared exclusively in the red channel. Inhibitory TRN neurons were labeled for GABA and PV, fluoresced yellow, and appeared in both red and green channels. We separated the three channels in ImageJ and isolated the red, green, and yellow colors using the “ColocalizeRGB” plug-in. We then subtracted yellow from the red and green channels to filter the terminations from the two pathways and recreated an RGB image with the yellow color (labeled TRN neurons) converted to the blue channel (see Fig. 2G).
Figure 2.
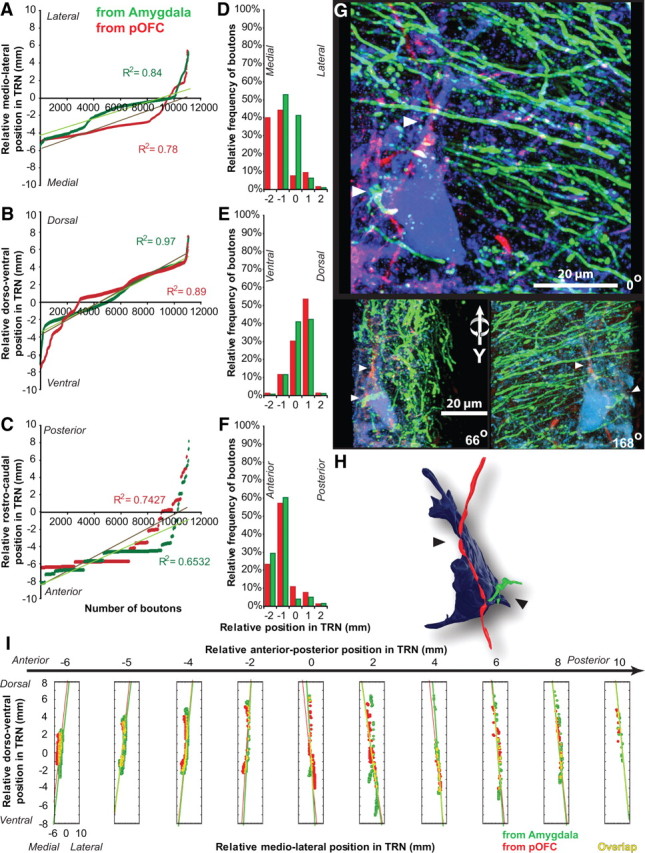
Overlap of pOFC and amygdalar pathways in TRN. A–C, Relative position of labeled terminals from the amygdala (green) and pOFC (red) in the mediolateral (A), dorsoventral (B), and anteroposterior (C) axes of TRN; linear fits show similarities in the distribution of the two pathways. D–F, Relative proportions of labeled terminals from the amygdala (green) and pOFC (red) in the mediolateral (D), dorsoventral (E), and anteroposterior (F) axes of TRN show similarities in frequency distribution. G, 3D-projected confocal stack, rotated on the y-axis, shows closely apposed amygdalar (green) and pOFC (red) terminals onto the same TRN neuron (blue). White arrowheads indicate some likely sites of contact. H, Closely apposed terminals on TRN neuron reconstructed from G. Black arrowheads indicate likely sites of contact. I, Composite 3D plot collapsed into two dimensions shows the distribution and overlap (yellow) of labeled terminals from the amygdala (green) and pOFC (red). Each box represents a specific anteroposterior relative coordinate. The y-axis of each box indicates relative dorsoventral coordinates; the x-axis of each box indicates the relative mediolateral coordinates in TRN.
Electron microscopy.
We viewed labeled boutons emanating from amygdalar axons that formed synapses with TRN neurons (n = 79) and neighboring unlabeled boutons (n = 200) at high magnification (10,000× to 30,000×) and followed 26 of them throughout their extent (between 10 and 80 serial ultrathin sections). We captured high-resolution images with a digital camera attached to the electron microscope (ES1000W; Gatan), and imported them as a series in Reconstruct and aligned them. Boutons, postsynaptic densities and postsynaptic structures (e.g., dendrites) were traced. Section thickness was calibrated through measurements of the diameter of mitochondria as described previously (Zikopoulos and Barbas, 2006). We reconstructed structures in 3D and calculated their volumes, surface areas, and diameters. We additionally estimated the major and minor diameters of boutons from miniseries (2D analysis; n = 53) and used the average radius (r) of each bouton to estimate corresponding volumes, assuming spherical shape (volume, 4/3πr3). We used all estimated volumes and diameters from the 2D and 3D EM analyses for regressions and correlations. We used classic criteria for identifying synapses and profiles as described previously (Zikopoulos and Barbas, 2006).
Statistical analysis
Data were evaluated with Statistica (StatSoft) through scatter and frequency distribution plots and k-means cluster analysis with parameters set to maximize initial between-cluster distances. χ2 and Kolmogorov–Smirnov tests were used to examine bouton size distributions. Linear regression was conducted using the least-squares approximation. We used ANOVA to test for differences among bouton populations and densities, and p values of <0.01 were taken as statistically significant. Post hoc analyses using the Bonferroni/Dunn test (all means) were performed to identify possible differences between groups.
Results
Injection sites and overview of connection patterns of pOFC with the thalamus and amygdala
Injection sites were reconstructed from serial coronal sections. Control analyses were used to determine whether injections of tracers were restricted to the intended sites. One analysis was based on laminar patterns of cortical connections to the thalamus and the amygdala. Another analysis included the patterns of distribution of connections from pOFC to the thalamus or the amygdala. Both control analyses were compared with findings from the literature.
Data on connections were obtained from 10 animals after injection of distinct anterograde and retrograde tracers in the basal and cortical nuclei of the amygdala, the thalamic MD, and the pOFC, totaling 17 injection sites (Table 1). The tracers were largely restricted to the intended nuclei, with a light halo seen in neighboring nuclei in some cases, but not in fiber tracts above or near the injection sites. For deep brain injections, there was no evidence of leakage of tracer in overlying cortical areas, confirmed by the absence of labeled neurons in upper layer 2 after injection of dyes in the amygdala (Ghashghaei et al., 2007), or in layers 2 and 3 after thalamic injections (Xiao et al., 2009). This was contrasted by densely distributed labeled neurons in the upper part of layer 5, after injection of tracers in the amygdala, and in layer 6, and to a lesser extent layer 5, after injections in MD (Jones, 2007; Xiao et al., 2009). There was no evidence of spread of the dyes to other subcortical structures.
The halo from tracer injections in the amygdala impinged onto the inhibitory amygdalar nuclei Ce or IM, but we did not observe labeling of inhibitory GABAergic amygdalar terminations in the thalamus with the light or electron microscope. Previous findings with tracer injections in Ce, and especially its medial subdivision, which is the main inhibitory output of the amygdala, have shown that there are significant projections to the thalamus (Price and Amaral, 1981). However, in our material the labeling was similar as in cases with well-defined injections in BM, BL, and Co, suggesting that there was no tracer uptake from neurons within the halo site in Ce or IM.
After anterograde tracer injections in pOFC, we found typical distribution patterns of labeling, which included robust axon terminations in MD (mainly its magnocellular portion) and in the amygdala, mainly in the BL, BM, and IM nuclei (Goldman-Rakic and Porrino, 1985; Giguere and Goldman-Rakic, 1988; Cavada et al., 2000; Ghashghaei and Barbas, 2002). Injection of tracers in MD produced the expected dense anterograde labeling predominantly in the middle layers, but also in the superficial layers of prefrontal cortices (Giguere and Goldman-Rakic, 1988). Tracer injections in the magnocellular part of the MD (MDmc) produced stronger labeling in limbic prefrontal areas including pOFC, whereas injections in the parvicellular portion of the MD resulted in strong labeling of lateral prefrontal areas, in agreement with previous reports (Goldman-Rakic and Porrino, 1985; Giguere and Goldman-Rakic, 1988; Barbas et al., 1991; Dermon and Barbas, 1994; Xiao et al., 2009). Anterograde tracer injections in the amygdala resulted in widespread and robust labeling of temporal cortical areas as well as medial and orbital prefrontal areas (Ghashghaei et al., 2007; Höistad and Barbas, 2008). Amygdalar projections to the thalamus included anterior, midline, and intralaminar nuclei, with robust labeling in nucleus reuniens and MD, in agreement with previous reports in rodents and primates (Porrino et al., 1981; Aggleton and Mishkin, 1984; McDonald, 1987; Petrovich et al., 1996; McKenna and Vertes, 2004).
Robust projections from the amygdala terminate in TRN
We first investigated whether labeled pathways from the basal and cortical nuclei of the amygdala project to the inhibitory TRN in rhesus monkeys. Figure 1 summarizes the essence of our experimental approach. We double and triple labeled coronal sections through the TRN to visualize simultaneously labeled pathways from the amygdala and markers of inhibitory neurons in TRN, as described previously (Zikopoulos and Barbas, 2006).
We found robust pathways from the amygdala to TRN, which had not been described previously in any species. One pathway originated from the basal nucleus and another from the cortical nuclei of the amygdala. The two pathways followed partially different trajectories on their way to the thalamus, but the distribution of their terminations in TRN was similar. The vast majority of fibers from both pathways exited the amygdala anteriorly and coursed dorsally toward the inferior thalamic peduncle or the external capsule, and then entered the thalamus mostly anteriorly. Axon fibers emanating from the ventral parts of the basolateral amygdala traveled along the ventral amygdalofugal pathway and then coursed laterally toward the external capsule before entering the thalamus throughout its anteroposterior extent. These trajectories from the amygdala to TRN are consistent with the course of the known projections from the amygdala to the mediodorsal thalamic nucleus (Porrino et al., 1981; Aggleton and Mishkin, 1984). It is not known whether amygdalar axon terminals in TRN are collaterals of the amygdalothalamic pathways that target MD, anterior, midline, and intralaminar nuclei (Porrino et al., 1981; Aggleton and Mishkin, 1984; McDonald, 1987; Petrovich et al., 1996). It is not clear why the robust pathway from the amygdala to TRN was not mapped in previous studies. However, the limited number of studies with injection of tracers in the amygdala in macaque monkeys used anterograde or bidirectional tracers (3H amino acids or horseradish peroxidase-wheat germ agglutinin), which do not label boutons and do not provide the necessary resolution to identify terminations from the amygdala to TRN.
Most axon boutons from the amygdala (∼70%) terminated in the anterior part of TRN within the frontal, limbic, and motor sectors of the nucleus (Fig. 2A–F). However, a significant proportion of amygdalar terminations spread throughout the central and posterior parts of TRN as well, within the sensory sectors of the nucleus (Figs. 2, 3). Most terminations were concentrated on the medial and dorsal part of TRN (Fig. 2).
Figure 3.
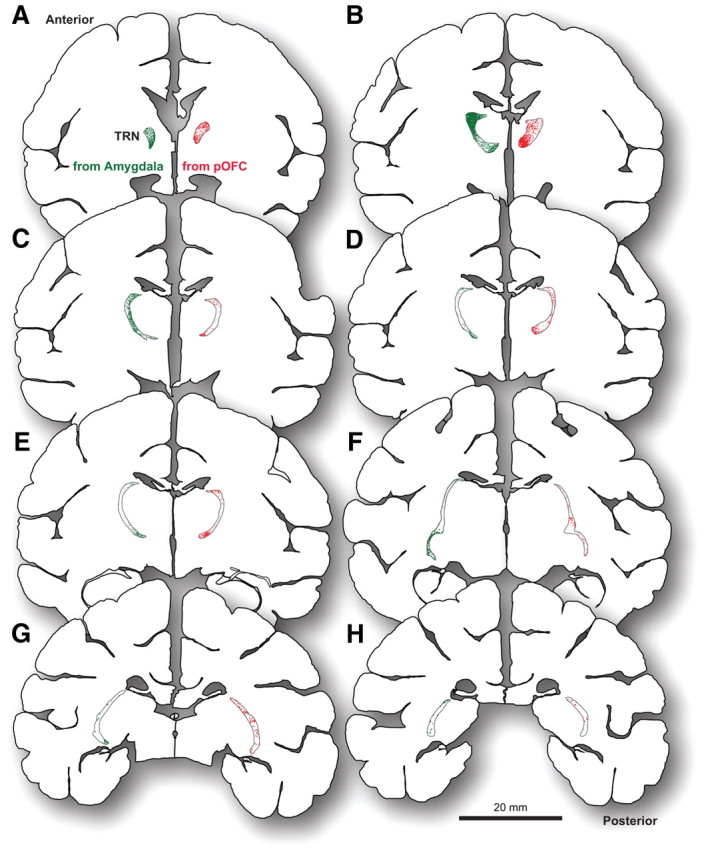
Widespread axon terminations from pOFC and amygdala in TRN. A–H, Outlines of series of coronal sections from a reference case show labeled boutons from different tracer injections superimposed by their relative stereotaxic coordinates. Pathways from pOFC (red) and the amygdala (green) terminated widely throughout the anteroposterior extent of TRN (anterior tip of TRN, A; posterior tip of the TRN, H). Each dot represents one plotted axon terminal.
Pathways from the amygdala, pOFC, and MD overlap in TRN
Next we investigated whether a pathway from pOFC, which also innervates TRN (Zikopoulos and Barbas, 2006), overlaps with projections from the amygdala (Fig. 1). This experiment is based on evidence that the amygdala and pOFC are directly and robustly interconnected in circuits involved in emotional processing (for review, see Barbas and Zikopoulos, 2006).
The terminations from amygdala and pOFC in TRN had a high degree of similarity. Like projections from the amygdala, most axon terminals from pOFC in TRN were found in the anterior part of the nucleus. A smaller but significant proportion of terminations spread throughout the central and posterior regions of TRN, in agreement with our previous findings (Zikopoulos and Barbas, 2006) (Figs. 2A–F, 3). The projections from pOFC and the amygdala also had a similar strong bias for the medial and dorsal aspects of TRN (Fig. 2).
We reconstructed the TRN in three dimensions to conduct a point-by-point comparison of the distribution and relative topography of labeled axon terminals from the amygdala and pOFC. This analysis revealed an estimated overlap of 30% (Figs. 2I, 3, 4A,B), which was biased for the anterior TRN. In central and posterior TRN sectors, the overlap of projections from the amygdala and pOFC was most pronounced in dorsal and ventral parts (Figs. 3, 4A,B). Discriminant analysis of the estimated Euclidean distances of every plotted terminal within and between the two pathways revealed a high degree of similarity (44 ± 3%). In other words, based on their relative x, y, z coordinates, axon terminals from the amygdala and pOFC were largely intermingled (Fig. 2I). In one case, with injection of a different fluorescent anterograde tracer in the pOFC and amygdala of the same hemisphere, we observed closely apposed terminals from pOFC and amygdala on the same TRN neurons (Fig. 2G,H).
Figure 4.
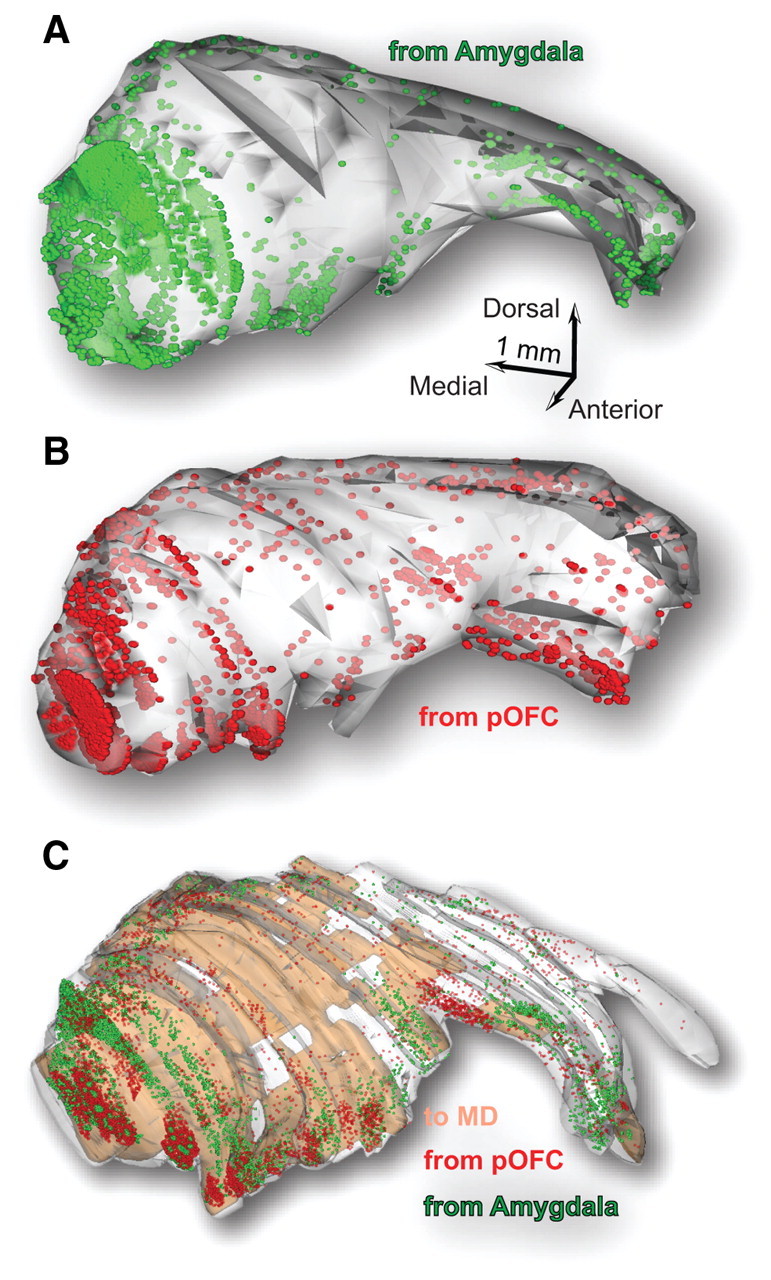
Map of TRN reconstructed in 3D shows terminations from the amygdala, pOFC, and MD. A, B, Serial sections were used to reconstruct the TRN in three dimensions and map terminals from the amygdala (green; A) and the pOFC (red; B) in each case. C, The relative coordinates of these pathways were used to superimpose all plotted terminals from the amygdala and pOFC and the TRN neurons that project to MD (brown shading) onto a reference 3D model of the TRN. The 3D map shows the widespread distribution of labeling and sites of high or low overlap.
We then investigated whether axon terminations from the amygdala and pOFC were localized at TRN sites that are also connected with the MD. This experiment was based on studies showing that the amygdala projects to the medial (magnocellular) part of MD, which sends a robust projection to orbitofrontal cortex (Porrino et al., 1981; Aggleton and Mishkin, 1984; Russchen et al., 1987; Barbas et al., 1991; Dermon and Barbas, 1994; Miyashita et al., 2007; Jones, 2007; Xiao et al., 2009). The MD, therefore, is the primary thalamic nucleus for both amygdala and pOFC. For this analysis, we examined terminations from MD in TRN and also plotted the distribution of TRN neurons projecting to MD. Labeled axon terminals from MD (input to TRN) and neurons projecting to MD (TRN output) were most prevalent in the anterior and dorsal half of the nucleus, but some were also found in its ventral part. Neurons in TRN that projected to MD originated from a wide region, encompassing the first three quarters of the nucleus. Axon terminals from MD had a similarly widespread distribution in TRN.
We used relative anatomical coordinates to reconstruct TRN and overlay in 3D terminals from the amygdala, pOFC, and retrogradely labeled neurons that projected to MD. This analysis revealed that prefrontal and amygdalar axons terminated primarily in TRN sectors that were reciprocally connected with MD, and especially its magnocellular part (Fig. 4C). The overlap was more extensive in the anterior and dorsal parts of the first three quarters of TRN (Fig. 4C).
It should be noted that the relative overlap of these projections in TRN depends on the relative density and morphology of TRN neurons as well. The relative density of TRN neurons was ∼25% higher in central and posterior sectors compared to anterior sectors. We estimated that the average surface area profile of TRN neurons and their visible dendritic tree in 50-μm-thick sections was ∼20,000 μm2, measured in tissue labeled for PV or the neurofilament protein SMI-32. This areal profile ranged from 30,000 μm2 in the spacious anterior TRN sectors down to 10,000 μm2 in the cramped central and posterior sectors, and was correlated with the attenuation of the overlap from amygdala, pOFC, and MD terminations from anterior to posterior TRN sectors (R2 = 0.75; p = 0.004).
Dual mode of terminations from amygdala, pOFC, and MD in TRN
We then studied features of pathways that are correlated with synaptic efficacy, including density, type, and size of terminals, and number of synaptic vesicles and mitochondria (Murthy et al., 1997; Germuska et al., 2006; Zikopoulos and Barbas, 2007b; Medalla and Barbas, 2009). Axon terminals from the amygdala, pOFC, and MD were of both the en passant and terminaux types. We constructed a detailed population profile of terminals and synapses in TRN using stereological sampling and measurement of the major diameter, perimeter, and cross-sectional surface area of at least 2000 labeled profiles per case at the light microscope. Most boutons were small (diameter, <1.3 μm) and spherical in shape, but a significant number were large (diameter, >1.3 μm, <6 μm), and some had ovoid or irregular shapes. Scatter and frequency distribution plots showed that the population of boutons covered a wide range of sizes (diameter, >0.1 μm, <6 μm) (Figs. 5, 6A–C). Unsupervised cluster analysis segregated boutons into two distinct populations (p = 0.00001), one corresponding to small terminals (mean diameter ± variance, from amygdala, 0.74 μm ± 0.08; from pOFC, 0.80 μm ± 0.05; from MD, 0.71 μm ± 0.05) and the other corresponding to large boutons (diameter ± variance, from amygdala, 1.91 μm ± 0.4; from pOFC, 1.71 μm ± 0.19; from MD, 1.69 μm ± 0.15) (Figs. 5, 6A–C).
Figure 5.
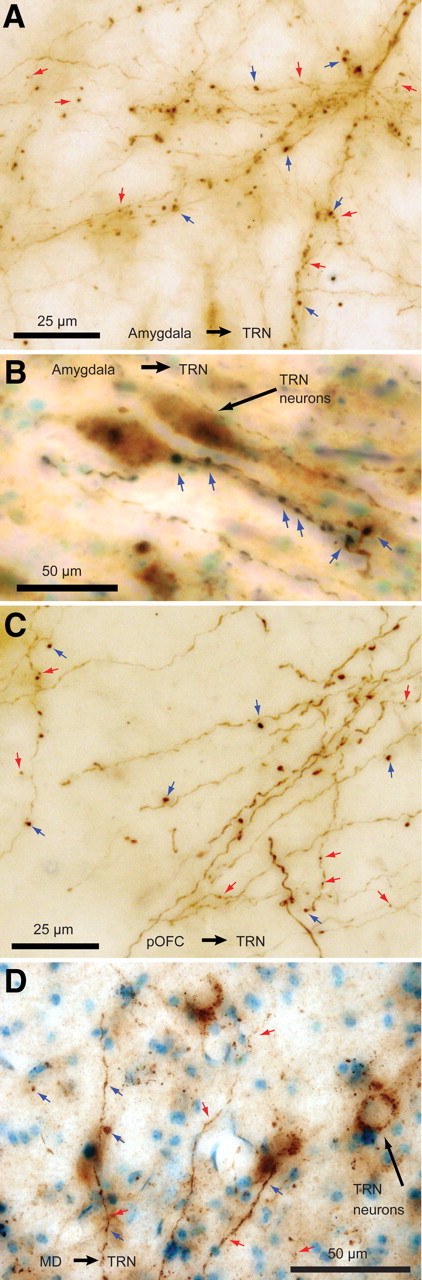
Labeled pathways from the amygdala, pOFC, and MD terminated with large and small boutons in the TRN. A, B, BDA-labeled fibers from the amygdala with large (blue arrows) and small (red arrows) boutons. Two TRN neurons are visible in B (long black arrow), surrounded by large axon terminals from the amygdala closely apposed to the cell bodies and proximal dendrites. C, Labeled fibers from pOFC. D, Labeled fibers from MD in the TRN.
Figure 6.
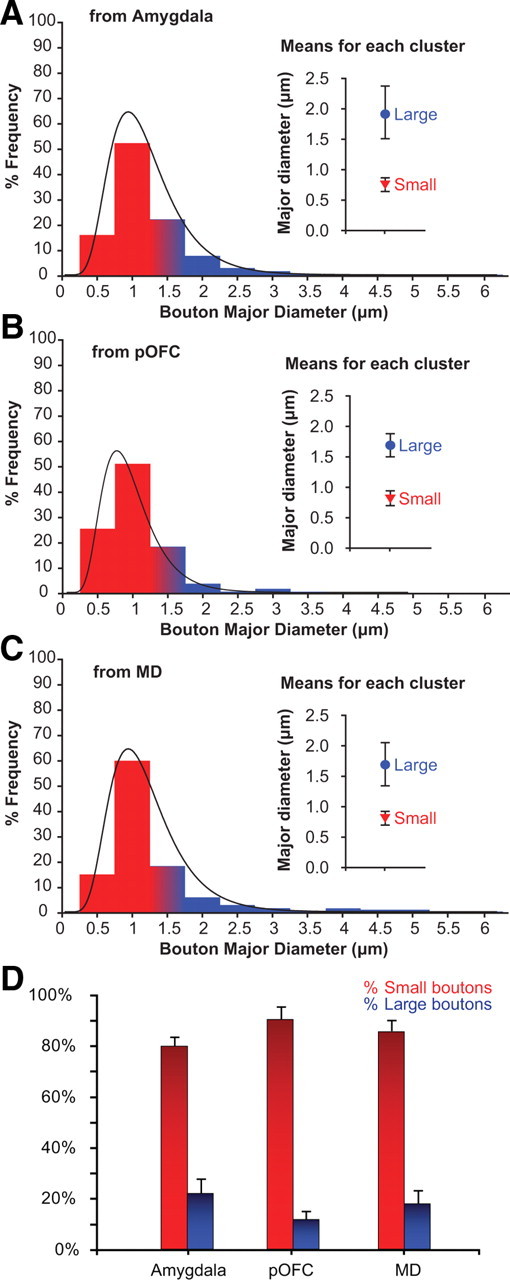
Comparison of bouton populations from the amygdala, pOFC, and MD in the TRN. A–C, Size distribution frequency of boutons in TRN from axons originating in the amygdala (A), pOFC (B), and MD (C). Results from cluster analysis of the diameter of the boutons are shown on the right. The population from the amygdala was skewed to the right, indicating more large terminals. D, Proportion of large and small boutons in each pathway shows a higher proportion of large boutons from the amygdala. Error bars indicate SEM.
Morphological comparison of terminals from the amygdala, pOFC, and MD revealed that all labeled bouton populations found in TRN were similar. However, the proportion of large and small terminals in different pathways varied and can provide useful information about the robustness, efficacy, and level of activity of a pathway (Pierce and Lewin, 1994; Murthy et al., 2001; Franks et al., 2003; Germuska et al., 2006; Zikopoulos and Barbas, 2006, 2007b; Medalla and Barbas, 2009, 2010; Bunce and Barbas, 2011). For example, several studies have shown that thalamic terminations in TRN or in the cortex elicit strong and reliable activation of targeted neurons, which can be explained, in part, by their large size and proximal synapses (Lisman, 1997; Rockland et al., 1999; Swadlow et al., 2002; Fuentealba and Steriade, 2005; Lam and Sherman, 2005; Jones, 2007). Stereological analysis revealed that most of the boutons from amygdala, pOFC, and MD that terminated in TRN were small (from amygdala, 80%; mean density, 18,225 boutons per cubic millimeter; from orbitofrontal cortex, 90%; mean density, 12,695 boutons per cubic millimeter; from MD, 85%; mean density, 18,198 boutons per cubic millimeter). However, significant proportions of boutons were large (Fig. 6). The highest proportion of large boutons was from the amygdala (20% of the population; mean density, 2451 boutons per cubic millimeter), which was twofold higher than for the orbitofrontal pathway (10% of the population; mean density, 1036 boutons per cubic millimeter). The proportion of large boutons from MD was in between the amygdalar and orbitofrontal pathways (15% of the population), but had the highest mean density per unit volume (2599 boutons per cubic millimeter).
Large and small boutons in all pathways were intermingled and occupied overlapping sites in TRN. Most labeled axons gave rise to a mixture of small and large or only small boutons. Only a few labeled axon branches formed exclusively large boutons. These observations are in agreement with previous findings regarding corticothalamic and corticoreticular terminations, which have shown that large and small boutons are found on the same axon fibers (Rouiller and Welker, 1991; Rouiller et al., 1998; Rouiller and Durif, 2004; Zikopoulos and Barbas, 2006, 2007b) (for review, see Rouiller and Welker, 2000; Jones, 2007). The amygdalar and thalamic pathways showed in common a significant proportion of predominantly large axon terminals targeting TRN neurons proximally (Fig. 5B,D). In anterior TRN sectors, ∼30% of the large terminals from the amygdala and MD were closely apposed on the soma or proximal dendrites of TRN neurons. Interestingly, we did not find terminals from pOFC that targeted proximal sites of TRN neurons. Our findings complement and extend a previous report indicating that large terminals from the thalamus similarly innervate more frequently the proximal elements of neurons in the sensory sectors of TRN (Liu and Jones, 1999).
Synaptic features of terminations from amygdala in TRN
Analysis of the synaptic features of axon terminals from the amygdala in TRN from serial ultrathin sections with the EM (n = 79 boutons) and 3D reconstruction (n = 26 boutons) confirmed the presence of two size classes of labeled presynaptic profiles in TRN, as described above for the entire system. Analysis of labeled tissue showed that small and large boutons from the amygdala formed asymmetric (presumed excitatory) synapses with the shafts of dendrites of inhibitory TRN neurons, which were labeled for parvalbumin (PV+), a marker of inhibitory neurons in TRN, or GABA (GABA+) (Fig. 7). Small boutons had round synaptic vesicles and one or no mitochondria (mean volume ± SE, 0.17 μm3 ± 0.02) (Fig. 7A). Large boutons also had round synaptic vesicles and at least two mitochondria (mean volume ± SE, 0.69 μm3 ± 0.02) (Fig. 7B). Moreover, 11% of the large boutons were multisynaptic, forming synapses with two distinct dendritic shafts of TRN neurons.
Figure 7.
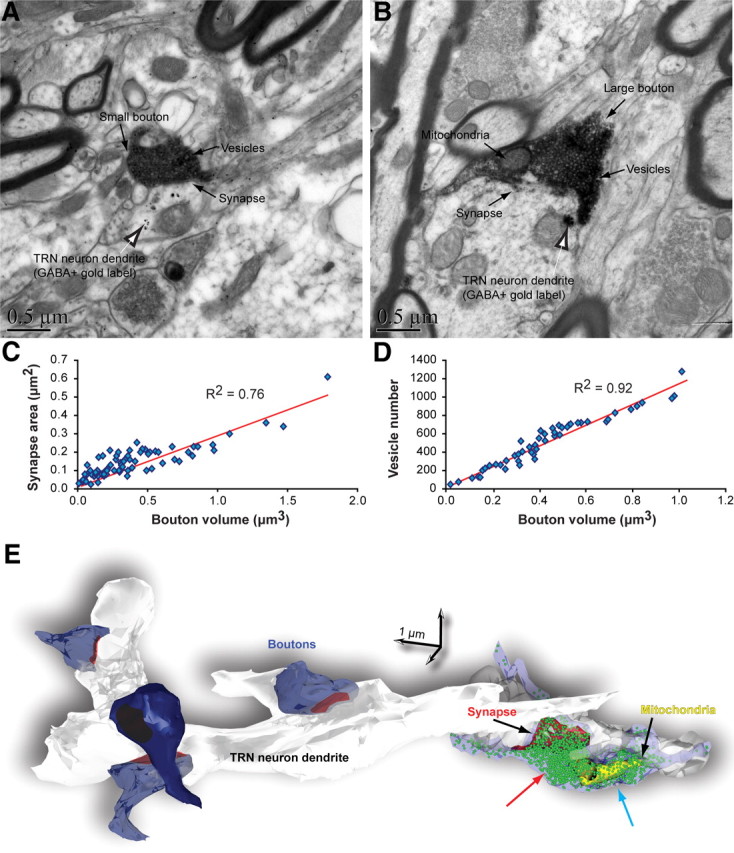
Synaptic features of labeled boutons from the amygdala in TRN. A, B, EM images show small (A) and large (B) labeled boutons (dark flocculent DAB staining; black arrows) forming asymmetric (presumed excitatory) synapses with dendrites of GABAergic TRN neurons (labeled with gold particles; black and white arrows). C, D, Bouton volume was positively correlated with synapse area (C) and vesicle number (D). E, 3D reconstruction of some labeled boutons from the amygdala (blue) that form synapses (red) with a dendrite from an inhibitory TRN neuron (white/gray). A large bouton on the right was rendered transparent to show the position of vesicles (green spheres) and mitochondria (yellow). In large boutons, vesicles were aggregated into two clusters, one found adjacent to the postsynaptic density (red arrow) and another positioned distal to the postsynaptic density (blue arrow).
There was a positive correlation between bouton size (diameter and volume) and synapse size, measured by the surface areas of the postsynaptic densities (Fig. 7C,E). In addition, bouton size (diameter and volume) was positively correlated with the number of synaptic vesicles (Fig. 7D,E), consistent with findings in other systems (Germuska et al., 2006; Zikopoulos and Barbas, 2007b).
We then compared the volumes of labeled boutons with unlabeled presynaptic terminals that formed synapses on the same or neighboring PV+ or GABA+ dendrites to see if the labeled synapses were similar or differed from the surrounding neuropil. This analysis showed no overall difference between the two populations; however, the boutons from the amygdala tended to be larger than the overall population.
Discussion
Stimuli with emotional significance capture our attention through circuits that involve the amygdala, sensory, and frontoparietal cortices (Amaral et al., 2003; Anderson et al., 2003; Pessoa and Ungerleider, 2004; Vuilleumier, 2005; Bishop, 2008; Pessoa, 2009, 2010). The thalamus, however, which is a major sensory relay station and a hub for corticocortical communication, is conspicuously absent from discussions of circuit mechanisms, with few exceptions (Pessoa and Adolphs, 2010). We provide evidence for a novel and robust excitatory pathway that may control emotional attention through a projection from the amygdala, the brain's key emotional center, to the inhibitory TRN, a central node in the brain's attentional system. The amygdalar pathway, which had not been described previously in any species, converged at the TRN sites that receive widespread projections from orbitofrontal cortex, which processes the value of stimuli, and from the MD, the principal prefrontal thalamic nucleus. This widespread connectivity renders this system ideally suited for an overseeing role, integrating input from the amygdala with prefrontal signals to direct attention to emotional stimuli, assess their value, and allow or deny their passage to the cortex depending on salience.
The degree of overlap of terminations from the amygdala, pOFC, and MD in TRN was highest anteriorly and changed in parallel with changes in the anteroposterior architecture of the TRN. At the spacious rostral pole of the TRN, neurons have round perikarya and multipolar dendrites. In the cramped central-posterior TRN sectors neurons have elongated and flattened perikarya and sparsely branched dendrites (Nakatani, 1993; Ulfig et al., 1998; Berezhnaya, 2006). These variations reflect the impact of mechanical factors on the morphology of neurons, as in other brain regions (Feldman and Peters, 1978; Hilgetag and Barbas, 2006). In view of the decreasing volume of the dendritic tree along the anteroposterior extent of TRN, the overlap of pathways from the amygdala, pOFC, and MD in TRN was overall extensive but incomplete, suggesting functional specialization.
Different pathways through TRN may control distinct types of attention
Selective attention to emotional stimuli is influenced by stimulus salience involving the amygdala and control from prefrontal cortex (Pessoa and Ungerleider, 2004; Pessoa, 2005; Bishop, 2008; Browning et al., 2010). Previous studies suggest that immediate responses to salient affective stimuli are mediated by sensory-relay thalamic nuclei and their connections with sensory cortices and amygdala (Fig. 8A, a). These pathways play a central role in rodent behavior (Romanski and LeDoux, 1992; Lanuza et al., 2004, 2008). In primates, pathways that involve high-order thalamic nuclei, association cortices, and amygdala provide another route for the perception and evaluation of complex salient stimuli (Morris et al., 1998; Compton, 2003; Williams et al., 2006; Jones, 2007; Straube et al., 2007; Pessoa, 2008; Pessoa and Adolphs, 2010). Our findings of extensive overlap of pathways from the amygdala, prefrontal cortex, and MD on TRN sectors, or even the same neurons, provide a pathway mechanism for attention to complex affective stimuli, which could be particularly useful under high cognitive demand and attentional strain, as summarized in Figure 8A (b, c).
Figure 8.

Circuit model for distinct types of attention to affective stimuli through amygdala, prefrontal cortex, MD, and TRN. A, a, Proposed activation of pathways under conditions of low cognitive demand/attentional load. This circuit involves sensory areas connected with the amygdala to filter distracters by lateral inhibition through TRN (red line). b, Facilitated passage of signals with emotional significance involves overlapping projections from amygdala, pOFC, and MDmc to TRN. b, c, Proposed activation under conditions of high cognitive demand/attentional load. This circuit involves the combined strength of the amygdala–pOFC–MDmc and the LPFC-MDpc pathways to drive the TRN, shift attention to emotional events, and inhibit neighboring thalamoreticular pairs, preventing passage of distracters to the cortex (right). B, Specialization of TRN sectors for attention to external and internal stimuli. Left, Proposed circuit for attention to exteroceptive stimuli. The posterior and central TRN sectors receive input from sensory cortices, which is filtered for emotional significance (assessed by the amygdala), valence (pOFC), and priority based on plans of action (DLPFC). Right, Proposed circuit for attention to interoceptive stimuli. The frontal sector of the TRN receives projections exclusively from limbic and prefrontal cortices, including the ACC and area 10, key nodes for attention under high cognitive demand. The model (A, B) predicts that specific circuits are hyperactive (red shading) or hypoactive (blue shading) in anxiety and mood disorders. The model predictions are consistent with clinical interventions for depression, obsessions/compulsions, and other anxiety disorders; these include pharmacological treatments for depression (Mayberg et al., 2005), repetitive transcranial magnetic stimulation of orbitofrontal cortex in patients with obsessive compulsive disorder (Ruffini et al., 2009), and deep brain stimulation of the ACC, TRN, and associated pathways in the inferior thalamic peduncle (Greenberg et al., 2010; Holtzheimer and Mayberg, 2011), which carry fibers from the amygdala to the TRN.
Selective attention also implies suppression of irrelevant stimuli, which may be accomplished early in neural processing through TRN (Fig. 8A, right). Most TRN neurons do not inhibit thalamic neurons that innervate them, but target neighboring thalamic and other reticular neurons (Pinault and Deschênes, 1998). This mechanism of lateral inhibition is ideally suited to dampen noise from distracters and allow passage of salient attended stimuli from thalamus to cortex. The concerted strength of the amygdala, pOFC, and MD terminations in TRN may override distracting signals from sensory cortices, which innervate TRN exclusively with small and presumably less efficient terminals (for review, see Zikopoulos and Barbas, 2007a).
In contrast, the presence of sites within the TRN with low overlap or complementary terminations from the amygdala, pOFC, and MD provides a mechanism for differential recruitment leading to distinct outcomes. For example, sites where projections from the amygdala predominate and innervate TRN neurons with large terminals proximally may control rapid shift of attention to affective stimuli that are important for survival. In contrast, pOFC, areas 46 and 9, and their thalamic MD nucleus, which also have widespread projections to TRN (Zikopoulos and Barbas, 2006), may control attentional resources (Browning et al., 2010) and redirect attention in cognitive-emotional operations.
Differential projection from amygdala, prefrontal, and sensory cortices suggests further specialization for attention through distinct TRN sectors (Fig. 8B). External stimuli with emotional significance are conveyed through the sensory systems to the cortex. The pOFC and the amygdala receive in common projections from high-order association cortices that represent each and every sensory modality (for review, see Barbas and Zikopoulos, 2006; Barbas et al., 2011). Both structures have widespread projections to TRN, including its posterior three quarters, which are innervated by sensory cortices and their thalamic nuclei (Zikopoulos and Barbas, 2007a). These features place the pOFC and amygdala in an ideal position to direct attention to affective stimuli in the external sensory environment through posterior TRN. Dorsolateral areas 46 and 9 also have a role in attention (for review, see Browning et al., 2010), they are connected with sensory areas, and have widespread projections to TRN as well (Zikopoulos and Barbas, 2006), and thus may work in concert with pOFC and amygdala to direct attention to significant stimuli to accomplish the task at hand.
Motives and drives are powerful internal stimuli that capture our attention as well, a process that may be mediated through the anterior TRN sector, which receives the strongest projections from prefrontal and limbic cortices, but not from sensory cortices. Furthermore, the anterior TRN is innervated by the anterior cingulate cortex (ACC) (Zikopoulos and Barbas, 2006), which has a key role in attention (for review, see Paus, 2001), as well as frontal polar area 10, which is engaged during internal ordering of information in complex cognitive operations (Koechlin and Hyafil, 2007). This circuitry suggests that the frontal sector of TRN has a role in focusing attention on interoceptive stimuli. The amygdala and MD project strongly to the anterior part of TRN as well, in pathways that appear to originate preferentially from the phylogenetically old medial parts of each structure, which are associated with motives, drives, and reproduction (for review, see De Olmos, 1990; Jones, 2007).
Distinct pathways through TRN may be disrupted in psychiatric diseases
Attention is disrupted in several psychiatric diseases, including anxiety and mood disorders (for review, see Bechara et al., 2000; Davidson, 2002; Zald, 2003; Ressler and Mayberg, 2007; Kim et al., 2011) that may involve circuits through TRN. For example, the orbitofrontal cortex and amygdala show high activation in anxiety disorders (Stein et al., 2007; Ursu and Carter, 2009; Nonkes et al., 2010; Del Casale et al., 2011). Based on our findings, a circuit model suggests that the pOFC and amygdala may overengage the posterior sectors of TRN in anxiety disorders (Fig. 8B). Such aberrant activation may affect attention to exteroceptive stimuli, as seen in people with specific phobias or posttraumatic stress disorder, who are in constant search of potential dangers in the external environment (for review, see Mathews et al., 1997).
On the other hand, excessive attention to interoceptive stimuli may be mediated through pathways to the anterior TRN from ACC (Zikopoulos and Barbas, 2006), which is hyperactive in depression (Ressler and Mayberg, 2007), as summarized in our circuit model (Fig. 8B). Interestingly, frontal polar area 10, which is also overactive in depression (Mayberg et al., 2005), receives strong excitatory projections from ACC that form large synapses with spines of excitatory neurons (Medalla and Barbas, 2010). Area 10, which also projects exclusively to the frontal sector of TRN (Zikopoulos and Barbas, 2006), may act synergistically with ACC to activate tonically the frontal TRN sector, resulting in excessive focus of attention on internal stimuli in depression.
In contrast, prefrontal areas 46 and 9 are underactive in depression (Browning et al., 2010). Moreover, lateral prefrontal cortices and the amygdala have an antagonistic relationship in attentional tasks and interference by emotional distracters (Mitchell et al., 2008). Excessive activity in the amygdala and underrecruitment of DLPFC is common in depression, anxiety, and diseases that disrupt attention (Bishop, 2008; Arnsten, 2009; Benes, 2010). This evidence suggests disconnection of pathways that integrate emotional and cognitive processes, consistent with the hypothesis that depressed patients do not shift attention to stimuli in the external environment (Siegle et al., 2002; Mayberg et al., 2005; Browning et al., 2010), suggesting perseveration within an attentional domain.
Our findings of a novel pathway from the amygdala that partly overlaps with pathways from pOFC and MD on TRN support the hypothesis that multiple systems affect thalamocortical communication for attentional control within an emotional context. Acting synergistically, these pathways likely help us contemplate events with emotional import, allowing salient stimuli to gain access to the cortex. Acting singly, the powerful and synaptically efficient pathway from the amygdala to the TRN may help rapid shift of attention to stimuli that are important for survival. These pathways suggest functional specialization that underlies distinct types of attention to affective stimuli filtered through the TRN, which may be differentially affected in anxiety and mood disorders.
Footnotes
This work was supported by grants from the NIH (NIMH, NINDS) and NSF (CELEST). We thank Amar Patel, Mary Louise Fowler, and Seung Yeon Michelle Kim for technical assistance, Marcia Feinberg for assistance with electron microscopy, Dr. Ron Killiany for assistance with imaging, and Dr. Angela Carville for veterinary care and surgical assistance.
References
- Aggleton JP, Mishkin M. Projections of the amygdala to the thalamus in the cynomolgus monkey. J Comp Neurol. 1984;222:56–68. doi: 10.1002/cne.902220106. [DOI] [PubMed] [Google Scholar]
- Amaral DG, Behniea H, Kelly JL. Topographic organization of projections from the amygdala to the visual cortex in the macaque monkey. Neuroscience. 2003;118:1099–1120. doi: 10.1016/s0306-4522(02)01001-1. [DOI] [PubMed] [Google Scholar]
- Anderson AK, Christoff K, Panitz D, De Rosa E, Gabrieli JD. Neural correlates of the automatic processing of threat facial signals. J Neurosci. 2003;23:5627–5633. doi: 10.1523/JNEUROSCI.23-13-05627.2003. [DOI] [PMC free article] [PubMed] [Google Scholar]
- Arnsten AF. Stress signalling pathways that impair prefrontal cortex structure and function. Nat Rev Neurosci. 2009;10:410–422. doi: 10.1038/nrn2648. [DOI] [PMC free article] [PubMed] [Google Scholar]
- Barbas H. Flow of information for emotions through temporal and orbitofrontal pathways. J Anat. 2007;211:237–249. doi: 10.1111/j.1469-7580.2007.00777.x. [DOI] [PMC free article] [PubMed] [Google Scholar]
- Barbas H, Zikopoulos B. Sequential and parallel circuits for emotional processing in primate orbitofrontal cortex. In: Zald David, Rauch Scott., editors. The orbitofrontal cortex. Oxford: Oxford UP; 2006. pp. 57–91. [Google Scholar]
- Barbas H, Zikopoulos B. The prefrontal cortex and flexible behavior. Neuroscientist. 2007;13:532–545. doi: 10.1177/1073858407301369. [DOI] [PMC free article] [PubMed] [Google Scholar]
- Barbas H, Henion TH, Dermon CR. Diverse thalamic projections to the prefrontal cortex in the rhesus monkey. J Comp Neurol. 1991;313:65–94. doi: 10.1002/cne.903130106. [DOI] [PubMed] [Google Scholar]
- Barbas H, Zikopoulos B, Timbie C. Sensory pathways and emotional context for action in primate prefrontal cortex. Biol Psychiatry. 2011;69:1133–1139. doi: 10.1016/j.biopsych.2010.08.008. [DOI] [PubMed] [Google Scholar]
- Bechara A, Damasio H, Damasio AR. Emotion, decision making and the orbitofrontal cortex. Cereb Cortex. 2000;10:295–307. doi: 10.1093/cercor/10.3.295. [DOI] [PubMed] [Google Scholar]
- Benes FM. Amygdalocortical circuitry in schizophrenia: from circuits to molecules. Neuropsychopharmacology. 2010;35:239–257. doi: 10.1038/npp.2009.116. [DOI] [PMC free article] [PubMed] [Google Scholar]
- Berezhnaya LA. Neuronal organization of the reticular nucleus of the thalamus in adult humans. Neurosci Behav Physiol. 2006;36:519–525. doi: 10.1007/s11055-006-0049-1. [DOI] [PubMed] [Google Scholar]
- Bishop SJ. Neural mechanisms underlying selective attention to threat. Ann N Y Acad Sci. 2008;1129:141–152. doi: 10.1196/annals.1417.016. [DOI] [PubMed] [Google Scholar]
- Browning M, Holmes EA, Harmer CJ. The modification of attentional bias to emotional information: A review of the techniques, mechanisms, and relevance to emotional disorders. Cogn Affect Behav Neurosci. 2010;10:8–20. doi: 10.3758/CABN.10.1.8. [DOI] [PubMed] [Google Scholar]
- Bunce JG, Barbas H. Prefrontal pathways target excitatory and inhibitory systems in memory-related medial temporal cortices. Neuroimage. 2011;55:1461–1474. doi: 10.1016/j.neuroimage.2011.01.064. [DOI] [PMC free article] [PubMed] [Google Scholar]
- Cavada C, Compañy T, Tejedor J, Cruz-Rizzolo RJ, Reinoso-Suárez F. The anatomical connections of the macaque monkey orbitofrontal cortex. A review. Cereb Cortex. 2000;10:220–242. doi: 10.1093/cercor/10.3.220. [DOI] [PubMed] [Google Scholar]
- Compton RJ. The interface between emotion and attention: a review of evidence from psychology and neuroscience. Behav Cogn Neurosci Rev. 2003;2:115–129. doi: 10.1177/1534582303255278. [DOI] [PubMed] [Google Scholar]
- Crick F. Function of the thalamic reticular complex: the searchlight hypothesis. Proc Natl Acad Sci U S A. 1984;81:4586–4590. doi: 10.1073/pnas.81.14.4586. [DOI] [PMC free article] [PubMed] [Google Scholar]
- Davidson RJ. Anxiety and affective style: role of prefrontal cortex and amygdala. Biol Psychiatry. 2002;51:68–80. doi: 10.1016/s0006-3223(01)01328-2. [DOI] [PubMed] [Google Scholar]
- De Olmos JS. Amygdala. In: Paxinos G, editor. The human nervous system. San Diego: Academic; 1990. pp. 583–710. [Google Scholar]
- Del Casale A, Kotzalidis GD, Rapinesi C, Serata D, Ambrosi E, Simonetti A, Pompili M, Ferracuti S, Tatarelli R, Girardi P. Functional neuroimaging in obsessive-compulsive disorder. Neuropsychobiology. 2011;64:61–85. doi: 10.1159/000325223. [DOI] [PubMed] [Google Scholar]
- Dermon CR, Barbas H. Contralateral thalamic projections predominantly reach transitional cortices in the rhesus monkey. J Comp Neurol. 1994;344:508–531. doi: 10.1002/cne.903440403. [DOI] [PubMed] [Google Scholar]
- Feldman ML, Peters A. The forms of non-pyramidal neurons in the visual cortex of the rat. J Comp Neurol. 1978;179:761–793. doi: 10.1002/cne.901790406. [DOI] [PubMed] [Google Scholar]
- Fiala JC. Reconstruct: a free editor for serial section microscopy. J Microsc. 2005;218:52–61. doi: 10.1111/j.1365-2818.2005.01466.x. [DOI] [PubMed] [Google Scholar]
- Franks KM, Stevens CF, Sejnowski TJ. Independent sources of quantal variability at single glutamatergic synapses. J Neurosci. 2003;23:3186–3195. doi: 10.1523/JNEUROSCI.23-08-03186.2003. [DOI] [PMC free article] [PubMed] [Google Scholar]
- Fuentealba P, Steriade M. The reticular nucleus revisited: Intrinsic and network properties of a thalamic pacemaker. Prog Neurobiol. 2005;75:125–141. doi: 10.1016/j.pneurobio.2005.01.002. [DOI] [PubMed] [Google Scholar]
- Germuska M, Saha S, Fiala J, Barbas H. Synaptic distinction of laminar specific prefrontal-temporal pathways in primates. Cereb Cortex. 2006;16:865–875. doi: 10.1093/cercor/bhj030. [DOI] [PubMed] [Google Scholar]
- Ghashghaei HT, Barbas H. Pathways for emotions: interactions of prefrontal and anterior temporal pathways in the amygdala of the rhesus monkey. Neuroscience. 2002;115:1261–1279. doi: 10.1016/s0306-4522(02)00446-3. [DOI] [PubMed] [Google Scholar]
- Ghashghaei HT, Hilgetag CC, Barbas H. Sequence of information processing for emotions based on the anatomic dialogue between prefrontal cortex and amygdala. Neuroimage. 2007;34:905–923. doi: 10.1016/j.neuroimage.2006.09.046. [DOI] [PMC free article] [PubMed] [Google Scholar]
- Giguere M, Goldman-Rakic PS. Mediodorsal nucleus: areal, laminar, and tangential distribution of afferents and efferents in the frontal lobe of rhesus monkeys. J Comp Neurol. 1988;277:195–213. doi: 10.1002/cne.902770204. [DOI] [PubMed] [Google Scholar]
- Goldman-Rakic PS, Porrino LJ. The primate mediodorsal (MD) nucleus and its projection to the frontal lobe. J Comp Neurol. 1985;242:535–560. doi: 10.1002/cne.902420406. [DOI] [PubMed] [Google Scholar]
- Greenberg BD, Rauch SL, Haber SN. Invasive circuitry-based neurotherapeutics: stereotactic ablation and deep brain stimulation for OCD. Neuropsychopharmacology. 2010;35:317–336. doi: 10.1038/npp.2009.128. [DOI] [PMC free article] [PubMed] [Google Scholar]
- Guillery RW, Harting JK. Structure and connections of the thalamic reticular nucleus: advancing views over half a century. J Comp Neurol. 2003;463:360–371. doi: 10.1002/cne.10738. [DOI] [PubMed] [Google Scholar]
- Hilgetag CC, Barbas H. Role of mechanical factors in the morphology of the primate cerebral cortex. PLoS Comput Biol. 2006;2:e22. doi: 10.1371/journal.pcbi.0020022. [DOI] [PMC free article] [PubMed] [Google Scholar]
- Höistad M, Barbas H. Sequence of information processing for emotions through pathways linking temporal and insular cortices with the amygdala. Neuroimage. 2008;40:1016–1033. doi: 10.1016/j.neuroimage.2007.12.043. [DOI] [PMC free article] [PubMed] [Google Scholar]
- Holtzheimer PE, Mayberg HS. Deep brain stimulation for psychiatric disorders. Annu Rev Neurosci. 2011;34:289–307. doi: 10.1146/annurev-neuro-061010-113638. [DOI] [PMC free article] [PubMed] [Google Scholar]
- Jones EG. The thalamus. New York: Cambridge UP; 2007. [Google Scholar]
- Kim MJ, Loucks RA, Palmer AL, Brown AC, Solomon KM, Marchante AN, Whalen PJ. The structural and functional connectivity of the amygdala: from normal emotion to pathological anxiety. Behav Brain Res. 2011;223:403–410. doi: 10.1016/j.bbr.2011.04.025. [DOI] [PMC free article] [PubMed] [Google Scholar]
- Koechlin E, Hyafil A. Anterior prefrontal function and the limits of human decision-making. Science. 2007;318:594–598. doi: 10.1126/science.1142995. [DOI] [PubMed] [Google Scholar]
- Lam YW, Sherman SM. Mapping by laser photostimulation of connections between the thalamic reticular and ventral posterior lateral nuclei in the rat. J Neurophysiol. 2005;94:2472–2483. doi: 10.1152/jn.00206.2005. [DOI] [PubMed] [Google Scholar]
- Lanuza E, Nader K, Ledoux JE. Unconditioned stimulus pathways to the amygdala: effects of posterior thalamic and cortical lesions on fear conditioning. Neuroscience. 2004;125:305–315. doi: 10.1016/j.neuroscience.2003.12.034. [DOI] [PubMed] [Google Scholar]
- Lanuza E, Moncho-Bogani J, Ledoux JE. Unconditioned stimulus pathways to the amygdala: Effects of lesions of the posterior intralaminar thalamus on foot-shock-induced c-Fos expression in the subdivisions of the lateral amygdala. Neuroscience. 2008;155:959–968. doi: 10.1016/j.neuroscience.2008.06.028. [DOI] [PMC free article] [PubMed] [Google Scholar]
- Lisman JE. Bursts as a unit of neural information: making unreliable synapses reliable. Trends Neurosci. 1997;20:38–43. doi: 10.1016/S0166-2236(96)10070-9. [DOI] [PubMed] [Google Scholar]
- Liu XB, Jones EG. Predominance of corticothalamic synaptic inputs to thalamic reticular nucleus neurons in the rat. J Comp Neurol. 1999;414:67–79. [PubMed] [Google Scholar]
- Mathews A, Mackintosh B, Fulcher EP. Cognitive biases in anxiety and attention to threat. Trends Cogn Sci. 1997;1:340–345. doi: 10.1016/S1364-6613(97)01092-9. [DOI] [PubMed] [Google Scholar]
- Mayberg HS, Lozano AM, Voon V, McNeely HE, Seminowicz D, Hamani C, Schwalb JM, Kennedy SH. Deep brain stimulation for treatment-resistant depression. Neuron. 2005;45:651–660. doi: 10.1016/j.neuron.2005.02.014. [DOI] [PubMed] [Google Scholar]
- McAlonan K, Cavanaugh J, Wurtz RH. Guarding the gateway to cortex with attention in visual thalamus. Nature. 2008;456:391–394. doi: 10.1038/nature07382. [DOI] [PMC free article] [PubMed] [Google Scholar]
- McDonald AJ. Organization of amygdaloid projections to the mediodorsal thalamus and prefrontal cortex: a fluorescence retrograde transport study in the rat. J Comp Neurol. 1987;262:46–58. doi: 10.1002/cne.902620105. [DOI] [PubMed] [Google Scholar]
- McKenna JT, Vertes RP. Afferent projections to nucleus reuniens of the thalamus. J Comp Neurol. 2004;480:115–142. doi: 10.1002/cne.20342. [DOI] [PubMed] [Google Scholar]
- Medalla M, Barbas H. Synapses with inhibitory neurons differentiate anterior cingulate from dorsolateral prefrontal pathways associated with cognitive control. Neuron. 2009;61:609–620. doi: 10.1016/j.neuron.2009.01.006. [DOI] [PMC free article] [PubMed] [Google Scholar]
- Medalla M, Barbas H. Anterior cingulate synapses in prefrontal areas 10 and 46 suggest differential influence in cognitive control. J Neurosci. 2010;30:16068–16081. doi: 10.1523/JNEUROSCI.1773-10.2010. [DOI] [PMC free article] [PubMed] [Google Scholar]
- Mitchell DG, Luo Q, Mondillo K, Vythilingam M, Finger EC, Blair RJ. The interference of operant task performance by emotional distracters: an antagonistic relationship between the amygdala and frontoparietal cortices. Neuroimage. 2008;40:859–868. doi: 10.1016/j.neuroimage.2007.08.002. [DOI] [PMC free article] [PubMed] [Google Scholar]
- Miyashita T, Ichinohe N, Rockland KS. Differential modes of termination of amygdalothalamic and amygdalocortical projections in the monkey. J Comp Neurol. 2007;502:309–324. doi: 10.1002/cne.21304. [DOI] [PubMed] [Google Scholar]
- Montero VM. c-fos induction in sensory pathways of rats exploring a novel complex environment: shifts of active thalamic reticular sectors by predominant sensory cues. Neuroscience. 1997;76:1069–1081. doi: 10.1016/s0306-4522(96)00417-4. [DOI] [PubMed] [Google Scholar]
- Morris JS, Friston KJ, Buchel C, Frith CD, Young AW, Calder AJ, Dolan RJ. A neuromodulatory role for the human amygdala in processing emotional facial expressions. Brain. 1998;121:47–57. doi: 10.1093/brain/121.1.47. [DOI] [PubMed] [Google Scholar]
- Murthy VN, Sejnowski TJ, Stevens CF. Heterogeneous release properties of visualized individual hippocampal synapses. Neuron. 1997;18:599–612. doi: 10.1016/s0896-6273(00)80301-3. [DOI] [PubMed] [Google Scholar]
- Murthy VN, Schikorski T, Stevens CF, Zhu Y. Inactivity produces increases in neurotransmitter release and synapse size. Neuron. 2001;32:673–682. doi: 10.1016/s0896-6273(01)00500-1. [DOI] [PubMed] [Google Scholar]
- Nakatani T. The degree of GABA immunoreactivity is related to neuronal size in the thalamic reticular nucleus of the Japanese monkey, Macaca fuscata. Kaibogaku Zasshi. 1993;68:180–189. [PubMed] [Google Scholar]
- Nonkes LJ, Tomson K, Maertin A, Dederen J, Maes JH, Homberg J. Orbitofrontal cortex and amygdalar over-activity is associated with an inability to use the value of expected outcomes to guide behaviour in serotonin transporter knockout rats. Neurobiol Learn Mem. 2010;94:65–72. doi: 10.1016/j.nlm.2010.04.002. [DOI] [PubMed] [Google Scholar]
- Paus T. Primate anterior cingulate cortex: where motor control, drive and cognition interface. Nat Rev Neurosci. 2001;2:417–424. doi: 10.1038/35077500. [DOI] [PubMed] [Google Scholar]
- Pessoa L. To what extent are emotional visual stimuli processed without attention and awareness? Curr Opin Neurobiol. 2005;15:188–196. doi: 10.1016/j.conb.2005.03.002. [DOI] [PubMed] [Google Scholar]
- Pessoa L. On the relationship between emotion and cognition. Nat Rev Neurosci. 2008;9:148–158. doi: 10.1038/nrn2317. [DOI] [PubMed] [Google Scholar]
- Pessoa L. How do emotion and motivation direct executive control? Trends Cogn Sci. 2009;13:160–166. doi: 10.1016/j.tics.2009.01.006. [DOI] [PMC free article] [PubMed] [Google Scholar]
- Pessoa L. Emotion and cognition and the amygdala: from “what is it?” to “what's to be done?”. Neuropsychologia. 2010;48:3416–3429. doi: 10.1016/j.neuropsychologia.2010.06.038. [DOI] [PMC free article] [PubMed] [Google Scholar]
- Pessoa L, Adolphs R. Emotion processing and the amygdala: from a “low road” to “many roads” of evaluating biological significance. Nat Rev Neurosci. 2010;11:773–783. doi: 10.1038/nrn2920. [DOI] [PMC free article] [PubMed] [Google Scholar]
- Pessoa L, Ungerleider LG. Neuroimaging studies of attention and the processing of emotion-laden stimuli. Prog Brain Res. 2004;144:171–182. doi: 10.1016/S0079-6123(03)14412-3. [DOI] [PubMed] [Google Scholar]
- Petrof I, Brown VJ. Attention to visual, but not tactile, properties of a stimulus results in activation of FOS protein in the visual thalamic reticular nucleus of rats. Behav Brain Res. 2010;211:248–252. doi: 10.1016/j.bbr.2010.03.045. [DOI] [PubMed] [Google Scholar]
- Petrovich GD, Risold PY, Swanson LW. Organization of projections from the basomedial nucleus of the amygdala: a PHAL study in the rat. J Comp Neurol. 1996;374:387–420. doi: 10.1002/(SICI)1096-9861(19961021)374:3<387::AID-CNE6>3.0.CO;2-Y. [DOI] [PubMed] [Google Scholar]
- Pierce JP, Lewin GR. An ultrastructural size principle. Neuroscience. 1994;58:441–446. doi: 10.1016/0306-4522(94)90071-x. [DOI] [PubMed] [Google Scholar]
- Pinault D. The thalamic reticular nucleus: structure, function and concept. Brain Res Brain Res Rev. 2004;46:1–31. doi: 10.1016/j.brainresrev.2004.04.008. [DOI] [PubMed] [Google Scholar]
- Pinault D, Deschênes M. Anatomical evidence for a mechanism of lateral inhibition in the rat thalamus. Eur J Neurosci. 1998;10:3462–3469. doi: 10.1046/j.1460-9568.1998.00362.x. [DOI] [PubMed] [Google Scholar]
- Porrino LJ, Crane AM, Goldman-Rakic PS. Direct and indirect pathways from the amygdala to the frontal lobe in rhesus monkeys. J Comp Neurol. 1981;198:121–136. doi: 10.1002/cne.901980111. [DOI] [PubMed] [Google Scholar]
- Price JL, Amaral DG. An autoradiographic study of the projections of the central nucleus of the monkey amygdala. J Neurosci. 1981;1:1242–1259. doi: 10.1523/JNEUROSCI.01-11-01242.1981. [DOI] [PMC free article] [PubMed] [Google Scholar]
- Reiner A, Veenman CL, Medina L, Jiao Y, Del Mar N, Honig MG. Pathway tracing using biotinylated dextran amines. J Neurosci Methods. 2000;103:23–37. doi: 10.1016/s0165-0270(00)00293-4. [DOI] [PubMed] [Google Scholar]
- Ressler KJ, Mayberg HS. Targeting abnormal neural circuits in mood and anxiety disorders: from the laboratory to the clinic. Nat Neurosci. 2007;10:1116–1124. doi: 10.1038/nn1944. [DOI] [PMC free article] [PubMed] [Google Scholar]
- Rockland KS, Andresen J, Cowie RJ, Robinson DL. Single axon analysis of pulvinocortical connections to several visual areas in the macaque. J Comp Neurol. 1999;406:221–250. doi: 10.1002/(sici)1096-9861(19990405)406:2<221::aid-cne7>3.0.co;2-k. [DOI] [PubMed] [Google Scholar]
- Romanski LM, LeDoux JE. Equipotentiality of thalamo-amygdala and thalamo-cortico-amygdala circuits in auditory fear conditioning. J Neurosci. 1992;12:4501–4509. doi: 10.1523/JNEUROSCI.12-11-04501.1992. [DOI] [PMC free article] [PubMed] [Google Scholar]
- Rouiller EM, Durif C. The dual pattern of corticothalamic projection of the primary auditory cortex in macaque monkey. Neurosci Lett. 2004;358:49–52. doi: 10.1016/j.neulet.2004.01.008. [DOI] [PubMed] [Google Scholar]
- Rouiller EM, Welker E. Morphology of corticothalamic terminals arising from the auditory cortex of the rat: a Phaseolus vulgaris-leucoagglutinin (PHA-L) tracing study. Hear Res. 1991;56:179–190. doi: 10.1016/0378-5955(91)90168-9. [DOI] [PubMed] [Google Scholar]
- Rouiller EM, Welker E. A comparative analysis of the morphology of corticothalamic projections in mammals. Brain Res Bull. 2000;53:727–741. doi: 10.1016/s0361-9230(00)00364-6. [DOI] [PubMed] [Google Scholar]
- Rouiller EM, Tanné J, Moret V, Kermadi I, Boussaoud D, Welker E. Dual morphology and topography of the corticothalamic terminals originating from the primary, supplementary motor, and dorsal premotor cortical areas in macaque monkeys. J Comp Neurol. 1998;396:169–185. doi: 10.1002/(sici)1096-9861(19980629)396:2<169::aid-cne3>3.0.co;2-z. [DOI] [PubMed] [Google Scholar]
- Ruffini C, Locatelli M, Lucca A, Benedetti F, Insacco C, Smeraldi E. Augmentation effect of repetitive transcranial magnetic stimulation over the orbitofrontal cortex in drug-resistant obsessive-compulsive disorder patients: a controlled investigation. Prim Care Companion J Clin Psychiatry. 2009;11:226–230. doi: 10.4088/PCC.08m00663. [DOI] [PMC free article] [PubMed] [Google Scholar]
- Russchen FT, Amaral DG, Price JL. The afferent input to the magnocellular division of the mediodorsal thalamic nucleus in the monkey, Macaca fascicularis. J Comp Neurol. 1987;256:175–210. doi: 10.1002/cne.902560202. [DOI] [PubMed] [Google Scholar]
- Siegle GJ, Steinhauer SR, Thase ME, Stenger VA, Carter CS. Can't shake that feeling: event-related fMRI assessment of sustained amygdala activity in response to emotional information in depressed individuals. Biol Psychiatry. 2002;51:693–707. doi: 10.1016/s0006-3223(02)01314-8. [DOI] [PubMed] [Google Scholar]
- Stein MB, Simmons AN, Feinstein JS, Paulus MP. Increased amygdala and insula activation during emotion processing in anxiety-prone subjects. Am J Psychiatry. 2007;164:318–327. doi: 10.1176/ajp.2007.164.2.318. [DOI] [PubMed] [Google Scholar]
- Straube T, Mentzel HJ, Miltner WH. Waiting for spiders: brain activation during anticipatory anxiety in spider phobics. Neuroimage. 2007;37:1427–1436. doi: 10.1016/j.neuroimage.2007.06.023. [DOI] [PubMed] [Google Scholar]
- Swadlow HA, Gusev AG, Bezdudnaya T. Activation of a cortical column by a thalamocortical impulse. J Neurosci. 2002;22:7766–7773. doi: 10.1523/JNEUROSCI.22-17-07766.2002. [DOI] [PMC free article] [PubMed] [Google Scholar]
- Ulfig N, Nickel J, Bohl J. Transient features of the thalamic reticular nucleus in the human foetal brain. Eur J Neurosci. 1998;10:3773–3784. doi: 10.1046/j.1460-9568.1998.00390.x. [DOI] [PubMed] [Google Scholar]
- Ursu S, Carter CS. An initial investigation of the orbitofrontal cortex hyperactivity in obsessive-compulsive disorder: exaggerated representations of anticipated aversive events? Neuropsychologia. 2009;47:2145–2148. doi: 10.1016/j.neuropsychologia.2009.03.018. [DOI] [PMC free article] [PubMed] [Google Scholar]
- Vuilleumier P. How brains beware: neural mechanisms of emotional attention. Trends Cogn Sci. 2005;9:585–594. doi: 10.1016/j.tics.2005.10.011. [DOI] [PubMed] [Google Scholar]
- Weese GD, Phillips JM, Brown VJ. Attentional orienting is impaired by unilateral lesions of the thalamic reticular nucleus in the rat. J Neurosci. 1999;19:10135–10139. doi: 10.1523/JNEUROSCI.19-22-10135.1999. [DOI] [PMC free article] [PubMed] [Google Scholar]
- Williams LM, Das P, Liddell BJ, Kemp AH, Rennie CJ, Gordon E. Mode of functional connectivity in amygdala pathways dissociates level of awareness for signals of fear. J Neurosci. 2006;26:9264–9271. doi: 10.1523/JNEUROSCI.1016-06.2006. [DOI] [PMC free article] [PubMed] [Google Scholar]
- Xiao D, Zikopoulos B, Barbas H. Laminar and modular organization of prefrontal projections to multiple thalamic nuclei. Neuroscience. 2009;161:1067–1081. doi: 10.1016/j.neuroscience.2009.04.034. [DOI] [PMC free article] [PubMed] [Google Scholar]
- Zald DH. The human amygdala and the emotional evaluation of sensory stimuli. Brain Res Brain Res Rev. 2003;41:88–123. doi: 10.1016/s0165-0173(02)00248-5. [DOI] [PubMed] [Google Scholar]
- Zikopoulos B, Barbas H. Prefrontal projections to the thalamic reticular nucleus form a unique circuit for attentional mechanisms. J Neurosci. 2006;26:7348–7361. doi: 10.1523/JNEUROSCI.5511-05.2006. [DOI] [PMC free article] [PubMed] [Google Scholar]
- Zikopoulos B, Barbas H. Circuits for multisensory integration and attentional modulation through the prefrontal cortex and the thalamic reticular nucleus in primates. Rev Neurosci. 2007a;18:417–438. doi: 10.1515/revneuro.2007.18.6.417. [DOI] [PMC free article] [PubMed] [Google Scholar]
- Zikopoulos B, Barbas H. Parallel driving and modulatory pathways link the prefrontal cortex and thalamus. PLoS One. 2007b;2:e848. doi: 10.1371/journal.pone.0000848. [DOI] [PMC free article] [PubMed] [Google Scholar]