

Abstract
The superior colliculus (SC) is a midbrain structure that integrates visual, somatosensory, and auditory inputs to direct head and eye movements. Each of these modalities is topographically mapped and aligned with the others to ensure precise behavioral responses to multimodal stimuli. While it is clear that neural activity is instructive for topographic alignment of inputs from the visual cortex (V1) and auditory system with retinal axons in the SC, there is also evidence that activity-independent mechanisms are used to establish topographic alignment between modalities. Here, we show that the topography of the projection from primary somatosensory cortex (S1) to the SC is established during the first postnatal week. Unlike V1–SC projections, the S1–SC projection does not bifurcate when confronted with a duplicated retinocollicular map, showing that retinal input in the SC does not influence the topography of the S1–SC projection. However, S1–SC topography is disrupted in mice lacking ephrin-As, which we find are expressed in graded patterns along with their binding partners, the EphA4 and EphA7, in both S1 and the somatosensory recipient layer of the SC. Together, these data support a model in which somatosensory inputs into the SC map topographically and establish alignment with visual inputs in the SC using a gradient-matching mechanism.
Introduction
An important function of the nervous system is to detect and respond to sensory stimuli. The visual and somatosensory systems are organized topographically, such that neighboring neurons respond to adjacent regions of space. In associative centers, sensory maps of space of different modalities must be brought into register; however, the mechanisms by which this occurs remain unclear.
The superior colliculus (SC) is a midbrain center that directs reflexive head and eye movements. The SC is laminated and different modalities map to distinct layers (May, 2006). The superficial SC receives visual input from the retina and primary visual cortex (V1), each of which is topographic and in register with the other (Dräger and Hubel, 1975; Cang et al., 2008). Deeper layers of the SC receive inputs from the primary somatosensory cortex (S1) and the trigeminal nucleus of the brainstem (Wise and Jones, 1977; Killackey and Erzurumlu, 1981). These projections are organized somatotopically, which in the rodent means that neurons in the anterior SC are responsive to whiskers closest to the nose, while those in the posterior are responsive to stimulation of the head, ears, rostral trunk, and forepaw (Dräger and Hubel, 1975, 1976; Finlay et al., 1978; Benedetti, 1991). This creates a representation of the body that is in register with the visual map, whereby central visual space is represented anteriorly and the periphery is represented posteriorly (Dräger and Hubel, 1976; Tiao and Blakemore, 1976; Chalupa and Rhoades, 1977; Wallace et al., 1996).
Two general models have been proposed for the mechanism by which converging maps of vision and touch are aligned (Triplett et al., 2009). In a gradient-matching model, the retina and S1 each express gradients of molecules that map onto complementary graded labels expressed in all layers of the SC. Indeed, gradients of ephrin-As and EphAs are found along the nasal–temporal axis of the retina, the medial–lateral (M-L) axis of S1, and the anterior–posterior (A-P) axis of the SC (Feldheim et al., 2000; Vanderhaeghen et al., 2000; Cang et al., 2005; Rashid et al., 2005; Miller et al., 2006). Alternatively, alignment may be achieved in an activity-dependent manner, wherein neurons monitoring similar regions of space have similar patterns of activity and terminate in the same area. This possibility is supported by studies in which altering visual inputs to the SC results in a concomitant shift in the auditory representation of space (King et al., 1988; Knudsen and Brainard, 1991), and our previous work demonstrating that retinal and cortical visual map alignment in the SC requires the normal pattern of cholinergic retinal waves (Triplett et al., 2009).
To determine the mechanisms used to align somatotopic maps with visual maps, we examined the projection from S1 to the SC using axon tracing in wild-type and transgenic mice. We found that altering the organization of inputs between the retina and SC had no effect on topography of the S1–SC map. However, S1–SC topography was disrupted in mice lacking ephrin-As, supporting a model in which visual and somatosensory map alignment is achieved through a gradient-matching mechanism.
Materials and Methods
Mice.
Adult and juvenile congenic CD-1 or C57BL/6 mice or wild-type littermates of either sex were used as controls. Islet2-EphA3 knock-in and ephrin-A2/A3/A5 triple-knock-out (ephrin-A TKO) mice were generated and genotyped as previously described (Brown et al., 2000; Pfeiffenberger et al., 2006). Animals were cared for and used in accordance with guidelines of the U.S. Public Health Service Policy on Humane Care and Use of Laboratory Animals and the NIH Guide for the Care and Use of Laboratory Animals, and following institutional Association for Assessment and Accreditation of Laboratory Animal Care-approved practices.
Axon tracing.
Labeling of corticocollicular neuron projections was performed as described previously (Triplett et al., 2009). Briefly, adult mice were anesthetized by intraperitoneal injection of a ketamine/xylazine solution (100/10 mg/kg), and neonatal mice were anesthetized on ice. After exposing the skull, a focal craniotomy was performed over the desired injection site using a 25 gauge needle. A small amount of 1,1′-dioctadecyl-3,3,3′,3′-tetramethylindocarbocyanine (DiI) (10% in dimethyl formamide) (Invitrogen) was injected using a pulled glass pipette and Picospritzer III (Parker Instruments). For whole-eye fills to label all retinofugal axons, fluorescently conjugated B subunit of cholera toxin (2 mg/ml in PBS; CTB-488, Invitrogen) was injected intraocularly.
Tissue processing and imaging.
Animals were killed 1 week (adults) or 2 d (neonatal) postlabeling. Animals were perfused intracardially with PBS, followed by 4% paraformaldehyde. The brains were removed and fixed overnight in 4% paraformaldehyde. Brains were washed in PBS and embedded in 2% agarose in PBS before cutting 150 μm vibratome sections (World Precision Instruments) in the sagittal plane. Floating sections were mounted on slides, coverslipped, and imaged using an Olympus BX51 epifluorescent microscope and QImaging Retiga EXi digital camera as previously described (Triplett et al., 2009).
In situ hybridization. Complementary DNAs for ephrin-A5 [containing nucleotides 102–682 of the open reading frame (ORF)], ephrin-A2 (containing nucleotides 112–636 of the ORF), ephrin-A3 (containing nucleotides 100–687 of the ORF), EphA7 (containing nucleotides 721–1193 of the ORF), and EphA4 containing nucleotides 402–786 of the ORF) were used to make antisense and sense digoxigenin-labeled RNA probes. Frozen-section and whole-mount in situ hybridization was done as previously described (Feldheim et al., 1998).
Barrel field staining.
Adult mice were killed and perfused intracardially with ice-cold 4% paraformaldehyde. Brains were dissected out, and the cortical shells were removed. Cortices were flattened between two glass slides overnight in 4% paraformaldehyde. The following day, flattened cortices were sunk in 30% sucrose overnight. Horizontal sections were cut at 100 μm on a sliding microtome with freezing stage (Microm) and collected in phosphate buffer (0.5 m NaH2PO4, 0.15 m Na2HPO4, pH 7.4). Sections were stained overnight in cytochrome C staining buffer (in PB: 5% sucrose, 0.03% cytochrome C, 0.02% catalase, 0.05% diaminobenzidine). Reactions were stopped with 0.1% sodium azide, fixed overnight, and mounted on gelatin-coated slides.
Image analysis.
Quantifications were performed in the image-processing program ImageJ. To determine topography, the plot profile of a line running along the L–M axis of the cortex through the injection site was examined, and the location of the injection as a percentage was expressed of the lateromedial length. In the corresponding SC, the plot profile of a line running along the A-P axis through the termination zone (TZ) was examined, and the location of the center-most patch within the termination zone was expressed as a percentage of the anteroposterior length. These two values were plotted against one another and fit with a linear regression. To determine the relative size of TZs, the percentage of the SC A-P axis occupied by the TZ was divided by the size of the injection site (injection site area/cortex area). The average value in wild-type mice was set to 1 and used to normalize comparison with other genotypes. To quantify EphA and ephrin-A expression, the L–M extent of S1 or A-P length of the SC was divided into five equal bins. For each, the integrated density (mean gray value × area) was determined and divided by the maximal value.
Results
Corticocollicular somatosensory projections are mapped topographically
Previous studies of the organization of somatosensory information in the SC have relied on electrophysiological determination of receptive fields of collicular neurons (Dräger and Hubel, 1975; Rhoades, 1981; Benedetti, 1991) or tritiated thymidine labeling (Wise and Jones, 1977; Killackey and Erzurumlu, 1981). These investigations revealed a somatotopic representation along the A-P axis of the SC, such that neurons in the anterior SC respond to stimulation of whiskers closest to the nose, while those in the posterior SC are responsive to stimulation of the ears, trunk, and forepaws. In S1, a similar somatotopic organization is found in which the whiskers are represented laterally, and the head, trunk, forepaws, and hind limbs are represented progressively medially.
To determine the anatomical organization of S1 inputs in the SC, we focally injected DiI into S1 of adult mice and examined the terminations of labeled cells in the SC one week later. Parasagittal sectioning of the ipsilateral SC revealed that a single focal injection of DiI into S1 labels axons that terminate in the deep SC, ∼600 μm ventral to the surface of the SC and ∼250 μm ventral to the retinal input layer. Terminations were less precise than previously observed for corticocollicular projections arriving from V1. Instead of a single TZ, a single injection in S1 resulted in 2.5 ± 0.9 TZs, which as a group occupied 26.8 ± 5.0% of the anterior–posterior axis of the SC (Fig. 1). These results are consistent with experiments in which tritiated proline was injected into S1 of adult rats (Wise and Jones, 1977) and indicate that the precision of the S1–SC map alignment is significantly less than that seen in the V1-SC map (Triplett et al., 2009).
Figure 1.

S1 corticocollicular projections are mapped topographically. A, B, Parasagittal sections through the SC of wild-type mice in which DiI was injected in lateral (A) or medial (B) S1. Corticocollicular termination zones (red) can be visualized in the deep SC, ventral to the retinal recipient layer (green). C, Cytochrome-oxidase-stained section through S1 depicting a typical DiI injection site. D, Quantification of termination zone center location as a percentage of the A-P axis of the SC as a function of injection site along the L–M axis of the cortex. n = 17. Scale bars, 500 μm. D, Dorsal; A, anterior; M, medial.
Despite the patchy nature of S1–SC terminations, they are organized topographically, such that focal injections in lateral, central, and medial S1 resulted in groups of TZs in the anterior, central, and posterior regions of the SC, respectively (Fig. 1). Plotting the injection site position along the M-L axis of the cortex against the center of mass of the three most prominent TZs results in a linear relationship between the two (R2 = 0.619) (Fig. 1D), confirming that this projection is topographic. Together, these data show that S1 terminations are restricted to a single layer of the SC and organized topographically.
S1 corticocollicular projection is formed during early postnatal development
We next wanted to determine the time course of S1 corticocollicular refinement in early postnatal mice. Previous studies have shown that retinocollicular axons first arrive in the SC perinatally and refine topographically by postnatal day 6–7 (P6–P7) (Hindges et al., 2002; McLaughlin et al., 2003), and V1–SC projections enter the SC around P6 and refine by P12 (Triplett et al., 2009). We labeled S1 of P0 mice and examined the ipsilateral SC after 48 h. This revealed that axons are present in the SC as early as P2, but do not have well defined TZs (Fig. 2A). Over the following week, S1 axons refine and resemble adult TZs by P8 (Fig. 2B–D). This time course overlaps with that of retinocollicular projection refinement (McLaughlin et al., 2003) and is slightly earlier than that of visual cortical projection refinement (Triplett et al., 2009).
Figure 2.

Refinement of S1 corticocollicular projections during the first postnatal week. A–D, Parasagittal sections through the SC of wild-type mice aged P2 (n = 3; A), P4 (n = 4; B), P6 (n = 1; C), and P8 (n = 3; D) in which DiI was injected into medial S1. Final termination zone area is identifiable by P6 (dashed oval), and adult-like TZs are present by P8 (arrows). E, Quantification of the average termination zone size throughout development. **p < 0.01, Student's t test. F, Schematic of the time courses of development of neuronal inputs to the SC. Retinocollicular projections refine during the first postnatal week, while projections from V1 refine during the next week. Scale bar, 500 μm. D, Dorsal; A, anterior.
The retinocollicular projection is not a template for somatosensory map formation
Previously, we demonstrated that visual cortical axons change their termination pattern in the SC in response to altered retinocollicular input. To test whether projections from S1 are similarly influenced by the retinocollicular projection, we traced the S1–SC projection in Islet2-EphA3 knock-in (EphA3ki/ki) mice. In these mice, EphA3 is overexpressed in ∼40% of all retinal ganglion cells (RGCs) and not in other areas of the brain (Brown et al., 2000). As a result, neighboring RGCs express drastically different levels of total EphA receptor and terminate in different areas of the SC (Brown et al., 2000). This results in a duplication of azimuthal representation of space projected along the A-P axis of the SC (Brown et al., 2000; Triplett et al., 2009) (Fig. 3A). We reasoned that if retinal input is also instructive for mapping somatosensory inputs, a single injection of DiI in S1 of EphA3ki/ki mice should result in two groups of TZs in the SC in topographically inappropriate areas (Fig. 3A). However, if retinal input is not important for S1 mapping, then a single injection of DiI should result in a single group of topographically accurate TZs in the SC, similar to that found in wild-type mice (Fig. 3A).
Figure 3.

S1 corticocollicular projections are unchanged when visual inputs are predictably altered. A, Schematic of V1 corticocollicular mapping in wild-type and EphA3ki/ki mice and possible outcomes of S1 corticocollicular mapping. Top, In wild-type mice, the retina projects to the SC topographically, creating a single map, and V1 neurons project to a single location to establish alignment. In EphA3ki/ki mice, the retina's projection is duplicated, and V1 neurons project to two maps to maintain alignment. Bottom, Labeling of S1 neurons in EphA3ki/ki mice could result in two different termination patterns. S1 neurons could project to two termination areas, indicating activity-driven alignment with the duplicated retinal map. Alternatively, S1 neurons could project to a single termination area, indicating the use of independent mapping and alignment mechanisms. B, Quantification of termination zone center location as a percentage of the A-P axis of the SC as a function of injection site along the M-L axis of the cortex in wild-type (black, same as from Fig. 1D) and EphA3ki/ki mice (red). C, Quantification of the average termination zone size. No significant difference was found between wild-type (black) and EphA3ki/ki mice (red). D–F, Parasagittal sections through the SC of EphA3ki/ki mice in which DiI was injected in lateral (D), central (E), or medial (F) S1. Corticocollicular termination zones (red) can be visualized in the deep SC, ventral to the retinal recipient layer (green). n = 14. Scale bar, 500 μm. D, Dorsal; A, anterior.
Figure 3 shows that there is no change in the termination pattern of S1 inputs in EphA3ki/ki mice compared with wild-type animals; axons from lateral, central, and medial S1 terminate in the anterior, central, and posterior SC, respectively (Fig. 3B,D–F). To quantify these data, we determined the location of the center TZ along the A-P axis of the SC and plotted this against the position of the corresponding injection site along the L–M axis in the cortex (Fig. 3B). Similar to wild-type mice, there is a linear relationship between the injection site in S1 and the TZ location in the SC (R2 = 0.707). Additionally, there was no difference in the size of the TZs between wild-type and EphA3ki/ki mice (26.8 ± 5.0%, WT, n = 21 vs 28.3 ± 7.8%, EphA3ki/ki, n = 24). These data suggest that visual input does not influence S1 projection mapping in the SC, which is consistent with previous studies that showed that somatosensory receptive fields in the SC were unchanged in enucleated or anopthalmic animals (Benedetti, 1992; Khachab and Bruce, 1999; Champoux et al., 2008).
EphAs and ephrin-As are expressed in complementary gradients in S1 and the SC
Gradients of ephrin-As and EphAs are found throughout the brain and have been implicated in topographic mapping between many areas (Vanderhaeghen et al., 2000; Torii and Levitt, 2005; Galimberti et al., 2010; Wilks et al., 2010). Indeed, previous reports have shown complementary gradients of EphAs and ephrin-As in both S1 and the SC (Miller et al., 2006, Rashid et al., 2005). To confirm that EphAs and ephrin-As are expressed in the appropriate layers of S1 and the SC, we performed in situ hybridizations to detect the expression of EphAs and ephrin-As during development. In S1, ephrin-A5 is expressed in a high medial to low lateral gradient in layers 4/5, while ephrin-A2 and ephrin-A3 have lower expression (Fig. 4A–C). EphA7 is expressed in a complementary high lateral to low medial gradient (Fig. 4D). In the SC, ephrin-A2 and ephrin-A5 are expressed in high posterior to low anterior gradients throughout the depth of the SC, including the S1 recipient layer, while ephrin-A3 is expressed at lower levels (Fig. 5A–C). EphA4 and EphA7 are expressed in a complementary high anterior to low posterior gradient (Fig. 5D,E). These data are consistent with those previously described for these molecules in S1 (Vanderhaeghen et al., 2000; Miller et al., 2006) and the SC (Rashid et al., 2005) and show that EphA/ephrin-A signaling molecules are expressed in gradients at the appropriate developmental time and in the appropriate layers to direct topographic mapping of the S1–SC projection.
Figure 4.
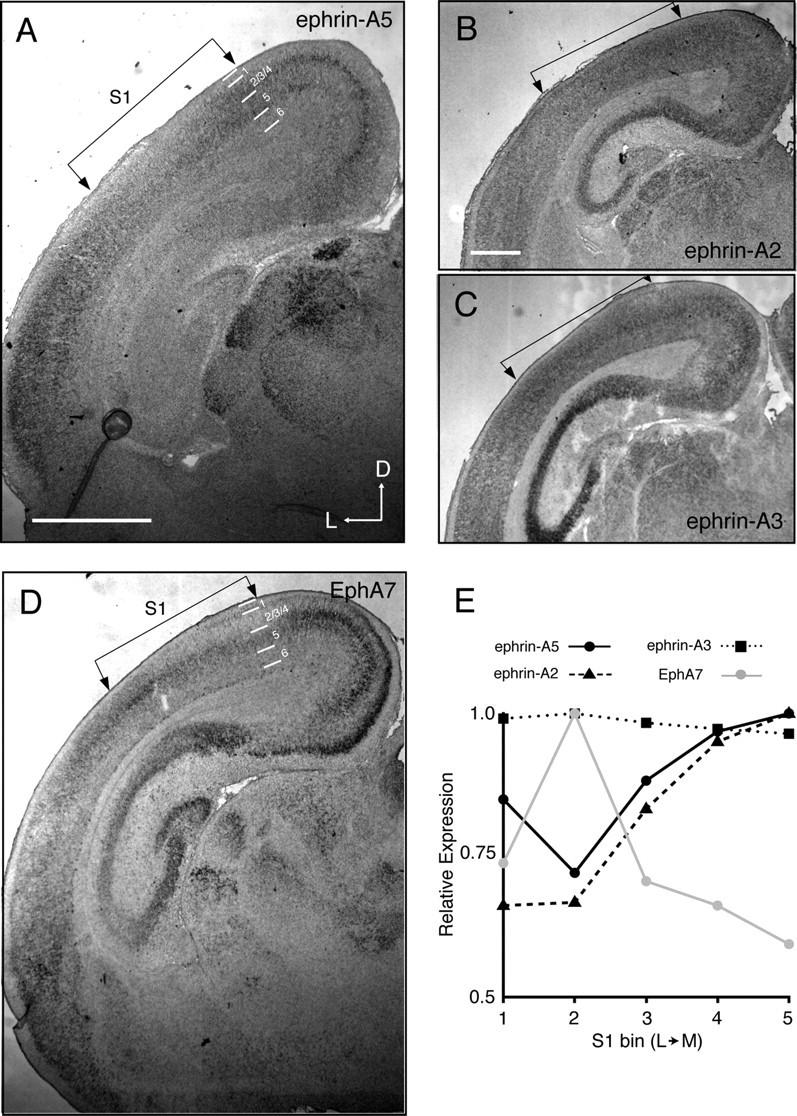
EphA and ephrin-A expression patterns in S1. A–D, Coronal sections through S1, of postnatal day 4 wild-type pups stained for ephrin-A5 (A) ephrin-A2 (B), ephrin-A3 (C), or EphA7 (D) expression. Putative cortical layers are indicated by lines. E, Quantification of the relative expression levels in layer 5 across the lateromedial axis in A–D. Scale bar, 1 mm. D, Dorsal; L, lateral.
Figure 5.
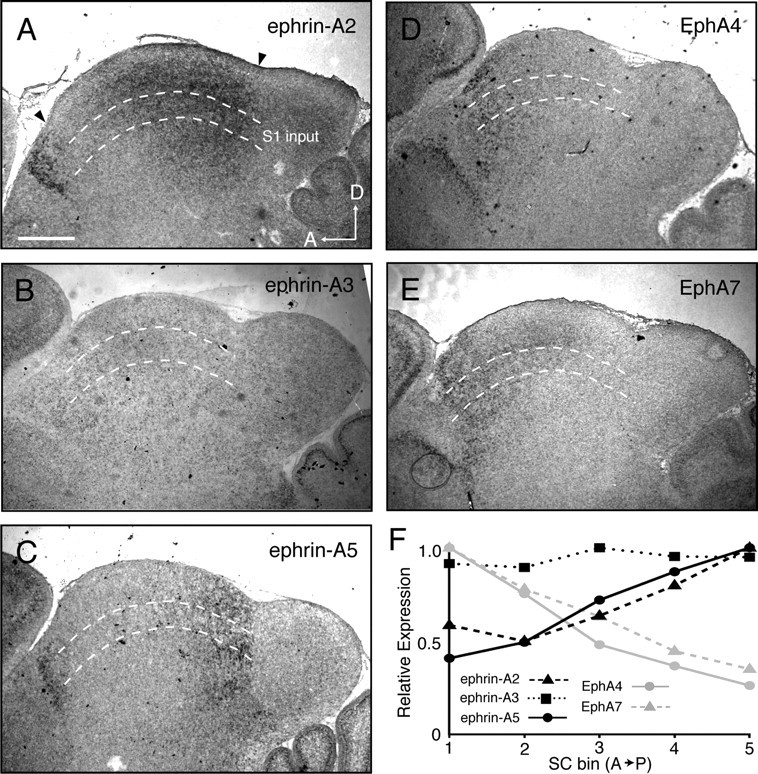
EphA and ephrin-A expression patterns in the SC. A–E, Parasagittal sections through the SC, marked by arrows, of postnatal day 4 wild-type pups stained for ephrin-A2 (A), ephrin-A3 (B), ephrin-A5 (C), EphA4 (D), and EphA7 (E) demonstrate expression in the deeper layers of the SC, including the S1-recipient layer (between dashed lines). F, Quantification of the relative expression levels in the SC across the anteroposterior axis in A–E. Scale bar, 500 μm. D, Dorsal; A, anterior.
Ephrin-As are required for S1–SC projection topography
Previous studies have demonstrated that EphA/ephrin-A signaling regulates the development of somatotopic map formation in the thalamus and cortex. Loss of ephrin-A5 results in aberrant whisker barrel formation in S1, but the overall topography of barrels remains intact (Prakash et al., 2000; Vanderhaeghen et al., 2000). Overexpression of EphAs in S1 also disrupts corticothalamic topography (Torii and Levitt, 2005). To determine whether ephrin-As act as topographic mapping labels in the S1–SC projection, we traced the S1 projection neurons in adult ephrin-A TKO mice (Pfeiffenberger et al., 2006). Terminations of S1 neurons in ephrin-A TKO mice were not restricted to the topographically appropriate area of the SC, but rather were spread throughout the A-P axis (Fig. 6). This is reflected in the total area of the TZs, which increased from 26.8 ± 5.0% of the SC in wild-type mice to 66.9 ± 11.5% in ephrin-A TKO mice. While the number of TZs in ephrin-A TKO mice increased from 2.5 ± 0.9 to 5.3 ± 1.9 TZs per injection, clearly defined TZs were still apparent, showing that ephrin-As are not involved in this aspect of their structure.
Figure 6.

Disrupted S1 corticocollicular topography in ephrin-A TKO mice. A–D, Parasagittal sections through the SC of wild-type (A, B) and ephrin-A TKO (C, D) in which DiI was injected in lateral (A, C) and medial (B, D) S1. E, Quantification of TZ size as a percentage of the A-P axis of the SC reveals a significant increase in ephrin-A TKO mice. F, Quantification of the number of patches per TZ in wild-type and ephrin-A TKO mice. n = 9. Scale bar, 500 μm. D, Dorsal; A, anterior. ***p < 0.001 vs wild-type mice, Student's t test.
Since loss of ephrin-A5 alone results in aberrant barrel formation, we wondered whether S1–SC projections in ephrin-A TKO mice were originating from a disrupted barrel map in S1. To visualize barrels, we stained for cytochrome oxidase activity. Interestingly, we found that barrels in ephrin-A TKO mice grossly resembled those in wild-type controls, and we found no significant change in overall barrel field size (Fig. 7A–C). To quantify subtle changes in barrel field organization, we determined the area of individual barrels and the intra-row and intra-arc barrel-to-barrel distances. On average, we found that individual barrels tended to be smaller in ephrin-A TKO mice compared with wild-type controls (Fig. 7D). In addition, we found changes in several barrel-to-barrel distances, but no particular region was more affected than others (Fig. 7E,F). These data show that overall topography of the barrel field in ephrin-A TKO mice resembles that of wild-type mice.
Figure 7.

Alterations in barrel cortex organization in ephrin-A TKO mice. A, B, Cytochrome oxidase-stained sections through the barrel cortex of wild-type (A) and ephrin-A TKO (B) mice. Barrels are organized into rows (lettered A–E) and arcs (numbered 1–9). Double-headed arrows illustrate intra-row and intra-arc measurements quantified in E and F; compare C5–C6 and B2–C2 distances in A and B. Arrow in B indicates a barrel significantly reduced in size (barrel E2), and arrowhead indicates an oddly shaped barrel (D1) observed in a single ephrin-A TKO mouse. C, Quantification of entire barrel field areas in wild-type and ephrin-A TKO mice revealed no significant difference. D, Quantification of individual area sizes in ephrin-A TKO mice expressed as the percentage change from wild-type mice revealed significant changes in several barrels. E, Quantification of barrel-to-barrel distances within each row of ephrin-A TKO mice expressed as the percentage change from wild-type. F, Quantification of barrel-to-barrel distances within each arc of ephrin-A TKO mice expressed as the percentage change from wild-type mice. n = 4 per group. Scale bar, 500 μm. *p < 0.05, **p < 0.01, not significant versus wild-type mice, Student's t test.
Discussion
The mammalian SC receives sensory inputs from multiple modalities, allowing for the detection of and response to a variety of stimuli. Each sensory modality is mapped topographically in a distinct lamina of the SC and in register with the maps of the other senses. Here, we examined the mechanism by which somatosensory inputs from S1 establish topography and achieve alignment with the visual map in the SC. In contrast to visual cortical inputs, we found that S1 inputs are not changed when retinal inputs are predictably altered in the SC. Instead, we found that ephrin-As are required to establish S1–SC topography. This leads to a model in which visual and somatosensory inputs in the SC are mapped independently, each using gradients of EphAs and ephrin-As that are distributed such that they align.
Organization of S1–SC projections
Consistent with previous electrophysiological and anatomical studies (Dräger and Hubel, 1975; Benedetti, 1991), we find that the L–M axis of S1 maps topographically along the A-P axis of the SC. However, this map is significantly less precise than either the retinal or cortical visual map. This makes sense, as individual whiskers overlap a great deal of visual space and can be moved within this space and need to be able to align with neurons monitoring a broader region of the visual field. Similar organization of S1–SC terminations was observed in the rat, which has similar overlapping visual and whisker receptive fields (Wise and Jones, 1977). Despite the patchy S1 TZs, previous electrophysiological studies of somatosensory responses in the SC did not report gaps in responsiveness (Dräger and Hubel, 1975; Benedetti, 1991), suggesting that other somatosensory projections may interdigitate with S1 inputs to establish a coherent map. Indeed, previous studies found similar patchy terminations from trigeminal neurons in the rat SC (Killackey and Erzurumlu, 1981).
Development of somatosensory topography in the SC
Previous work suggested that somatosensory responses in the SC could not be detected until after the eyes opened (approximately P14) (Benedetti, 1991), consistent with the possibility that the somatosensory representation might develop after the retinocollicular map. However, our anatomical tracings indicate that S1 projection neurons are present in the SC as early as P2, and refine to an adult-like pattern by P8. This time course overlaps significantly with retinal mapping in the SC (Hindges et al., 2002), and argues against the possibility that visual inputs might instruct the alignment of the somatosensory map. It is unclear why somatosensory responses are not detectable in the mouse SC until later if fibers are present and refined as early as P8. A similar phenomenon is seen in the cortex, where thalamocortical axons are almost completely refined by P4–P8 (Agmon et al., 1995); however, stimulation induces only a weak response until P13–P21 (Borgdorff et al., 2007). These data suggest that anatomic refinement precedes functional maturation of somatosensory responses in the SC.
Somatosensory inputs are mapped independently of visual input
To determine whether changes in the organization of visual inputs can instruct a change in somatosensory map topography, we traced S1–SC projections in EphA3ki/ki mice, a mouse in which the azimuth representation of visual space is duplicated along the A-P axis of the SC (Brown et al., 2000; Triplett et al., 2009). Despite the dramatic rearrangement of retinal inputs, we observed no alteration in the organization of S1 inputs to the SC. These data are consistent with the fact that monocular enucleation at birth elicits no effect on somatosensory topography in several animal models (Rhoades, 1980; Benedetti, 1992; Champoux et al., 2008). This is in contrast to V1 neurons, which rearrange their projections to align with the duplicated retinocollicular map in the SC of EphA3ki/ki mice. This rearrangement is dependent on the normal pattern of retinal waves that are postulated to drive similar activity in V1 and the SC. Neurons in S1 are not connected to the retina and, therefore, cannot be driven to fire by retinal waves. Thus, S1–SC neurons cannot use the relative positional information that V1–SC neurons use, and instead rely on other mechanisms to establish somatopic–visuotopic alignment.
Experiments in the barn owl suggest that shifts in visual input cause concomitant changes in auditory tuning even if the shift occurred after alignment between both maps was established (Feldman and Knudsen, 1997). Cortical somatosensory inputs to the SC exhibit extensive plasticity in response to visual deafferentation (Mundiñano and Martínez-Millán, 2010). Thus, it is possible that similar mechanisms can influence an already established S1–SC projection, which we plan to investigate in the future. However, the rearrangement of auditory maps may be specific to this modality, since spatiotopy in this modality is first observed in the SC. Our data also suggest that in the SC of EphA3ki/ki mice the visuotopic and somatotopic representations are misaligned. However, it is possible that the representations remain aligned in the EphA3ki/ki SC due to the rough nature of topography that we and others have observed in the S1–SC projection (Wise and Jones, 1977). For example, receptive fields of somatosensory neurons in the SC may be large enough, even in wild-type mice, to overlap with visual inputs despite the duplication of the visual azimuth. Alternatively, dendritic rearrangements of collicular neurons may compensate for the misalignment between visual and somatosensory maps. Future studies in which electrophysiology is used to determine somatosensory topography in EphA3ki/ki mice will address these issues.
Ephrin-As guide topographic organization of S1–SC inputs
Our results suggest that EphA/ephrin-A signaling is required for S1–SC projection mapping. Multiple ephrin-As and EphAs are expressed in gradients along the M-L axis of S1 and the A-P axis of the SC. Mutations in ephrin-A5 and overexpression of EphA7 in S1/S2 results in aberrant topography of projections to the ventral posterior medial nucleus of the thalamus (Torii and Levitt, 2005). Here, we traced S1–SC projections in mice lacking ephrin-A2, -A3, and -A5 and found that topography of the S1–SC projection was severely disrupted, suggesting these molecules guide the independent alignment of visual and somatosensory maps in the SC. These data do not rule out the possibility, however, that changes in trigeminal input organization in the SC could influence S1–SC mapping in an activity-dependent manner. Interestingly, TZs were still refined within the somatosensory recipient layer, suggesting that cortical fibers in the SC may compete with other somatosensory inputs from the trigeminal nucleus, using a process that is not regulated by ephrin-As.
A potential complication of our interpretation of the results in ephrin-A TKO mice comes from the fact that loss of ephrin-A5 alone results in altered organization of the S1 barrel field (Prakash et al., 2000; Vanderhaeghen et al., 2000). This raises the possibility that S1–SC neurons are projecting from an initially disrupted barrel field and that ephrin-As do not guide these neurons in the SC. To control for this possibility, we examined the architecture of the S1 barrel field in mutant animals. Similar to single ephrin-A5 mutants, we found contractions in size and distances between several barrels; however, in ephrin-A TKO mice no compensatory expansion was observed (Vanderhaeghen et al., 2000). The reason for this difference is unclear, but suggest that ephrin-A2 and/or -A3 have a subtle function in barrel field formation. Nonetheless, the overall structure of the barrel field was intact in ephrin-A TKO mice. The exact signaling mechanisms invoked during S1–SC mapping are unclear, since both EphAs and ephrin-As can act as receptors on axons and as ligands on target cells (Triplett and Feldheim, 2012). Because we find both EphAs and ephrin-As expressed in both S1 and the SC, and the ephrin-A TKO removes these molecules from both areas, we cannot determine whether ephrin-As are required in S1, the SC, or both. Future experiments using conditional alleles of EphA7 or ephrin-A5 will help distinguish between models of EphA/ephrin-A signaling in guiding the S1–SC projection.
Comparison of V1 and S1 mapping in the SC
In combination with previous studies of topographic map formation and multimodal alignment in the SC, a model for this process emerges in which distinct afferents use different mechanisms to achieve alignment. We propose that both retinal and somatosensory inputs are mapped in their respective layers through the use of ephrin-A/EphA signaling during the first postnatal week. Since each of these projections makes use of the same molecular gradients, a rough alignment is achieved. Following this, visual cortical neurons and auditory inputs enter the SC and sample the environment, terminating in areas with similar activity patterns. For visual cortical neurons, this is achieved through spontaneous waves of activity propagating throughout the visual centers. For auditory neurons, this may be achieved through experience-dependent plasticity.
In summation, the EphA3ki/ki and ephrin-A mutant mice may provide models that can be used to understand the mechanisms and functions of multimodal processing. We find that in these mice, it is likely that the visual and somatosensory maps are misaligned. How do multisensory neurons in the deep SC cope with misaligned visual and somatosensory maps, and what is the consequence on the resulting SC-directed behaviors in these mice? Future investigations using electrophysiological and behavioral methods are needed to address these questions.
Footnotes
This work was supported by NIH Grant R01-EY014689 (to D.A.F.). J.W.T. was supported by NIH National Research Service Award Fellowship F32-EY18531. We thank Neal Sweeney for critical reading and discussion of the manuscript.
References
- Agmon A, Yang LT, Jones EG, O'Dowd DK. Topological precision in the thalamic projection to neonatal mouse barrel cortex. J Neurosci. 1995;15:549–561. doi: 10.1523/JNEUROSCI.15-01-00549.1995. [DOI] [PMC free article] [PubMed] [Google Scholar]
- Benedetti F. The postnatal emergence of a functional somatosensory representation in the superior colliculus of the mouse. Brain Res Dev Brain Res. 1991;60:51–57. doi: 10.1016/0165-3806(91)90154-b. [DOI] [PubMed] [Google Scholar]
- Benedetti F. The development of the somatosensory representation in the superior colliculus of visually deprived mice. Brain Res Dev Brain Res. 1992;65:173–178. doi: 10.1016/0165-3806(92)90176-w. [DOI] [PubMed] [Google Scholar]
- Borgdorff AJ, Poulet JF, Petersen CC. Facilitating sensory responses in developing mouse somatosensory barrel cortex. J Neurophysiol. 2007;97:2992–3003. doi: 10.1152/jn.00013.2007. [DOI] [PubMed] [Google Scholar]
- Brown A, Yates PA, Burrola P, Ortuño D, Vaidya A, Jessell TM, Pfaff SL, O'Leary DD, Lemke G. Topographic mapping from the retina to the midbrain is controlled by relative but not absolute levels of EphA receptor signaling. Cell. 2000;102:77–88. doi: 10.1016/s0092-8674(00)00012-x. [DOI] [PubMed] [Google Scholar]
- Cang J, Rentería RC, Kaneko M, Liu X, Copenhagen DR, Stryker MP. Development of precise maps in visual cortex requires patterned spontaneous activity in the retina. Neuron. 2005;48:797–809. doi: 10.1016/j.neuron.2005.09.015. [DOI] [PMC free article] [PubMed] [Google Scholar]
- Cang J, Wang L, Stryker MP, Feldheim DA. Roles of ephrin-as and structured activity in the development of functional maps in the superior colliculus. J Neurosci. 2008;28:11015–11023. doi: 10.1523/JNEUROSCI.2478-08.2008. [DOI] [PMC free article] [PubMed] [Google Scholar]
- Chalupa LM, Rhoades RW. Responses of visual, somatosensory, and auditory neurones in the golden hamster's superior colliculus. J Physiol. 1977;270:595–626. doi: 10.1113/jphysiol.1977.sp011971. [DOI] [PMC free article] [PubMed] [Google Scholar]
- Champoux F, Bacon BA, Lepore F, Guillemot JP. Effects of early binocular enucleation on auditory and somatosensory coding in the superior colliculus of the rat. Brain Res. 2008;1191:84–95. doi: 10.1016/j.brainres.2007.11.003. [DOI] [PubMed] [Google Scholar]
- Dräger UC, Hubel DH. Physiology of visual cells in mouse superior colliculus and correlation with somatosensory and auditory input. Nature. 1975;253:203–204. doi: 10.1038/253203a0. [DOI] [PubMed] [Google Scholar]
- Dräger UC, Hubel DH. Topography of visual and somatosensory projections to mouse superior colliculus. J Neurophysiol. 1976;39:91–101. doi: 10.1152/jn.1976.39.1.91. [DOI] [PubMed] [Google Scholar]
- Feldheim DA, Vanderhaeghen P, Hansen MJ, Frisén J, Lu Q, Barbacid M, Flanagan JG. Topographic guidance labels in a sensory projection to the forebrain. Neuron. 1998;21:1303–1313. doi: 10.1016/s0896-6273(00)80650-9. [DOI] [PubMed] [Google Scholar]
- Feldheim DA, Kim YI, Bergemann AD, Frisén J, Barbacid M, Flanagan JG. Genetic analysis of ephrin-A2 and ephrin-A5 shows their requirement in multiple aspects of retinocollicular mapping. Neuron. 2000;25:563–574. doi: 10.1016/s0896-6273(00)81060-0. [DOI] [PubMed] [Google Scholar]
- Feldman DE, Knudsen EI. An anatomical basis for visual calibration of the auditory space map in the barn owl's midbrain. J Neurosci. 1997;17:6820–6837. doi: 10.1523/JNEUROSCI.17-17-06820.1997. [DOI] [PMC free article] [PubMed] [Google Scholar]
- Finlay BL, Schneps SE, Wilson KG, Schneider GE. Topography of visual and somatosensory projections to the superior colliculus of the golden hamster. Brain Res. 1978;142:223–235. doi: 10.1016/0006-8993(78)90632-7. [DOI] [PubMed] [Google Scholar]
- Galimberti I, Bednarek E, Donato F, Caroni P. EphA4 signaling in juveniles establishes topographic specificity of structural plasticity in the hippocampus. Neuron. 2010;65:627–642. doi: 10.1016/j.neuron.2010.02.016. [DOI] [PubMed] [Google Scholar]
- Hindges R, McLaughlin T, Genoud N, Henkemeyer M, O'Leary DD. EphB forward signaling controls directional branch extension and arborization required for dorsal-ventral retinotopic mapping. Neuron. 2002;35:475–487. doi: 10.1016/s0896-6273(02)00799-7. [DOI] [PubMed] [Google Scholar]
- Khachab MY, Bruce LL. The development of corticocollicular projections in anophthalmic mice. Brain Res Dev Brain Res. 1999;114:179–192. doi: 10.1016/s0165-3806(99)00020-6. [DOI] [PubMed] [Google Scholar]
- Killackey HP, Erzurumlu RS. Trigeminal projections to the superior colliculus of the rat. J Comp Neurol. 1981;201:221–242. doi: 10.1002/cne.902010207. [DOI] [PubMed] [Google Scholar]
- King AJ, Hutchings ME, Moore DR, Blakemore C. Developmental plasticity in the visual and auditory representations in the mammalian superior colliculus. Nature. 1988;332:73–76. doi: 10.1038/332073a0. [DOI] [PubMed] [Google Scholar]
- Knudsen EI, Brainard MS. Visual instruction of the neural map of auditory space in the developing optic tectum. Science. 1991;253:85–87. doi: 10.1126/science.2063209. [DOI] [PubMed] [Google Scholar]
- May PJ. The mammalian superior colliculus: laminar structure and connections. Prog Brain Res. 2006;151:321–378. doi: 10.1016/S0079-6123(05)51011-2. [DOI] [PubMed] [Google Scholar]
- McLaughlin T, Torborg CL, Feller MB, O'Leary DD. Retinotopic map refinement requires spontaneous retinal waves during a brief critical period of development. Neuron. 2003;40:1147–1160. doi: 10.1016/s0896-6273(03)00790-6. [DOI] [PubMed] [Google Scholar]
- Miller K, Kolk SM, Donoghue MJ. EphA7-ephrin-A5 signaling in mouse somatosensory cortex: developmental restriction of molecular domains and postnatal maintenance of functional compartments. J Comp Neurol. 2006;496:627–642. doi: 10.1002/cne.20926. [DOI] [PubMed] [Google Scholar]
- Mundiñano IC, Martínez-Millán L. Somatosensory cross-modal plasticity in the superior colliculus of visually deafferented rats. Neuroscience. 2010;165:1457–1470. doi: 10.1016/j.neuroscience.2009.11.041. [DOI] [PubMed] [Google Scholar]
- Pfeiffenberger C, Yamada J, Feldheim DA. Ephrin-As and patterned retinal activity act together in the development of topographic maps in the primary visual system. J Neurosci. 2006;26:12873–12884. doi: 10.1523/JNEUROSCI.3595-06.2006. [DOI] [PMC free article] [PubMed] [Google Scholar]
- Prakash N, Vanderhaeghen P, Cohen-Cory S, Frisén J, Flanagan JG, Frostig RD. Malformation of the functional organization of somatosensory cortex in adult ephrin-A5 knock-out mice revealed by in vivo functional imaging. J Neurosci. 2000;20:5841–5847. doi: 10.1523/JNEUROSCI.20-15-05841.2000. [DOI] [PMC free article] [PubMed] [Google Scholar]
- Rashid T, Upton AL, Blentic A, Ciossek T, Knöll B, Thompson ID, Drescher U. Opposing gradients of ephrin-As and EphA7 in the superior colliculus are essential for topographic mapping in the mammalian visual system. Neuron. 2005;47:57–69. doi: 10.1016/j.neuron.2005.05.030. [DOI] [PubMed] [Google Scholar]
- Rhoades RW. Effects of neonatal enucleation on the functional organization of the superior colliculus in the golden hamster. J Physiol. 1980;301:383–399. doi: 10.1113/jphysiol.1980.sp013212. [DOI] [PMC free article] [PubMed] [Google Scholar]
- Rhoades RW. Cortical and spinal somatosensory input to the superior colliculus in the golden hamster: an anatomical and electrophysiological study. J Comp Neurol. 1981;195:415–432. doi: 10.1002/cne.901950304. [DOI] [PubMed] [Google Scholar]
- Tiao YC, Blakemore C. Functional organization in the superior colliculus of the golden hamster. J Comp Neurol. 1976;168:483–503. doi: 10.1002/cne.901680404. [DOI] [PubMed] [Google Scholar]
- Torii M, Levitt P. Dissociation of corticothalamic and thalamocortical axon targeting by an EphA7-mediated mechanism. Neuron. 2005;48:563–575. doi: 10.1016/j.neuron.2005.09.021. [DOI] [PubMed] [Google Scholar]
- Triplett JW, Feldheim DA. Eph and ephrin signaling in the formation of topographic maps. Semin Cell Dev Biol. 2012;23:7–15. doi: 10.1016/j.semcdb.2011.10.026. [DOI] [PMC free article] [PubMed] [Google Scholar]
- Triplett JW, Owens MT, Yamada J, Lemke G, Cang J, Stryker MP, Feldheim DA. Retinal input instructs alignment of visual topographic maps. Cell. 2009;139:175–185. doi: 10.1016/j.cell.2009.08.028. [DOI] [PMC free article] [PubMed] [Google Scholar]
- Vanderhaeghen P, Lu Q, Prakash N, Frisén J, Walsh CA, Frostig RD, Flanagan JG. A mapping label required for normal scale of body representation in the cortex. Nat Neurosci. 2000;3:358–365. doi: 10.1038/73929. [DOI] [PubMed] [Google Scholar]
- Wallace MT, Wilkinson LK, Stein BE. Representation and integration of multiple sensory inputs in primate superior colliculus. J Neurophysiol. 1996;76:1246–1266. doi: 10.1152/jn.1996.76.2.1246. [DOI] [PubMed] [Google Scholar]
- Wilks TA, Rodger J, Harvey AR. A role for ephrin-As in maintaining topographic organization in register across interconnected central visual pathways. Eur J Neurosci. 2010;31:613–622. doi: 10.1111/j.1460-9568.2010.07111.x. [DOI] [PubMed] [Google Scholar]
- Wise SP, Jones EG. Somatotopic and columnar organization in the corticotectal projection of the rat somatic sensory cortex. Brain Res. 1977;133:223–235. doi: 10.1016/0006-8993(77)90760-0. [DOI] [PubMed] [Google Scholar]