

Abstract
It has been reported that individuals with autism spectrum disorder (ASD) have abnormal responses to the sensory environment. For these individuals sensory overload can impair functioning, raise physiological stress, and adversely affect social interaction. Early-stage (i.e. within 200ms of stimulus onset) auditory processing abnormalities have been widely examined in ASD using event-related potentials (ERP), while ERP studies investigating early-stage visual processing in ASD are less frequent. We wanted to test the hypothesis of early-stage visual processing abnormalities in ASD by investigating ERPs elicited in a visual oddball task using illusory figures. Our results indicate that individuals with ASD have abnormally large cortical responses to task irrelevant stimuli over both parieto-occipital and frontal regions-of-interest (ROI) during early stages of visual processing compared to the control group. Furthermore, ASD patients showed signs of an overall disruption in stimulus discrimination, and had a significantly higher rate of motor response errors.
Keywords: Autism, event-related potentials, EEG, visual processing, evoked potentials
Introduction
Autism Spectrum Disorder (ASD) includes three conditions sharing a similar core symptomatology: Autism, Asperger syndrome, and Pervasive Developmental Disorder Not Otherwise Specified (PDD-NOS). ASD is characterized by severe disturbances in reciprocal social relations, varying degrees of language and communication difficulty, and restricted, repetitive and stereotyped behavioral patterns [1]. It has also been suggested that individuals with ASD have sensory abnormalities indicated by hypersensitivity and an extraordinary interest in certain sensations [2]. In fact, it has been proposed that sensory-perceptual abnormalities are present in approximately 90% of individuals with autism [3]. An avoidance of external stimulation in ASD may be due to altered inhibitory control of sensory intake [4], and for these individuals sensory overload can impair functioning, raise physiological stress, and adversely affect social interaction [5].
Event-related potentials (ERP) provide a unique method of characterizing the magnitude and time course of brain activity associated with both auditory and visual perception. ERPs represent transient changes in the electrical activity of the brain in response to a given stimulus or event [6] and consist of component waveforms spanning from as early as 50 ms post-stimulus to up to 600–1000 ms post-stimulus. For example, in the components N100 and P200 the letter indicates the polarity and the number indicates the period after onset of the stimulus, i.e. 100 is in the 100–200 ms period (or earlier) and 200 is in the 200–300 ms period [7, 8]. Generally components in the first 50–200 ms are considered early, exogenous field potentials reflecting ‘pre-attentive’ processes and the processing of physical attributes of a stimulus [9, 10] while those after 200 ms represent endogenous field potentials reflecting polymodal associative processing and later-stage attentional processes (e.g. sustained attention, perceptual closure) [11, 12, 13].
Auditory processing abnormalities have been widely examined in ASD using ERPs (see [14] for review). Briefly, individuals with ASD have been shown to have normal brainstem auditory evoked potentials (AEPs) [15–16]. However, the most consistently reported auditory ERP abnormality is attenuated amplitude of the centroparietal P300 in various auditory stimulus presentation paradigms in ASD patients of all ages [17]. Also, the short-latency fronto-central N100 has reliably been found to be attenuated in amplitude and latency during tasks involving target detection and tones of varying frequency and intensity [18–21]. Furthermore, the mismatch negativity (MMN), a large negative deflection occurring when frequent stimuli are subtracted from infrequent stimuli, has commonly been found to be prolonged in latency in response to pitch deviants [22, 23, 24].
ERP studies investigating early-stage visual processing in ASD are less frequent (see [6] for review) especially in comparison to other psychopathologies like schizophrenia [25–29]. ERP studies of visual processing commonly employ an ‘oddball’ discrimination task in which the participant responds to an infrequent target stimulus among more frequent non-target stimuli [30]. Most investigations into visual processing in ASD have focused on higher-level, long-latency ERPs, like the P300 [31–39]. In brief centroparietal P300 amplitude has been found to be similar [31, 32, 33, 38, 39] reduced [34, 37] and augmented [36] in ASD patients to target stimuli compared to controls. Remarkably to our knowledge there have only been two studies reporting on short-latency (i.e., 50–200 ms) visual ERPs in ASD and one was by our group [40]; Courchesne et al. [32] included the N100 and P200 among later components in their analysis.
Visual processing is based on a core system consisting of occipito-temporal regions in extrastriate visual cortex [41] although parietal [42] and frontal [43] regions also play a role in directing visual attention. The earliest electrical sign of cortical activity observed in humans (commonly referred to the P100) during visual tasks [44] can occur as early as 50 ms post stimulus [45] to as late as 160 ms depending on topography and visual task and reflects early categorization and recognition processes [46]. The visual P100 likely has posterior generators in the primary visual cortex, extrastriate areas [29] and fusiform gyrus [47], while the anterior P100 likely reflects the activation of frontal generators [43]. The P100 may reflect early sensory processing of attended stimuli [41] and is generally larger to attended visual stimuli thus giving evidence of orientated attention [48]. We will refer to this early visual component as P50 instead of P100 due to the peak latency after stimulus onset (i.e., 40–90 ms post-stimulus over parieto-occipital sites and 40–100 ms post-stimulus over frontal sites).
The visual N100 directly follows the P100 and is similarly considered an index of stimulus discrimination [49, 50]. The N100 is generally defined within a time window starting as early as 70 ms post stimulus onset [32] to as late as 180 ms post stimulus onset [29]. Over posterior electrode sites the visual N100 is probably generated by dipoles in lateral extrastriate cortex [51] with a contribution from parieto-occipital and occipito-temporal areas [49, 52]; while the visual N100 over frontal electrode sites most likely is reflective of frontal generators [43]. The visual N100 generally is augmented during attentional stimulus processing, which is also know as the “N1-effect” [53], and is larger towards task-relevant target stimuli [7, 48].
The visual P200 over frontal electrode sites is generally found in a latency range of 180–320 ms poststimulus and has been reported in working memory and attention tasks. Kenemans, Kok, & Smulders [54] described this frontal positivity as a component that indexes the hierarchical selection of task-relevant features for further processing. Over inferior frontal recording sites source localization places dipoles of this component in the orbito-frontal cortex [55, 56]. The visual P200 over posterior regions has been less studied but likely is associated with generators in the primary visual cortex and extrastriate areas reflecting visual categorization processes.
The present study was designed to evaluate the cortical responses of Kanizsa visual stimuli evoked at short latencies over frontal and parieto-occipital regions-of-interest (ROI) in both children with ASD and typical age-matched controls: Kanizsa stimuli consist of inducer disks of a shape feature and either constitute an illusory figure (square, triangle) or not (colinearity feature). For the purposes of this study the stimuli consisted of Kanizsa targets, Kanizsa non-targets, and non-Kanizsa stimuli. We focused our analysis on short-latency field potentials, P50, N100, and P200, with the intent of gaining insight into early-stage visual processing abnormalities associated with ASD. Unlike our previous paper [40] we included the visually associated, parieto-occipital region-of-interest (ROI) in order to better capture early-stage, visual activity associated with extrastriate areas. The frontal ROI was included as it is associated with working memory, executive function, and selective attention. We hypothesized that individuals with ASD will manifest deficits in early-stage visual processing shown by an augmentation of evoked potentials elicited by task-irrelevant distracter stimuli in early stages of visual processing, and this will consequently disrupt stimulus discrimination as compared to the control group.
Experimental Procedures
Participants
Participants with autism spectrum disorder (ASD) (age range 9 to 20 years) were recruited through the University of Louisville Weisskopf Child Evaluation Center (WCEC). Diagnosis was made according to the Diagnostic and Statistical Manual of Mental Disorders (DSM-IV-TR) [1] and further ascertained with the Autism Diagnostic Interview – Revised (ADI-R) [57]. They also had a medical evaluation by a developmental pediatrician. All subjects had normal hearing based on past hearing screens. Participants either had normal vision or wore corrective lenses. Participants with a history of seizure disorder, significant hearing or visual impairment, a brain abnormality conclusive from imaging studies or an identified genetic disorder were excluded. All participants were high-functioning persons with ASD with full-scale IQ >80 assessed using the Wechsler Intelligence Scale for Children, Fourth Edition [58] or the Wechsler Abbreviated Scale of Intelligence [59].
Controls were recruited through advertisements in the local media. All control participants were free of neurological or significant medical disorders, had normal hearing and vision, and were free of psychiatric, learning, or developmental disorders based on self- and parent reports. Subjects were screened for history of psychiatric or neurological diagnosis using the Structured Clinical Interview for DSM-IV Non-Patient Edition [60]. An attempt was made to match participants within the control and autism groups by age, full-scale IQ, and socioeconomic status of their family. Socioeconomic status of ASD and control groups was compared based on parent education and annual household income. Participants in both groups had similar parent education levels.
The study complied with all relevant national regulations and institutional policies and has been approved by the local Institutional Review Board (IRB). Participating subjects and their parents (or legal guardians) were provided with full information about the study including the purpose, requirements, responsibilities, reimbursement, risks, benefits, alternatives, and role of the local IRB. The consent and assent forms approved by the IRB were reviewed and explained to all subjects who expressed interest to participate. All questions were answered before consent signature was requested. If the individual agreed to participate, she/he signed and dated the consent form and received a copy countersigned by the investigator who obtained consent.
ERP data acquisition, and signal processing
Electroencephalographic (EEG) data were acquired with a 128 channel Electrical Geodesics Inc. (EGI) system (v. 200) consisting of Geodesic Sensor Net electrodes, Net Amps and Net Station software (Electrical Geodesics Inc., Eugene, OR) running on a Macintosh G4 computer. EEG data were sampled at 500 Hz and filtered using a 0.1 – 200 Hz analog filter. Impedances were kept under 50 KΩ. According to the Technical Manual of EGI (2003) this Net Sensor electrode impedance level is sufficient for quality recording of EEG with this system. A study conducted by Ferree, Luu, Russell, & Tucker [61] suggested that modern high input-impedance amplifiers and accurate digital filters for power noise provide excellent EEG signal collection with high scalp impedance (approximately 40 KΩ).
The Geodesic Sensor Net is a lightweight elastic thread structure containing Ag/AgCl electrodes housed in a synthetic sponge on a pedestal. The sponges were soaked in a KCl solution to render them conductive. EEG data were recorded continuously. EEG channels with high impedance or visually detectable artifacts (e.g., channel drift, gross movement, etc.) were identified using Net Station event marker tools in ‘on-line’ mode and removed in the ‘off-line’ mode using Net Station Waveform Tools (NSWT). Stimulus-locked EEG data were segmented off-line into 1000 ms epochs spanning 200 ms pre-stimulus to 800 ms post-stimulus around the critical stimulus events: e.g., in an oddball task: (1) rare target (Kanizsa square), (2) rare non-target distracter (Kanizsa triangle), (3) frequent non-target (non-Kanizsa standards). Data were digitally screened for artifacts (eye blinks, movements), and contaminated trials were removed using artifact rejection tools. The Net Station Waveform Tools’ Artifact Detection module in ‘off-line’ mode marks EEG channels ‘bad’ if fast average amplitude exceeds 200 µV, differential average amplitude exceeds 100 µV, or if the channel has zero variance. Segments were marked ‘bad’ if they contain more than 10 bad channels or if eye blinks or eye movements are detected (> 70 µV). After detection of bad channels, the NSWT’s ‘Bad channel replacement’ function was used for the replacement of data in bad channels with data interpolated from the remaining good channels (or segments) using spherical splines (more information on interpolation methods used in EGI Net Station systems can be found in [62–65]).
The remaining data for correct trials was digitally filtered using 60 Hz Notch and 0.3–20 Hz bandpass filters and are then segmented by condition and averaged to create ERPs. Averaged ERP data was baseline corrected and re-referenced into an average reference frame. All stimulus presentation and behavioral response collection was controlled by a PC computer running E-prime software (Psychology Software Tools Inc., PA). Visual stimuli were presented on a 15" display, and manual responses were collected with a 5-button keypad (Serial Box, Psychology Software Tools, Inc, PA).
Three stimuli visual oddball with illusory Kanizsa figures
In this task subjects were required to respond with a button-press to rare (25% probability) Kanizsa squares (targets) among Kanizsa triangles (rare non-target distracters, 25% probability) and non-Kanizsa figures (standards, 50% probability). The stimuli were presented for 250 ms with inter-trial intervals (ITI) varying in the range of 1100 –1300 ms. A fixation point (cross) was presented during ITI (Figure 1). White figures were displayed on a black background on a flat monitor. Subjects were instructed to press the first button on a 5-keypad with their right index finger when a target appears, and ignore when non-target Kanizsa or standard stimuli appear. This task is a classic three-stimuli ‘oddball’ with rare target and distracter stimuli presented among frequent standards. The non-target Kanizsa triangle was introduced to differentiate processing of Kanizsa figures and targets. The stimuli consist of either three or four inducer disks which are considered the shape feature, and they either constitute an illusory figure (square, triangle) or not (collinearity feature).
Figure 1.
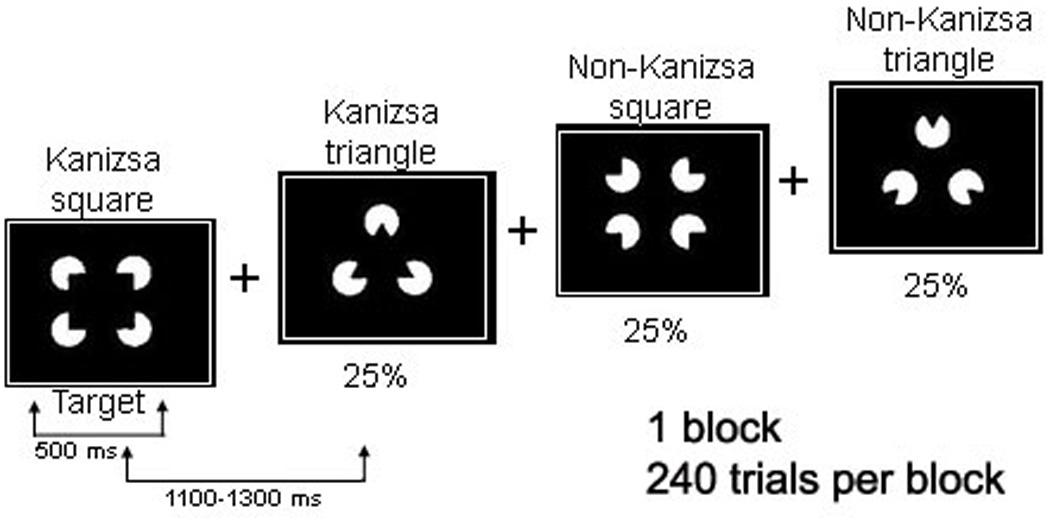
We used Kanizsa and non-Kanizsa figures as stimulus material in this experiment. In particular, the stimulus types are Kanizsa square (target), Kanizsa triangle, non-Kanizsa square, and non-Kanizsa triangle. The non-target Kanizsa triangle is introduced to differentiate processing of Kanizsa figures and targets. The stimuli consist of either three or four inducer disks which are considered the shape feature, and they either constitute an illusory figure (square, triangle) or not (collinearity feature).
Behavioral measures
Behavioral response measures were mean reaction time (in ms) and response accuracy (percent of correct hits). Both commission and omission error rates were calculated.
Event-Related Potentials (ERP)
ERP dependent measures were: adaptive mean amplitude and latency of ERP peaks (e.g., N100) within a temporal window across a region-of-interest (ROI) channel group. Each ROI contained at least 4 electrodes. A list of ERP dependent variables included stimulus-averaged amplitude and latency of the frontal ERP components: P50 (40–100 ms post-stimulus), N100 (90–180 ms), P200 (180–280 ms), and the posterior (parieto-occipital ROIs) ERP components P50 (40–90 ms), N100 (80–180 ms), and P200 (160–250 ms). The frontal (i.e., frontal and fronto-central) ROIs for P50, N100, and P200 components included the following EGI channels: left ROI – EGI channel 29, F3, FC1, FC3; midline ROI – Fz, FCz, EGI channels 5,12; right ROI – EGI channel 118, F4, FC2, FC4. The parieto-occipital (i.e., parieto-occipital and occipital) ROIs for P50, N100, and P200 components included following EGI channels: left ROI – EGI channel 67, PO3, PO7, O1; right ROI – EGI channel 78, PO4, PO8, O2. Midline parieto-occipital (POz and EGI channel 73) channels were used in combination with the left and right parieto-occipital ROIs to form a comprehensive parieto-occipital ROI containing 10 EEG channels (Figure 2) [66].
Figure 2.
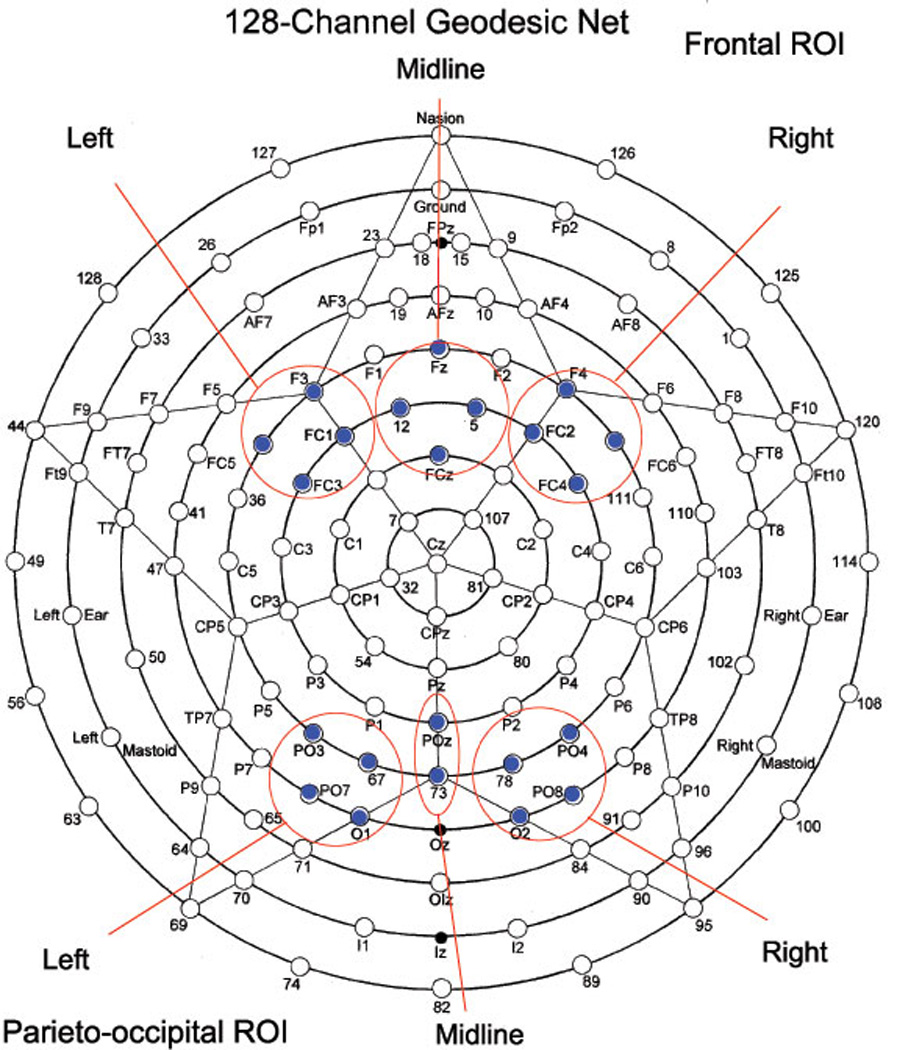
Sensor layout of the 128-channel geodesic sensor net (EGI, Eugene, Oregon) with frontal and parieto-occipital ROI for left, right, and midline labeled.
Statistical analysis
Statistical analyses were performed on the subject-averaged behavioral and ERP data with the subject averages being the observations. The primary analysis model was the repeated measures ANOVA, with dependent variables being reaction time (RT), accuracy, error rate, and all the specific ERP components’ amplitudes and latencies at selected ROIs. The data of each ERP dependent variable for each relevant ROI was analyzed using ANOVA with the following factors (all within-participants): Stimulus (Target, Standard, non-target Kanizsa), Hemisphere (Left, Right), etc. The between subject factor was Group (ASD, CNT). Post-hoc analysis was conducted where appropriate. A-priori hypotheses were tested with Student’s t-tests for 2 groups with unequal variance. In all ANOVAs, Greenhouse-Geisser corrected p-values were employed where appropriate. SPSS v.14 and Sigma Stat 3.1 packages were used for statistical analysis.
Results
The mean age of 15 participants enrolled in the ASD group was 13.9 ± (standard deviation) 3.45 years (range 9–20 years, 13 males, 2 females), while the mean age of the Control (CNT) group (N= 15) was 15.5 ± 4.21 years (9–22 years, 11 males, 4 females). The age difference between groups was not significant (two-tailed t-test, t=1.01, p= 0.33, n.s.). The mean full-scale IQ score for patients with ASD was 92.5 ± 15.1, and this was not significantly different from the group IQ of controls. The full-scale IQ scores were based on either the Wechsler Intelligence Scale for Children, Fourth Edition [58] or the Wechsler Abbreviated Scale of Intelligence [59].
Behavioral responses
Reaction time to targets was not significantly different in the ASD group compared to the typical control group (549 ± 86 ms in ASD vs. 502 ± 69 ms in CNT, F1,29 =2.77, p=0.10, n.s.), but a difference in total error rate was significantly higher (14.8 ± 17.7 percent vs. 1.4 ± 2.6 percent, F1,29 =8.43, p=0.007). The percentage of both commission (9.4 ± 14.3 percent vs. 0.5 ± 0.6 percent, F1,29 =5.83, p=0.023) and omission errors (5.4 ± 7.2 percent vs. 0.8 ± 2.2 percent, F1,29 = 5.28, p=0.029) was significantly higher in the ASD group.
Parieto-occipital ERPs
P50. Amplitude of the parieto-occipital P50 in the ASD group was bilaterally more positive to non-target Kanizsa stimuli as compared to the control group (2.25 ± 2.15 µV vs. 0.94 ± 1.03 µV, F1,29 =4.49, p=0.043) (Figures 3 & 4). A Stimulus (target Kanizsa, non-target Kanizsa, non-Kanizsa standard) X Group (ASD, CNT) interaction reached significance (F2,58 =3.43, p=0.048) over the left hemisphere and can be described as more positive P50 amplitude to both target and non-target Kanizsa figures but not to standard stimuli in the ASD group. Latency of P50 at the right ROI to non-target Kanizsa figures was some 14 ms shorter in the ASD group compared to the control group (F1,29 =4.87, p=0.035).
Figure 3.
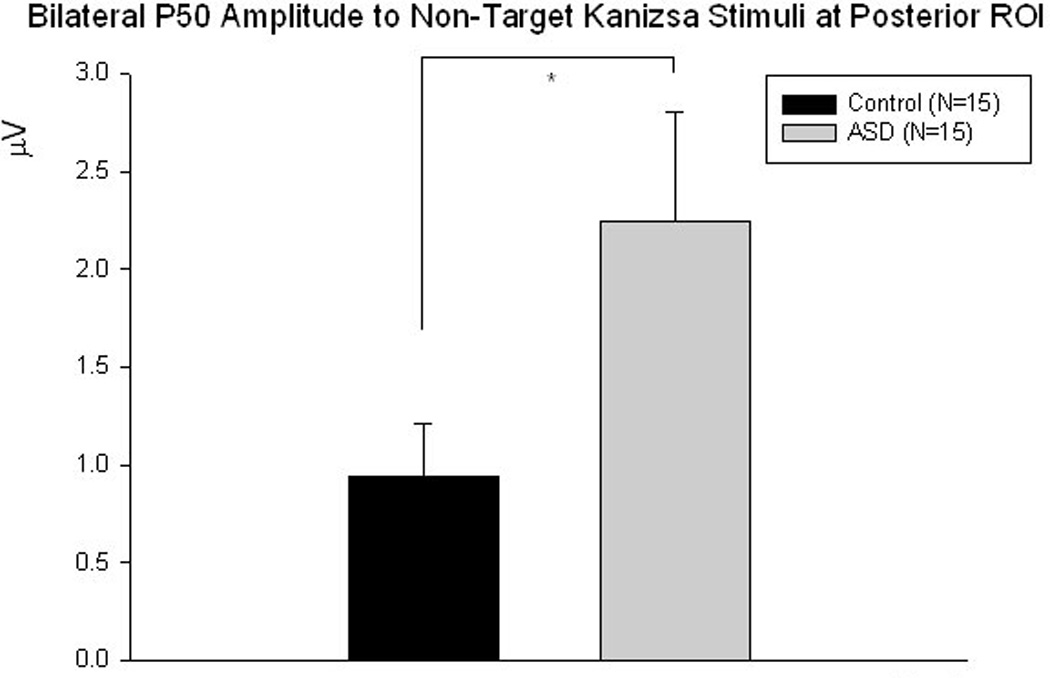
Parieto-occipital P50 amplitude is significantly more positive to non-target Kanizsa stimuli bilaterally in the ASD group compared to controls (F1,29 =4.49, p=0.043).
Figure 4.
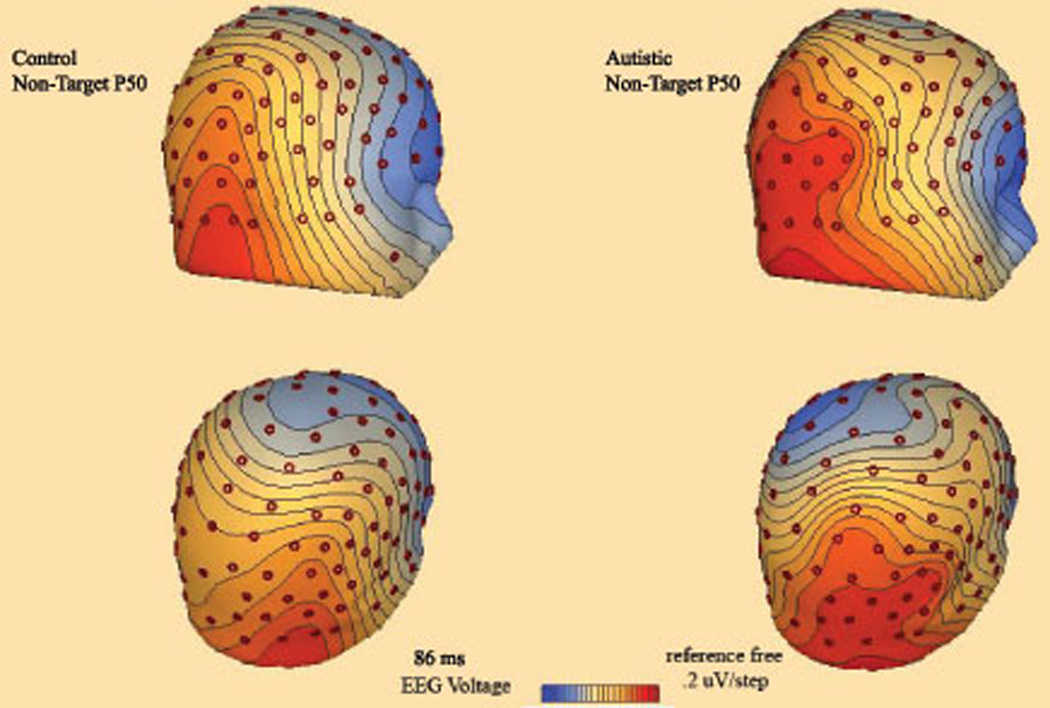
3D topographic map of scalp potentials (P50, ~90 ms post-stimulus) in response to non-target Kanizsa stimuli in autism and control groups. The autism group shows more pronounced posterior positivity.
N100. Latency of the N100 component in the ASD group as compared to the control group was prolonged to targets across all parieto-occipital ROI (131.9 ± 4.13 vs. 121.3 ± 4.13 ms, F1,29=5.10, p=0.032), and was also significant at the right ROI (F1,29=4.30, p=0.048). Repeated measures analysis revealed a Stimulus X Group interaction (F2,58=3.43, p=0.04) across both hemispheres; this effect (Figure 5) was expressed as a significantly longer latency to target stimuli in the ASD group with a relatively longer latency to non-target stimuli without any between group differences to standard stimuli.
Figure 5.
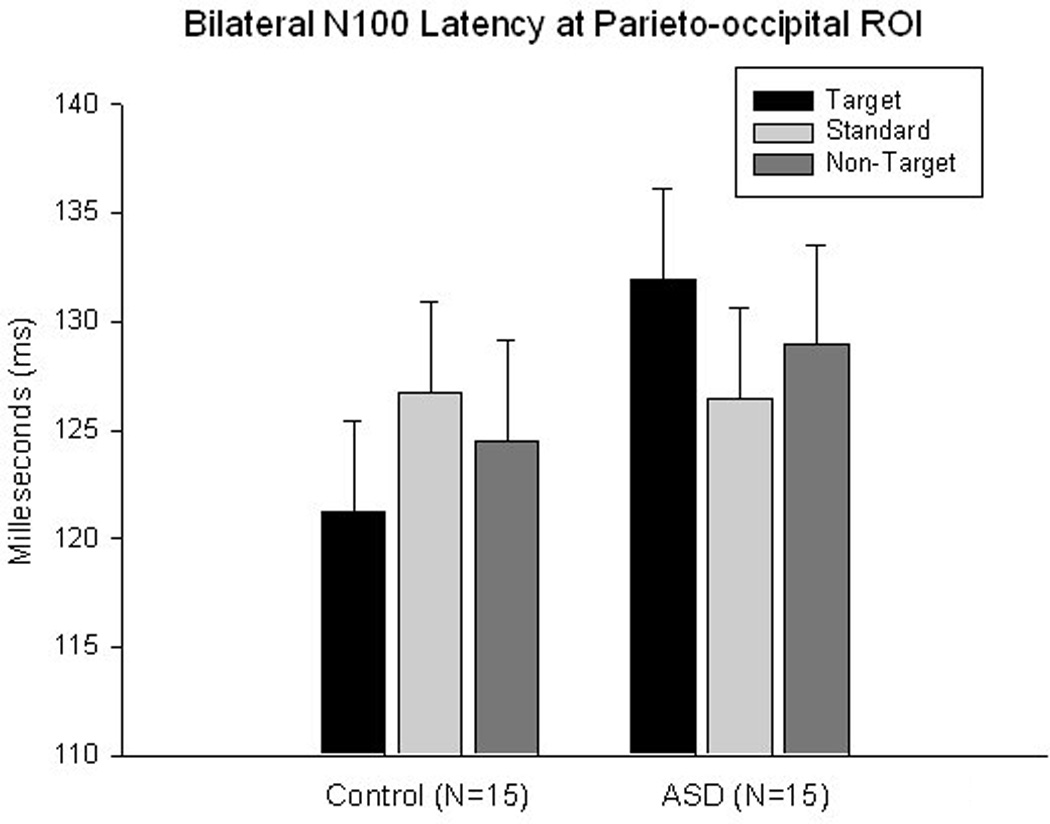
Latency of the parieto-occipital N100 ERP component to target Kanizsa, non-target Kanizsa, and non-Kanizsa standards in autism and control groups. A Stimulus (target, non-target, standard) X Group interaction is significant (F2,58=3.43, p=0.04) across both hemisphres.
P200. Amplitude of the parieto-occipital P200 in the ASD group was more positive to target stimuli and yielded a Stimulus (target, standard) X Group interaction at the left hemisphere (F1,29=7.48, p=0.011). Comparison of P200 latency between target and non-target Kanizsa stimuli revealed a Stimulus X Group interaction (F1,29=5.32, p=0.029) with prolonged latency to non-targets in the ASD group.
Frontal ERPs
P50. Amplitude of the midline frontal P50 in the ASD group compared to the control group was significantly more positive to non-target Kanizsa figures (1.03 ± 1.23 µV vs. 0.13 ± 0.61 µV, F 1,29= 6.24, p=0.019) (Figures 6 & 7). Amplitude of the left frontal P50 in the ASD group was also more positive to standards (0.63 ± 0.97 µV vs. 0.06 ± 0.17 µV, F1,29=5.11, p=0.032). Latency of the midline frontal P50 to targets was marginally prolonged in the ASD group compared to the control group (63.2 ± 16.5 ms vs. 52.5 ± 11.90 ms, F1,29=4.14, p=0.05). This effect for P50 latency was significant at the left hemisphere (62.3 ± 7.8 ms vs. 48.1 ± 10.5 ms, F1,29=7.05, p=0.013).
Figure 6.
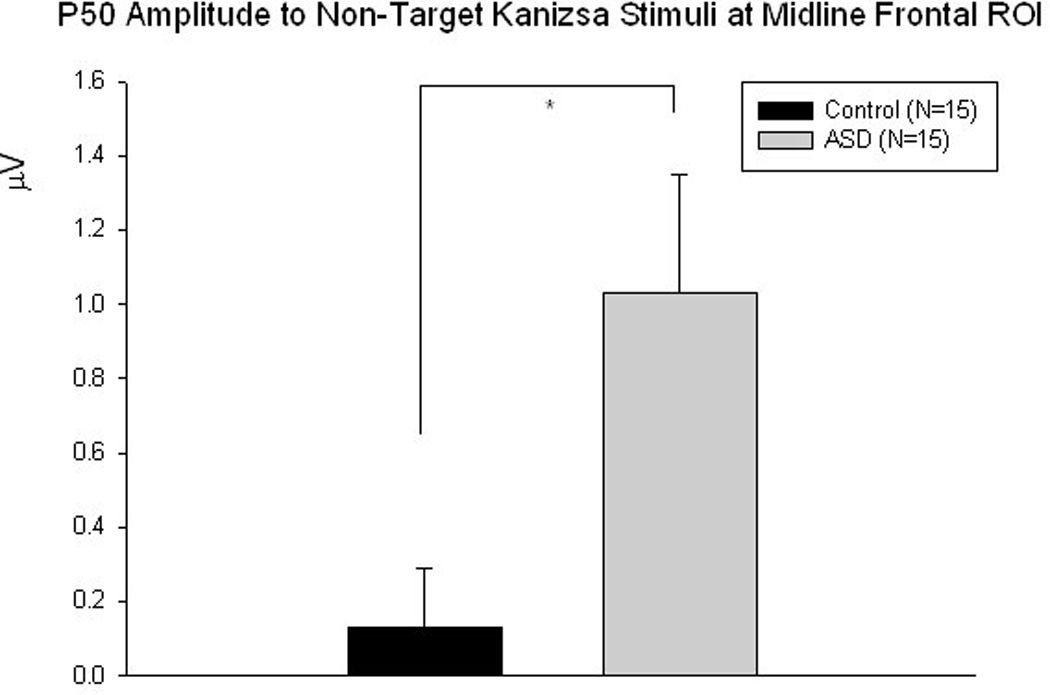
Midline frontal P50 amplitude is significantly more positive to non-target Kanizsa stimuli in the ASD group compared to controls (F1,29 =6.24, p=0.019)
Figure 7.
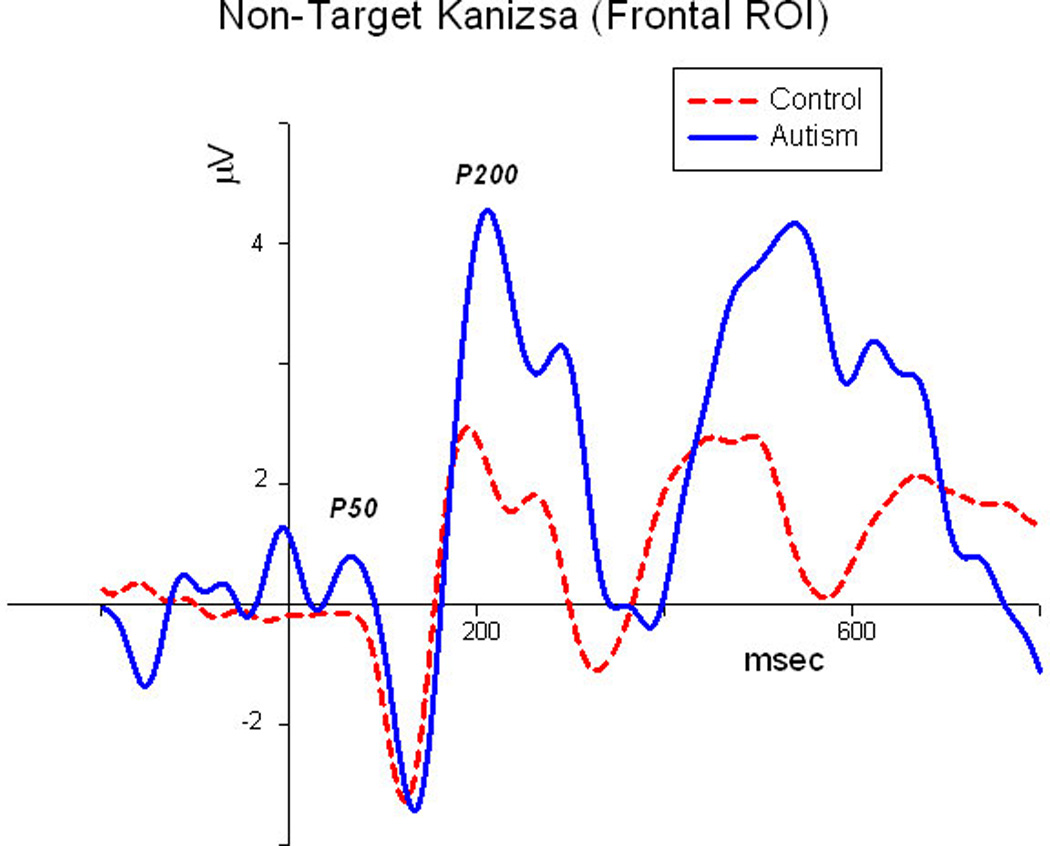
Midline frontal ERP waveforms to non-target Kanizsa illusory figures in autism and control groups (grandaverage, N=15/group).
N100. Amplitude of the frontal N100 to targets at midline was more negative in the ASD group compared to the control group (−3.15 ± 2.79 µV vs. −0.96 ± 0.76 µV, F1,29 =8.63, p=0.007) (Figure 8). At the midline ROI a Stimulus (target Kanizsa, standard non-Kanizsa, non-target Kanizsa) X Group (ASD, CNT) interaction was significant (F2,56=7.52, p=0.003) with the ASD group exhibiting comparable amplitudes to each non-target category of stimuli, whereas the control group had a more negative amplitude to targets. Latency of the frontal N100 over both hemispheres showed a Stimulus (target Kanizsa, non-Kanizsa standard) X Group interaction (F1,29 =5.80, p=0.023) with reduced latency to standards in the ASD group. The same effect was significant at the right frontal ROI (F1,29 =5.65, p=0.024).
Figure 8.
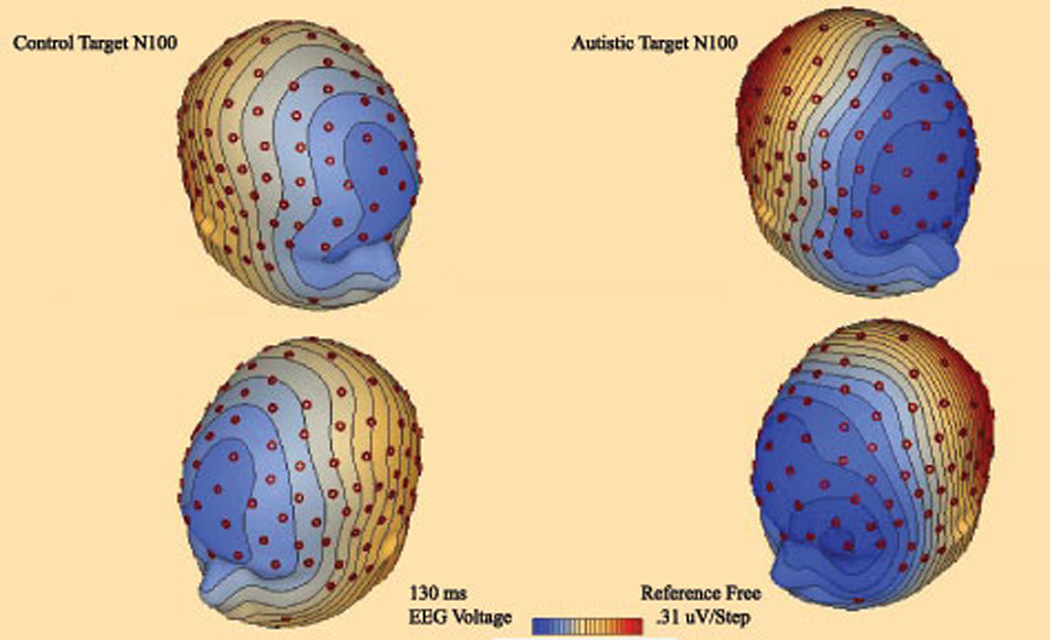
3D topographic map of scalp potentials (N100, 130 ms post-stimulus) in response to target stimuli in autism and control groups. The autism group shows more pronounced anterior frontal negativity.
P200. Amplitude of the frontal P200 to non-targets was more positive in the ASD group compared to the control group at midline (3.95 ± 2.52 µV vs. 2.15 ± 2.09 µV, F1,29 =4.54, p=0.04). Amplitude of the left frontal P200 was significantly more positive in the ASD group compared to the control group (targets, 3.23 ± 1.81 vs. 1.47 ± 1.80 µV F1,29 = 7.09, p=0.013; non-target Kanizsa, 3.24 ± 2.97 vs. 1.43 ± 1.30 µV F1,29 = 4.65, p=0.04; standards, 3.03 ± 2.22 vs. 1.20 ± 1.65 µV F1,21 =6.53, p=0.016). It should be noted that amplitude of the frontal P200 in the ASD group was indiscriminative and comparably high in all three conditions (Figure 9).
Figure 9.
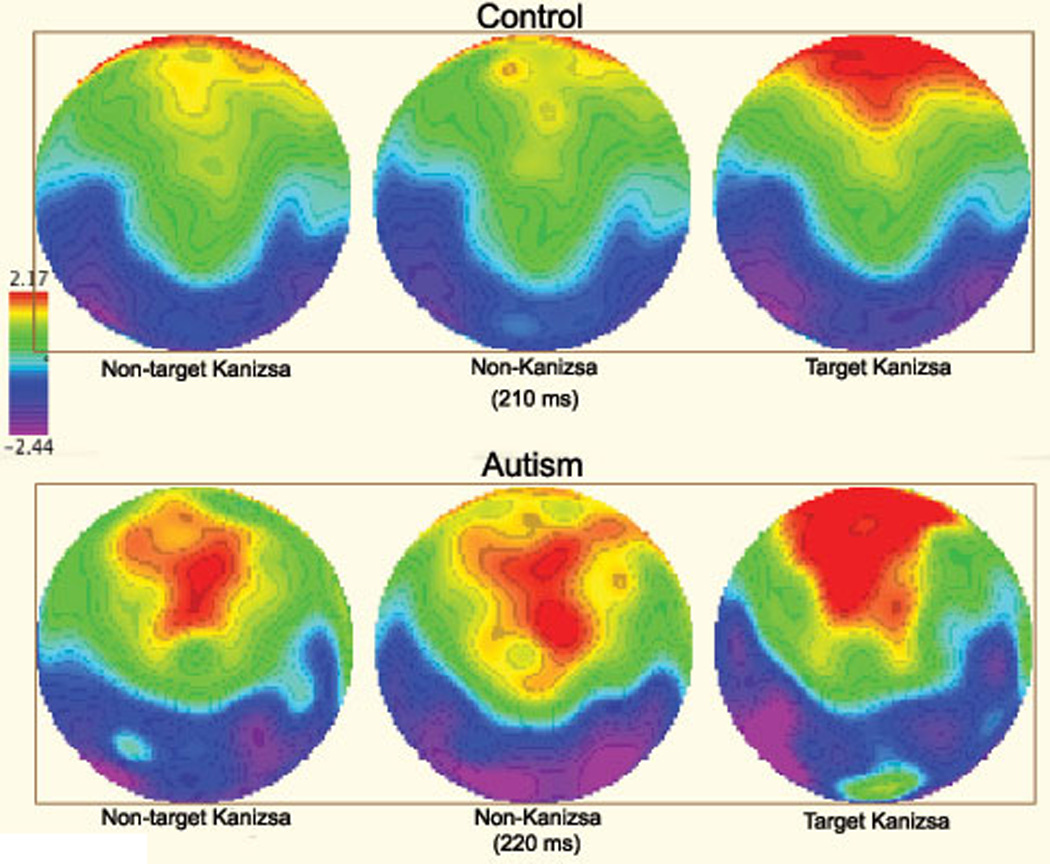
2D topographic map of responses to non-target Kanizsa, non-Kanizsa standards, and target Kanizsa stimuli in autism and control groups (210–220 ms post-stimulus). The control group shows frontal positivity (P200) only to targets, whereas the autism group has frontal postivity expressed as well to non-target stimuli (both non-target Kanizsa and non-Kanizsa standards).
Discussion
Over parieto-occipital ROI we found P50 amplitudes to be significantly more positive to non-target Kanizsa stimuli in the ASD group compared to the control group. P50 latency over parieto-occipital ROI was also significantly reduced in the ASD group to non-target Kanizsa figures at the right ROI compared to the control group. The early P50 potential in visual tasks is associated with the sensory processing of attended stimuli and is generally larger to attended stimuli [48]. These results may point to sensory over reactivity in individuals with ASD in early stages of visual processing especially to task irrelevant stimuli. Our earlier study [40] found similar results in a traditional visual three-stimuli oddball task over frontal electrode sites: ASD patients had significantly increased amplitudes of this early positivity to irrelevant distracter stimuli compared to controls. As altered inhibitory control of sensory intake [4], sensory overload [5], and hypersensitivity [2] have all been associated with ASD, these results at early stages of visual processing are not surprising.
Also over parieto-occipital ROI the latency of N100 was significantly prolonged to target stimuli in the ASD group relative to the control group. These results are similar to our earlier study [40] where we found a prolonged N100 latency to targets in ASD patients compared to controls over centroparietal ROI. Delayed negativity in this range has been associated with prolonged memory comparison processes during stimulus discrimination [67]. It is plausible that sensory hyperreactivity at early stages of visual processing (i.e., P50) may be delaying stimulus discrimination processes at the stage of the N100. Comparison of P200 latencies between target and non-target Kanizsa stimuli over parieto-occipital ROI revealed a Stimulus X Group interaction with prolonged latencies to non-targets relative to target stimuli in the ASD group. Since the P200 has been associated with visual categorization processes, these results may point to compromised attentive orientating in ASD patients due to excessive sensitivity in early visual processing stages.
Over frontal ROI P50 amplitudes were significantly more positive to non-target Kanizsa and non-Kanizsa stimuli in individuals with ASD, while P50 latency was prolonged to target stimuli. These results are similar to our findings over parieto-occipital ROI as well as our previous study [40] where ASD patients had excessive frontal positivity to distracter stimuli compared to controls. Again since this early positivity is associated with early categorization and recognition processes and is generally higher to attended stimuli, these results suggest ASD patients are abnormally orientating to task irrelevant stimuli. An exaggerated response to sensory inputs may result in a global inundation of higher level integrative centers with task-irrelevant information during early stages of visual processing.
N100 amplitude over frontal ROI was significantly more negative to target stimuli in the ASD group relative to the control group. Also, a Group X Stimulus interaction for N100 latency indicated a significantly reduced latency in the ASD group to non-Kanizsa stimuli compared to target Kanizsa stimuli. These results corroborate with our previous paper [40] where we found an augmented N100 amplitude to target stimuli over frontal ROI as well as a prolonged N100 latency to targets over centroparietal ROI in ASD patients. Amplified and delayed responses to rare, target stimuli in the ASD group may point to visual hypersensitivity and increased general arousal relative to controls, and this may disrupt and delay the processing of target stimuli. Courchesne et al. [32] reported larger N100 amplitudes at the Cz electrode to all stimuli (Target, Novel, Background) in autistic patients compared to controls, but the group differences were not found to be significant. These findings may also point to augmented visual responses in ASD during early stages of processing.
P200 amplitude over frontal ROI was found to be equally more positive to all stimuli in the ASD group with a lack of stimulus discrimination; this is similar to our previous findings [40] where P200 amplitudes over frontal ROI were indiscernible between target and distracter stimuli in the ASD group, where in the control group P200 amplitude was more positive to targets. The P200 over frontal ROI has been associated with the hierarchal selection of task-relevant features [54]. In ASD globally augmented cortical responses, especially to irrelevant stimuli at early stages of visual processing may be complicating stimulus discrimination processes at the stage of the P200. At behavioral stages, responses of ASD patients did not differ from the control group in reaction time although they had a significantly higher rate or error. The significantly higher rate of error in ASD patients may be a manifestation of early-stage visual sensitivity and consequently a disruption in selective attention and executive function. For a summary of mean amplitudes and latencies, as well as significant group differences, at midline parieto-occipital and frontal ROI in ASD and CNT groups refer to tables 1 and 2.
Table 1.
Mean amplitudes with standard deviations at bilateral parieto-occipital and midline frontal ROI in ASD (N=15) and CNT (N=15) groups.
| Amplitude (µV) | ||||||
|---|---|---|---|---|---|---|
| Topography | Target | Non-Target | Standard | |||
| ERF Component | ASD | CNT | ASD | CNT | ASD | CNT |
| Parieto-occipital P50 | 3.79 ± 10.0 | 0.91 ± 1.11 | 2.25 ± 2.15* | 0.94 ± 1.03 | 0.53 ± 1.76 | 1.02 ±.972 |
| Parieto-occipital N100 | 1.44 ± 11.2 | −1.04 ± 1.31 | −0.65 ± 2.60 | −0.55 ± 1.03 | −2.14 ± 4.87 | −0.29 ± 0.43 |
| Parieto-occipital P200 | 6.61 ± 14.3 | 1.42 ± 2.06 | 2.94 ± 4.12 | 1.98 ± 2.49 | 0.69 ± 4.56 | 2.24 ± 2.44 |
| Frontal P50 | 0.92 ± 1.83 | 0.33 ± 0.60 | 1.03 ±1.24* | 0.13 ± 0.61 | 0.78 ± 1.71 | 0.28 ± 0.35 |
| Frontal N100 | −3.15 ± 2.79** | −0.96 ± 0.76 | −l.56 ± 2.08 | −1.44 ± 1.58 | −1.54 ± 2.01 | −1.27 ± 0.91 |
| Frontal P200 | 2.90 ± 2.69 | 2.62 ± 2.19 | 3.95 ± 2.52* | 2.15 ± 2.09 | 3.35 ± 2.27 | 2.15 ± 2.02 |
Indicates a statistically significant difference from control group (p≤0.05)
Indicates a statistically significant difference from control group (p≤0.01)
Table 2.
Mean latencies with standard deviations at bilateral parieto-occipital and midline frontal ROI in ASD (N=15)and CNT (N=15) groups.
| Latency (ms) | ||||||
|---|---|---|---|---|---|---|
| Topography | Target | Non-Target | Standard | |||
| ERP Component | ASD | CNT | ASD | CNT | ASD | CNT |
| Parieto-occipital P50 | 78.7 ± 22.3 | 82.8 ± 23.8 | 81.7 ± 18.2 | 88.5 ± 16.5 | 77.2 ± 19.1 | 88.2 ± 17.6 |
| Parieto-occipital Nl00 | 131.9 ± 4.1* | 121.3 ± 4.1 | 132.5 ± 22.5 | 116.0 ± 36.4 | 126.91 ± 12.3 | 117.9 ± 36.6 |
| Parieto-occipital P200 | 175.8 ± 37.1 | 160.8 ± 38.7 | 181.9 ± 44.8 | 156.5 ± 35.2 | 171.3 ± 36.6 | 161.1 ± 40.7 |
| Frontal P50 | 63.2 ± 16.5* | 52.5 ± 11.9 | 62.7 ± 14.8 | 56.4 ± 13.4 | 61.4 ± 13.9 | 54.9 ± 17.9 |
| Frontal N100 | 133.7 ± 12.9 | 131.0 ± 10.3 | 127.9 ± 28.4 | 132.5 ± 11.2 | 130.3 ± 18.9 | 132.6 ± 11.4 |
| Frontal P200 | 218.1 ± 28.8 | 217.4 ± 32.5 | 215.0 ± 20.8 | 208.3 ± 24.2 | 218.5 ± 26.9 | 204.1 ± 26.9 |
Inidcates a statistically significant difference from control group (p≤0.05)
Our results show that individuals with ASD have abnormally large cortical responses to task irrelevant stimuli over both parieto-occipital and frontal ROI during early stages of visual processing compared to the control group. Also, ASD patients showed signs of an overall disruption in stimulus discrimination compared to the control group as evidenced by ERPs and a significantly higher rate of motor response errors. Sensory hyperreactivity has been well documented in the auditory domain (see [3] for review) but not during visual tasks. Patients with ASD may have sensitivities at early-stages of visual processing as well which may be sequentially affecting their ability to effectively discriminate irrelevant from relevant stimuli in visual processing tasks.
Several neuropathological theories may help explain in part some of the sensory abnormalities and cognitive deficits associated with ASD. In fact, anomalies of cortical inhibitory interneurons [68–71] and an imbalance of cortical excitation and inhibition [72] have been found in patients with ASD. Casanova et al. [68–69] found a significant reduction of peripheral neuropil space in the minicolumns of several cortical areas in individuals with ASD compared to controls: Minicolumns are small cortical processing units extending the cortical width [73] surrounded by a neuropil space consisting of several species of inhibitory interneurons [74]. A reduction of inhibitory tone in cortical areas associated with sensory processing in ASD patients may account in part for ineffective regulation of auditory and visual input. Additionally, interneuronal abnormalities of both the hippocampus and cerebellum have been documented in autism [75, 76] which may also be contributing factors to impairments of attention and memory in ASD. Furthermore, a recent study by our group [77] employed low-frequency repetitive transcranial magnetic stimulation (rTMS) to the dorsolateral prefrontal cortex (DLPFC) as a modulatory tool putatively altering the disrupted ratio of cortical excitation and inhibition in ASD. Our results showed that low-frequency rTMS minimized early cortical responses to irrelevant stimuli and increased responses to relevant stimuli leading to better stimulus discrimination in a visual oddball experiment.
Additional investigations characterizing early-stage visual processing deficits using similar ‘oddball’ paradigms maintain a large amount of significance for future ASD research and treatment. These visual tasks are capable of detecting difficulty in filtering irrelevant sensory stimuli in early stages of visual processing, and could potentially play an important role in identifying sensory endophenotypes characteristic of the disorder. Future research should improve the diagnostic capability of ERPs, and may contribute to earlier diagnosis and intervention in ASD, a disorder where timely intervention is critical.
Acknowledgments
Funding for this work was provided by NIH grants R01 MH86784 (MFC and ES) and R01 MH88893 (MFC).
References
- 1.American Psychiatric Association diagnostic and statistical manual of mental disorders (DSM-IV TR) 4th ed. Washington, D.C.: American Psychiatric Association; 2000. [Google Scholar]
- 2.Charman T. Autism spectrum disorders. Psychiatry. 2008;7:331–334. [Google Scholar]
- 3.Gomes E, Pedroso FS, Wagner MB. Auditory hypersensitivity in the autistic spectrum disorder. Pro Fono. 2008;20:279–284. doi: 10.1590/s0104-56872008000400013. [DOI] [PubMed] [Google Scholar]
- 4.Khalfa S, Bruneau N, Rogé B, Georgieff N, Veuillet E, Adrien JL, et al. Increased perception of loudness in autism. Hear. Res. 2004;198:87–92. doi: 10.1016/j.heares.2004.07.006. [DOI] [PubMed] [Google Scholar]
- 5.Ratey JJ, Johnson C. The shadow syndromes. New York: Bantam Books; 1997. [Google Scholar]
- 6.Jeste SS, Nelson CA., 3rd Event related potentials in the understanding of autism spectrum disorders: an analytical review. J Autism Dev Disord. 2009;39:495–510. doi: 10.1007/s10803-008-0652-9. [DOI] [PMC free article] [PubMed] [Google Scholar]
- 7.Luck SJ, Heinze HJ, Mangun GR, Hillyard SA. Visual event-related potentials index focused attention within bilateral stimulus arrays. II. Functional dissociation of P1 and N1 components. Electroencephalogr Clin Neurophysiol. 1990;75:528–542. doi: 10.1016/0013-4694(90)90139-b. [DOI] [PubMed] [Google Scholar]
- 8.O’Donnel BF, Swearer JM, Smith LT, Hokama H, Mccarley RW. A topographic study of ERPs elicited by visual feature discrimination. Brain Topogr. 997:133–143. doi: 10.1023/a:1022203811678. 10. [DOI] [PubMed] [Google Scholar]
- 9.Coles MGH, Rugg MD. Event-related brain potentials: an introduction. In: Rugg MD, Coles MGH, editors. Electrophysiology of mind. Event-related brain potentials and cognition. Oxford: Oxford University Press; 1995. [Google Scholar]
- 10.Herrmann CS, Knight RT. Mechanisms of human attention: event related potentials and oscillations. Neurosci Biobehav Rev. 2001;25:465–476. doi: 10.1016/s0149-7634(01)00027-6. [DOI] [PubMed] [Google Scholar]
- 11.Pritchard WS. Psychophysiology of P300. Psychol Bull. 1981;89:506–540. [PubMed] [Google Scholar]
- 12.Picton TW. The P300 wave of the human event-related potential. J Clin Neurophysiol. 1992;9:456–479. doi: 10.1097/00004691-199210000-00002. [DOI] [PubMed] [Google Scholar]
- 13.Polich J. Theoretical overview of P3a and P3b. In: Polich J, editor. Detection of Change: Event-related Potential and fMRI Findings. Boston: Kluwer Academic Press; 2003. [Google Scholar]
- 14.Bomba MD, Pang EW. Cortical auditory evoked potentials in autism: a review. Int J Psychophysiol. 2004;53:161–169. doi: 10.1016/j.ijpsycho.2004.04.001. [DOI] [PubMed] [Google Scholar]
- 15.Klin A. Auditory brainstem responses in autism. Brainstem dysfunction of peripheral hearing loss? J Autism Dev Disord. 1993;23:15–34. doi: 10.1007/BF01066416. [DOI] [PubMed] [Google Scholar]
- 16.Rosenhall U, Nordin V, Brantberg K, Gillberg C. Autism and auditory brain stem responses. Ear Hear. 2003;24:206–214. doi: 10.1097/01.AUD.0000069326.11466.7E. [DOI] [PubMed] [Google Scholar]
- 17.Bruneau N, Garreau B, Roux S, Lelord G. Modulation of auditory evoked potentials with increasing stimulus intensity in autistic children. Electroencephalogr Clin Neurophysiol Suppl. 1987;40:584–589. [PubMed] [Google Scholar]
- 18.Lincoln AJ, Courchesne E, Harms L, Allen M. Sensory modulation of auditory stimuli in children with autism and receptive developmental language disorder: event-related brain potential evidence. J Autism Dev Disord. 1995;25:521–539. doi: 10.1007/BF02178298. [DOI] [PubMed] [Google Scholar]
- 19.Bruneau N, Roux S, Adrien J, Barthelemy C. Auditory associative cortex dysfunction in children with autism: Evidence from late auditory evoked potentials (N1 wave-T complex) Clin Neurophysiol. 1999;110:1927–1934. doi: 10.1016/s1388-2457(99)00149-2. [DOI] [PubMed] [Google Scholar]
- 20.Oades RD, Walker MK, Geffen LB, Stern LM. Event-related potentials in autistic and healthy children on an auditory choice reaction time task. Int J Psychophysiol. 1988;6:25–37. doi: 10.1016/0167-8760(88)90032-3. [DOI] [PubMed] [Google Scholar]
- 21.Ferri R, Elia M, Agarwal N, Lanuzza B, Musumeci SA, Pennisi G. The mismatch negativity and the P3a components of the auditory event-related potentials in autistic lowfunctioning subjects. Clin Neurophysiol. 2003;114:1671–1680. doi: 10.1016/s1388-2457(03)00153-6. [DOI] [PubMed] [Google Scholar]
- 22.Seri S, Cerquiglini A, Pisani F, Curatolo P. Autism in tuberous sclerosis: Evoked potential evidence for a deficit in auditory sensory processing. Clin Neurophysiol. 1999;110:1825–1830. doi: 10.1016/s1388-2457(99)00137-6. [DOI] [PubMed] [Google Scholar]
- 23.Jansson-Verkasalo E, Ceponiene R, Valkama M, Vainionpää L, Laitakari K, Alku P, Suominen K, Näätänen R. Deficient speech-sound processing, as shown by the electrophysiologic brain mismatch negativity response, and naming ability in prematurely born children. Neurosci. Lett. 2003;348:5–8. doi: 10.1016/s0304-3940(03)00641-4. [DOI] [PubMed] [Google Scholar]
- 24.Lepistö T, Kujala T, Vanhala R, Alku P, Huotilainen M, Näätänen R. The discrimination of and orienting to speech and non-speech sounds in children with autism. Brain Res. 2005;1066:147–157. doi: 10.1016/j.brainres.2005.10.052. [DOI] [PubMed] [Google Scholar]
- 25.Doninger GM, Foxe JJ, Murray MM, Higgins BA, Snodgrass JG, Schroeder CE, et al. Activation timecourse of ventral visual stream object-recognition areas: High density electrical mapping of perceptual closure processes. J Cogn Neurosci. 2000;12:615–621. doi: 10.1162/089892900562372. [DOI] [PubMed] [Google Scholar]
- 26.Foxe JJ, Doninger GM, Javitt DC. Early visual processing deficits in schizophrenia: Impaired P1 generation revealed by high density electrical mapping. Neuroreport. 2001;12:3815–3820. doi: 10.1097/00001756-200112040-00043. [DOI] [PubMed] [Google Scholar]
- 27.Spencer KM, Dien J, Donchin E. Spatiotemporal analysis of the late ERP responses to deviant stimuli. Psychophysiology. 2001;38:343–358. [PubMed] [Google Scholar]
- 28.Butler PD, Javitt DC. Early-stage visual processing deficits in schizophrenia. Curr Opin Psychiatry. 2005;18:151–157. doi: 10.1097/00001504-200503000-00008. [DOI] [PMC free article] [PubMed] [Google Scholar]
- 29.Tendolkar I, Ruhrmann S, Brockhaus-Dumke A, Pauli M, Mueller R, Pukrop R, et al. Neural correlates of visuo-spatial attention during an antisaccade task in schizophrenia: an ERP study. Int. J. Neurosci. 2005;115:681–698. doi: 10.1080/00207450590887475. [DOI] [PubMed] [Google Scholar]
- 30.Vohs JL, Hetrick WP, Kieffaber PD, Bodkins M, Bismark A, Shekhar A, et al. Visual event-related potentials in schizotypal personality disorder and schizophrenia. J Abnorm Psychol. 2008;117:119–131. doi: 10.1037/0021-843X.117.1.119. [DOI] [PubMed] [Google Scholar]
- 31.Courchesne E, Courchesne RY, Hicks G, Lincoln AJ. Functioning of the brain-stem auditory pathway in nonretarded autistic individuals. Electroencephalogr Clin Neurophysiol. 1985a;61:491–501. doi: 10.1016/0013-4694(85)90967-8. [DOI] [PubMed] [Google Scholar]
- 32.Courchesne E, Lincoln AJ, Kilman BA, Galambos R. Event-related brain potential correlates of the processing of novel visual and auditory information in autism. J Autism Dev Disord. 1985b;15:55–76. doi: 10.1007/BF01837899. [DOI] [PubMed] [Google Scholar]
- 33.Courchesne E, Lincoln AJ, Yeung-Courchesne R, Elmasian R, Grillon C. Pathophysiologic findings in nonretarded autism and receptive developmental language disorder. J Autism Dev Disord. 1989;19:1–17. doi: 10.1007/BF02212714. [DOI] [PubMed] [Google Scholar]
- 34.Verbaten MN, Roelofs JW, van Engeland H, Kenemans JK, Slangen JL. Abnormal visual event-related potentials of autistic children. J Autism Dev Disord. 1991;21:449–470. doi: 10.1007/BF02206870. [DOI] [PubMed] [Google Scholar]
- 35.Kemner C, Verbaten MN, Cuperus JM, Camfferman G, Van Engeland H. Visual and somatosensory event-related brain potentials in autistic children and three different control groups. Electroencephalogr Clin Neurophysiol. 1994;92:225–237. doi: 10.1016/0168-5597(94)90066-3. [DOI] [PubMed] [Google Scholar]
- 36.Kemner C, van der Gaag RJ, Verbaten M, van Engeland H. ERP differences among subtypes of pervasive developmental disorders. Biol. Psychiatry. 1999;46:781–789. doi: 10.1016/s0006-3223(99)00003-7. [DOI] [PubMed] [Google Scholar]
- 37.Townsend J, Westerfield M, Leaver E, Makeig S, Jung T, Pierce K, et al. Event-related brain response abnormalities in autism: Evidence for impaired cerebello-frontal spatial attention networks. Brain Res Cogn Brain Res. 2001;11:127–145. doi: 10.1016/s0926-6410(00)00072-0. [DOI] [PubMed] [Google Scholar]
- 38.Hoeksma MR, Kemner C, Kenemans JL, van Engeland H. Abnormal selective attention normalizes P3 amplitudes in PDD. J Autism Dev Disord. 2006;36:643–654. doi: 10.1007/s10803-006-0102-5. [DOI] [PubMed] [Google Scholar]
- 39.Sokhadze E, El-Baz A, Baruth J, Mathai G, Sears L, Casanova M. Effects of low frequency repetitive transcranial magnetic stimulation (rTMS) on gamma frequency oscillations and event-related potentials during processing of illusory figures in autism. J Autism Dev Disord. 2009b;39:619–634. doi: 10.1007/s10803-008-0662-7. [DOI] [PubMed] [Google Scholar]
- 40.Sokhadze E, Baruth J, Tasman A, Sears L, Mathai G, El-Baz A, et al. Event-related potential study of novelty processing abnormalities in autism. Appl Psychophysiol Biofeedback. 2009a;34:37–51. doi: 10.1007/s10484-009-9074-5. [DOI] [PubMed] [Google Scholar]
- 41.Haxby JV, Hoffman EA, Gobbini MI. Human neural systems for face recognition and social communication. Biol. Psychiatry. 2002;51:59–67. doi: 10.1016/s0006-3223(01)01330-0. [DOI] [PubMed] [Google Scholar]
- 42.Posner MI, Petersen SE. The attention system of the human brain. Annu. Rev. Neurosci. 1990;13:25–42. doi: 10.1146/annurev.ne.13.030190.000325. [DOI] [PubMed] [Google Scholar]
- 43.Clark VP, Fan S, Hillyard SA. Identification of early visual evoked potential generators by retinotopic and topographic analyses. Hum Brain Mapp. 1995;2:170–187. [Google Scholar]
- 44.Mangun GR. Neural mechanisms of visual selective attention. Psychophysiology. 1995;32:4–18. doi: 10.1111/j.1469-8986.1995.tb03400.x. [DOI] [PubMed] [Google Scholar]
- 45.Seeck M, Michel CM, Mainwaring N, Cosgrove R, Blume H, Ives J, et al. Evidence for rapid face recognition from human scalp and intracranial electrodes. Neuroreport. 1997;8:2749–2754. doi: 10.1097/00001756-199708180-00021. [DOI] [PubMed] [Google Scholar]
- 46.Herrmann MJ, Ehlis AC, Ellgring H, Fallgatter AJ. Early stages (P100) of face perception in humans as measured with event-related potentials (ERPs) J. Neural Transm. 2005;112:1073–1081. doi: 10.1007/s00702-004-0250-8. [DOI] [PubMed] [Google Scholar]
- 47.Heinze HJ, Mangun G, Burchert W, Hinrichs H, Scholz M, Münte TF, et al. Combined spatial and temporal imaging of brain activity during visual selective attention in humans. Nature. 1994;372:543–546. doi: 10.1038/372543a0. [DOI] [PubMed] [Google Scholar]
- 48.Hillyard SA, Mangun GR, Woldorff MG, Luck SJ. Neural mechanisms mediating selective attention. In: Gazzaniga MS, editor. The cognitive neurosciences. Cambridge, MA: MIT Press; 1995. [Google Scholar]
- 49.Hopf JM, Vogel E, Woodman G, Heinze HJ, Luck SJ. Localizing visual discrimination processes in time and space. J. Neurophysiol. 2002;88:2088–2095. doi: 10.1152/jn.2002.88.4.2088. [DOI] [PubMed] [Google Scholar]
- 50.Vogel EK, Luck SJ. The visual N1 component as an index of a discrimination process. Psychophysiology. 2000;37:190–203. [PubMed] [Google Scholar]
- 51.Gomez-Gonzales CM, Clark VP, Fan S, Luck S, Hillyard SA. Sources of attention-sensitive visual event-related potentials. Brain Topogr. 1994;7:41–51. doi: 10.1007/BF01184836. [DOI] [PubMed] [Google Scholar]
- 52.Yamazaki T, Kamijo K, Kenmochi A, Fukuzumi S, Kiyuna T, Kuroiwa Y. Multiple equivalent current dipole source localization of visual event-related potentials during oddball paradigm with motor response. Brain Topogr. 2000;12:159–175. doi: 10.1023/a:1023467806268. [DOI] [PubMed] [Google Scholar]
- 53.Hillyard SA, Hink RF, Schwent VL, Picton TW. Electrical signs of selective attention in the human brain. Science. 1973;182:177–180. doi: 10.1126/science.182.4108.177. [DOI] [PubMed] [Google Scholar]
- 54.Kenemans JL, Kok A, Smulders FT. Event-related potentials to conjunctions of spatial frequency and orientation as a function of stimulus parameters and response requirements. Electroencephalogr Clin Neurophysiol. 1993;88:51–63. doi: 10.1016/0168-5597(93)90028-n. [DOI] [PubMed] [Google Scholar]
- 55.Potts GF, Liotti M, Tucker DM, Posner MI. Frontal and inferior temporal cortical activity in visual target detection: Evidence from high spatially sampled event-related potentials. Brain Topogr. 1996;9:3–14. [Google Scholar]
- 56.Potts GF, Dien J, Harty-Speiser A, McDougl LM, Tucker DM. Dense sensor array topography of the event related potential to task-relevant auditory stimuli. Electroencephalogr Clin Neurophysiol. 1998;106:444–456. doi: 10.1016/s0013-4694(97)00160-0. [DOI] [PubMed] [Google Scholar]
- 57.Le Couteur A, Lord C, Rutter M. The autism diagnostic interview—Revised (ADI-R) Los Angeles, CA: Western Psychological Services; 2003. [Google Scholar]
- 58.Wechsler D. Wechsler intelligence scale for children (4th ed.) San Antonio, TX: Harcourt Assessment, Inc.; 2003. [Google Scholar]
- 59.Wechsler D. Wechsler abbreviated scale for intelligence. San Antonio, TX: Harcourt Assessment, Inc.; 2004. [Google Scholar]
- 60.First MB, Spitzer RL, Gibbon M, Williams JBW. Structured clinical interview for DSM-IV-TR axis I disorders—non-patient edition (SCID-NP) New York: New York State Psychiatric Institute; 2001. [Google Scholar]
- 61.Ferree TC, Luu P, Russell GS, Tucker DM. Scalp electrode impedance, infection risk, and EEG data quality. Clin Neurophysiol. 2001;112:444–536. doi: 10.1016/s1388-2457(00)00533-2. [DOI] [PubMed] [Google Scholar]
- 62.Perrin E, Pernier J, Bertrand O, Giard M, Echallier JF. Mapping of scalp potentials by surface spline interpolation. Electroencephalogr Clin Neurophysiol. 1987;66:75–81. doi: 10.1016/0013-4694(87)90141-6. [DOI] [PubMed] [Google Scholar]
- 63.Fletcher EM, Kussmaul CL, Mangun GR. Estimation of interpolation errors in scalp topographic mapping. Electroencephalogr Clin Neurophysiol. 1996;98:422–434. doi: 10.1016/0013-4694(96)95135-4. [DOI] [PubMed] [Google Scholar]
- 64.Srinivasan R, Tucker DM, Murias M. Estimating the spatial Nyquist of the human EEG. Behav Res Methods Instrum Comput. 1998;30:8–19. [Google Scholar]
- 65.Luu P, Tucker DML, Englander R, Lockfeld A, Lutsep H, Oken B. Localizing acute stroke-related EEC changes: Assessing the effects of spatial undersampling. J Clin Neurophysiol. 2001;18:302–317. doi: 10.1097/00004691-200107000-00002. [DOI] [PubMed] [Google Scholar]
- 66.American Encephalographic Society, Guidelines for standard electrode position nomenclature. J Clin Neurophysiol. 1991;8:200–202. [PubMed] [Google Scholar]
- 67.Kimura M, Katayama J, Ohira H, Schröger E. Visual mismatch negativity: new evidence from the equiprobable paradigm. Psychophysiology. 2009;46:402–409. doi: 10.1111/j.1469-8986.2008.00767.x. [DOI] [PubMed] [Google Scholar]
- 68.Casanova MF, Buxhoeveden DP, Brown C. Clinical and macroscopic correlates of minicolumnar pathology in autism. J. Child Neurol. 2002a;17:692–695. doi: 10.1177/088307380201700908. [DOI] [PubMed] [Google Scholar]
- 69.Casanova MF, Buxhoeveden DP, Switala AE, Roy E. Minicolumnar pathology in autism. Neurology. 2002b;58:428–432. doi: 10.1212/wnl.58.3.428. [DOI] [PubMed] [Google Scholar]
- 70.Levitt P. Disruption of interneuron development. Epilepsia. 2005;46:22–28. doi: 10.1111/j.1528-1167.2005.00305.x. [DOI] [PubMed] [Google Scholar]
- 71.Casanova MF. Neuropathological and genetic findings in autism: The significance of a putative minicolumnopathy. Neuroscientist. 2006;12:435–441. doi: 10.1177/1073858406290375. [DOI] [PubMed] [Google Scholar]
- 72.Rubenstein JLR, Merzenich MM. Model of autism: increased ratio of excitation/inhibition in key neural systems. Genes Brain Behav. 2003;2:255–267. doi: 10.1034/j.1601-183x.2003.00037.x. [DOI] [PMC free article] [PubMed] [Google Scholar]
- 73.Mountcastle VB. Introduction. Computation in cortical columns, Cereb. Cortex. 2003;13:2–4. doi: 10.1093/cercor/13.1.2. [DOI] [PubMed] [Google Scholar]
- 74.Casanova MF. The neuropathology of autism. Brain Pathol. 2007;17:422–433. doi: 10.1111/j.1750-3639.2007.00100.x. [DOI] [PMC free article] [PubMed] [Google Scholar]
- 75.Lawrence YA, Kemper TL, Baumen ML, Blatt GJ. Parvalbumin-, calbindin-, and calretinin-immunoreactive hippocampal interneuron density in autism. Acta Neurol Scand. 2010;121:99–108. doi: 10.1111/j.1600-0404.2009.01234.x. [DOI] [PubMed] [Google Scholar]
- 76.Yip J, Soghomonian JJ, Blatt GJ. Increased GAD67 mRNA expression in cerebellar interneurons in autism: implications for Purkinje cell dysfunction. J Neurosci Res. 2008;86:525–530. doi: 10.1002/jnr.21520. [DOI] [PubMed] [Google Scholar]
- 77.Sokhadze E, Baruth J, Tasman A, Mansoor M, Ramaswamy R, Sears L, et al. Low-Frequency Repetitive Transcranial Magnetic Stimulation (rTMS) Affects Event-Related Potential Measures of Novelty Processing in Autism. Appl Psychophysiol Biofeedback. 2010;35:147–161. doi: 10.1007/s10484-009-9121-2. [DOI] [PMC free article] [PubMed] [Google Scholar]