

Abstract
The olfactory peduncle, the region connecting the olfactory bulb with the basal forebrain, contains several neural areas that have received relatively little attention. The present work includes studies that provide an overview of the region in the mouse. An analysis of cell soma size in pars principalis (pP) of the anterior olfactory nucleus (AON) revealed considerable differences in tissue organization between mice and rats. An unbiased stereological study of neuron number in the cell-dense regions of pars externa (pE) and pP of the AON of 3, 12 and 24 month-old mice indicated that pE has about 16,500 cells in 0.043 mm3and pP about 58,300 cells in 0.307 mm3. Quantitative Golgi studies of pyramidal neurons in pP suggested that mouse neurons are similar though smaller to those of the rat. An immunohistochemical analysis demonstrated that all peduncular regions (pE, pP, the dorsal peduncular cortex, ventral tenia tecta, and anterior olfactory tubercle and piriform cortex) have cells that express either calbindin, calretinin, parvalbumin, somatostatin, vasoactive intestinal polypeptide, neuropeptide Y or cholecystokinin (antigens commonly co-expressed by subspecies of GABAergic neurons), though the relative numbers of each cell type differs between zones. Finally, an electron microscopic comparison of the organization of myelinated fibers in lateral olfactory tract in the anterior and posterior peduncle indicated that the region is less orderly in mice than in the rat. The results provide a caveat for investigators who generalize data between species as both similarities and differences between the laboratory mouse and rat were observed.
Keywords: olfactory cortex, olfactory system organization, olfactory peduncle
The stalk of tissue connecting the olfactory bulb with the ventral forebrain is termed the olfactory peduncle. The region has received very little attention, and only recently have mice been examined. The boundaries of the olfactory peduncle are inexact. It is invaded by the olfactory bulb (OB) on the rostral end, by the piriform cortex (PC) and olfactory tubercle (OT) on the caudal side and by the dorsal peduncular cortex (DPC) from the top (Fig 1). Only two cellular structures are housed primarily within the peduncle: the anterior olfactory nucleus (AON: also known as the anterior olfactory cortex; Neville and Haberly, 2004; Haberly, 2001), and the ventral tenia tecta (VTT). The peduncle develops around the embryonic olfactory ventricle, an anterior extension of the lateral ventricle. With maturity the olfactory ventricle collapses leaving a population of ependymal cells in a reduced subventricluar zone (SVZ; Brunjes and Frazier, 1986). These cells form the substrate for the “rostral migratory stream” through which neuroblasts pass from caudal germinal zones into the OB (Curtis et al., 2009; Whitman and Greer, 2009). Surrounding this dense region of small cells is a loose collection of axons. Some are the anterior extensions of the medial forebrain bundle, bringing a number of modulatory inputs (e.g., noradrenergic, serotonergic) into the peduncle and OB. Others are fibers from the anterior limb of the anterior commissure, which contains axons of cells located in the contralateral olfactory peduncle (Brunjes et al., 2005). The other major set of axons passing through the region is the lateral olfactory tract (LOT). The LOT contains the axons of the projection neurons of the ipsilateral OB, the mitral and tufted cells. In rostral areas of the peduncle, the LOT encircles much of the lateral surface. The tract becomes more compact in the caudal peduncle and travels on the ventrolateral surface towards the piriform and entorhinal cortices.
Fig 1.

Nissl photomicrographs from a set of 36 μm-thick coronal celloidin sections through the mouse olfactory peduncle. Panel A is the caudal-most section through the olfactory bulb that contains only main and accessory olfactory bulb regions, and thus is numbered “0” in the set. The numbers associated with sections B through I represent the position relative to section A. MOB: main olfactory bulb; pP: pars principalis of anterior olfactory nucleus; pE: pars externa of anterior olfactory nucleus; AOB: accessory olfactory bulb; DPC: dorsal peduncular cortex; APC anterior piriform cortex; VTT: ventral tenia tecta; OT: olfactory tubercle. Scale bar under key represents 500 μm.
The olfactory peduncle contains structures important in processing olfactory information. The largest is the AON, which receives direct input from the LOT and is involved in both feedback regulation to the OB and feedforward interactions with the anterior piriform cortex (APC). Furthermore, regions of the AON project via the anterior commissure to the contralateral OB, AON and APC and therefore are important in the interhemispheric regulation of olfactory information (Brunjes et al., 2005, Kikuta et al., 2008, 2010). The AON contains two main subdivisions (Fig 1). The largest, pars principalis (pP), is a two layered cortex that encircles the central core of the peduncle. The deep zone, Layer II, contains pyramidal-shaped neurons as well as a number of other cell types (Brunjes and Kenerson, 2010; Brunjes et al., 2005; McGinley and Westbrook, 2011). An outer plexiform layer contains the apical dendrites of the resident neurons and has been divided into two subdivisions. The superficial zone (Layer 1A) contains axon collaterals of the sensory fibers from the LOT, while the deep zone (1B) contains projections from other regions including the PC (Price, 1973). Haberly and Price (1978) divided pP of the rat into 4 subdivisions (pars medialis [pPm], pars dorsalis [pPd], pars lateralis [pPl], and pars ventroposterior [pPv]) based on both differences in Nissl cytoarchitectonics and projection patterns. The second component of the structure, pars externa (pE) is a thin ring of cells found in anterior Layer I that, in rats, encircles most of pP. It receives topographical projections from the ipsilateral OB and communicates the information to the mirror region on the contralateral side (Yan et al., 2008). Fos studies (Kay et al., 2011) have shown that pE codes odor information in a discrete, topographical map, while pP tends to have more diffuse coding, similar to that of the piriform cortex.
The peduncle contains two other small structures, both relatively unstudied. The VTT is at the rostral end of a small column of cells (the indusium griseum) extending from the hippocampus and over the top of the corpus callosum, through the septal region (where it is often referred to as the anterior hippocampal rudiment, anterior hippocampal extension, or dorsal tenia tecta; DTT) and into the medial aspect of the AON (Adamek et al., 1984; Brunjes et al., 2005; Davis et al., 1978; Davis and Macrides, 1981; Haberly and Price, 1978; McNamara et al., 2004; Shipley and Ennis, 1998, Wyss and Sripanidkulchai, 1983). A small cell free gap, visible in sagittal sections in the rat, divides the VTT from the column (Haberly and Price, 1978). The indusium griseum and dorsal tenia tecta are thought to be an extension of the dentate gyrus. Both receive direct input from the OB, but only the DTT innervates the OB (Shipley and Ennis, 1998). The VTT also receives direct OB projections and has three layers. Layer I is the continuation of the plexiform layer seen around the circumference of the peduncle. Layer II is a narrow, dense region of cells bodies, and Layer III contains a region more similar to that seen in layer II of the pP. The DPC lies in the dorsomedial region of the caudal peduncle at the dorsal margin of the VTT. It too has three layers, similar to those seen in the piriform cortex. Both the VTT and DPC receive projections from the APC. The TT has heavy outputs to pP, and is thus a means of feedback regulation (Haberly and Price, 1978). The connections of the DPC are complicated: it receives inputs from the PPC, has reciprocal projections to layers II and IV of the lateral entorhinal area, layer 4 of the medial entorhinal cortex and the olfactory bulb (Haberly and Price, 1978; McNamara et al., 2004), and also innervates several regions of the diencephalon, including the supramammillary nucleus (Hayakawa et al., 1993) and nucleus submedius of the medial thalamus (Yoshida et al., 1992).
The present paper both presents an overview of the mouse olfactory peduncle and provides novel quantitative examinations of several constituent structures.
Methods
Animals
C57Bl/6J mice (Jackson Labs except where noted) were used. All procedures were performed according to NIH guidelines and protocols approved by the University of Virginia IACUC. Animals were housed in standard polypropylene cages with food (8604, Harlan, Frederick MD) and water ad libitum. The colony was maintained on a 12:12 light:dark cycle in a temperature- and humidity-controlled room (22°C).
Nissl Studies
For a general overview of the peduncle (Fig 1), an adult male mouse was deeply anesthetized with sodium pentobarbital (Euthasol, 0.39 mg drug/gm body weight 150mg/kg) and perfused transcardially with 0.01M phosphate buffered saline (pH 7.4; PBS) followed by 4% buffered formaldehyde freshly depolymerized from paraformaldehyde. The brain was removed, post-fixed for several days, embedded in celloidin, cut at 36 μm and stained with thionen. Sets of sections through the adult rat peduncle prepared with similar methods were available in the lab for comparison.
Mice were obtained from the National Institute of Aging colony for cell counts in the AON (4 subjects at three ages: 3, 12 and 24 months). The tissue was embedded in celloidin, cut at 60μm and stained with thionen. StereoInvestigator (MBF Bioscience, Williston VT) was employed to make unbiased stereological estimates of cell density and number in each subdivision of pP and in pE on one side of each specimen. Initial studies were performed for both regions in which the tissue was extensively analyzed in order to produce very large data sets that could be resampled to find the most efficient sampling ratios. The tops of nuclei were employed as the criteria for cell counts. Sampling parameters for pP and pE were, respectively: counting frame area: 1600 μm2, 1600 μm2, disector height: 50 μm, 30 μm, guard zone: 5 μm, 15 μm, counting frame width and height: 40 μm, 40 μm and sampling grid area: 37500 μm2, 19500 μm2. The average coefficients of errors for pP was 0.054 and pE 0.048 (m=1; Gunderson et al, 1999). Neuronal soma size was measured in a standardized location (pP: the caudal-most region of the AON before the emergence of DPC; pE: the caudal-most region containing both pE and AOB) in each of the 12 subjects. A grid with 50 × 50μm frames was overlaid on the sections. All of the neurons in randomly chosen frames (8 for pP and 2 for pE) were quantified by focusing through the tissue at 100X and tracing the perimeter of the largest part of each cell body. Average cell areas from each region for each subject were calculated and used for comparisons.
Studies of neuronal cell body size were made with 2 μm thick glycol methacrylate coronal sections stained with toluidine blue O via methods described previously (Meyer et al., 2006). For each of the 3 animals used, one section was selected from the region of the olfactory peduncle where pP completely encircles the subependymal zone (between the levels indicated by Figs 1D and E). A composite image of each section was made with a 60X objective using the tiled field mapping routine of an image analysis software package (MCID 7.0 Elite; Interfocus Imaging, Linton, England). Neurons were defined as large profiles containing a clear nucleus. For each neuron, the XY coordinates, soma area, and shape factor (ratio of long and short axes) was recorded. In order to align sections, polar plots were then created from the X and Y coordinates. Regional variations in cell size and shape were examined by mapping the cells 2 standard deviations or more above mean soma size and those more than 1 standard deviation below the mean.
Golgi Study
Three adult male mice were overdosed with barbiturate anesthetic as above and their brains placed in Golgi-Cox solution using procedures previously described (Brunjes and Kenerson, 2010; Glaser and Van Der Loos, 1981). Test sections from neocortical regions were examined regularly to determine optimal impregnation. By varying the staining time to accommodate each subject, complete staining was obtained in all samples, minimizing possible artifacts. The tissue was then embedded in celloidin, sectioned at 120μm, counterstained with methylene blue, dehydrated, mounted and coverslipped with DPX (Sigma, St. Louis, Mo). Methods described previously (Brunjes and Kenerson, 2010) were used to reconstruct neurons. Briefly, cells were traced at 400X using a computer-controlled microscope system (Neurolucida: MBF Bioscience, Williston VT), with every attempt made to select and reconstruct well-stained cells centered in the section such that the bulk of the dendritic field was not truncated or obscured. The sample was chosen so that roughly equal numbers of neurons were scored in each deep-to-superficial region of layer II of pP (8 in both the deep and intermediate thirds and 9 in the superficial zone) and by relative area of each of the radial locations (11 in pPl, 10 in pPd, and 2 each in pPm and pPv). For each cell, “branch analysis” was used to determine the length and number of branches at successive orders of bifurcation from the soma to provide a general estimate of the total amount and distribution of dendritic material and the number and extent of the dendritic arborizations.
Immunostaining Studies
Standard immunohistochemistry was used to stain free floating 50–60 μm thick vibratome sections from 3 animals for each of seven antigens: three calcium binding proteins (calbindin [CB], parvalbumin [PV], or calretinin [CR]) and four peptides (somatostatin [SOM], neuropeptide Y [NPY], cholecystokinin [CCK], or vasoactive intestinal polypeptide [VIP]). Briefly, sections were rinsed 4 times in 0.1M Tris-buffered saline (TBS, pH 7.2). Next sections were incubated for 30 minutes at room temperature in 0.3% H2O2 in TBS, rinsed 4 times in TBS with 0.3% Triton, and then incubated in blocking serum made up of 0.3% Triton and 5% normal serum in TBS for 1 hr. Sections were placed overnight into TBS solution containing primary antibody (see Table 1) and 0.3% Triton at 4°C. Following 4 washes in TBS, sections were then incubated in a TBS solution containing 0.2 % biotinylated secondary and 0.3% Triton for 1–2 hours. The secondary antibodies used were: donkey anti-rabbit (Jackson ImmunoResearch Labs, West Grove PA; Catalog number 711-065-152), donkey anti-goat (Jackson; 705-066-147), or goat anti-mouse (Jackson; 115-065-003). Following secondary incubation, sections were rinsed in wash buffer and incubated in avidin-biotin complex (ABC elite standard kit, Vector, Burlingame CA) for one hour. Finally, sections were reacted with DAB. Omission of the primary antibody during processing eliminated all tissue staining.
Table 1.
Primary Antibodies Used
| Antigen | Immunogen | Manufacturer | Catalog/lot number | Species | Dilution Used |
|---|---|---|---|---|---|
| Calbindin D-28k | Recombinant rat calbindin | Swant (Bellinzona, Switzerland) | 300/07 (F) | Mouse monoclonal | 1:1000 |
| Calretinin | Rat calretinin | Millipore (Temecula, CA) | AB1550/JC1597097 | Goat polyclonal | 1:1000 |
| Ca2+ calmodulin-dependent protein kinase II | Amino-acids 303–478 at C-terminus of CaMKII α | Santa Cruz (Santa Cruz, CA) | M-176/J2210 | Rabbit polyclonal | 1:300 |
| Cholecystokinin | Gastrin-17 | CURE Digestive Diseases Research Center (Los Angeles, CA) | 9303 | Mouse monoclonal | 1:1000 |
| Glutamic acid decarboxylase 67kDa | Recombinant GAD56 protein | Millipore (Temecula, CA) | MAB5406/LV1682629 | Mouse monoclonal | 1:500 |
| Neuropeptide Y | Neuropeptide Y coupled to bovine thyroglobulin | ImmunoStar (Hudson, WI) | 22940/812001 | Rabbit polyclonal | 1:1000 |
| Parvalbumin | Parvalbumin purified from carp muscle | Swant (Bellinzona, Switzerland) | 235/10–11 (F) | Mouse monoclonal | 1:1000 |
| Somatostatin | Somatostatin coupled to KLH | ImmunoStar (Hudson, WI) | 20067/216002 | Rabbit polyclonal | 1:1000 |
| Vasoactive intestinal peptide | VIP coupled to bovine thyroglobulin | ImmunoStar (Hundson, WI) | 20077/722001 | Rabbit polyclonal | 1:1000 |
Cell density for regions in the peduncle were obtained by estimating neuron number and region volume from photomicrographs of immunostained tissue made with a 10X objective and StereoInvestigator software (MBF Bioscience, Williston VT). Beginning with the most rostral section containing a portion of pE and continuing through the first four sections containing APC, all immuno-positive cells in every section were counted in each animal (20–25 sections per animal). Cells were required to be at least two standard deviations darker than the average of 10 background measurements taken in non-cellular areas of each section to be included. The borders of each region found in the peduncle (pE, pP, DPC, VTT, OT, APC) were traced, multiplied by section thickness, and summed to obtain volume measurements. The Abercrombie (1946) correction, based on mean profile diameter, was employed to make unbiased estimates of the number of immuno-positive cells by region (Guillery, 2002). Random tissue sections from all three animals in each antigen group were selected to establish the calibration parameters. The diameters of 10 to 50 randomly-selected immunopositive cell bodies per region were measured using a 100X objective and StereoInvestigator. Some differences in cell sizes among regions and antigens were found (e.g. pE cells stained for PV, SOM, and VIP were significantly smaller than their pP counterparts ((t(98) = 14.54, p < .0001; t(48) = 5.55, p < .0001; t(98)= 2.45, p = 0.016)); PV cells were significantly larger than the other immune-positive cells (t(378) = 6.04, p < .0001). Therefore, a separate mean profile diameter and subsequent correction factor was used for the cell count of each antigen and region.
Characterization of Primary Antibodies
Table 1 lists the antigen, immunogen, manufacturer, catalog/lot number, species in which the antibody was raised and the working dilution for each of the primary antibodies employed.
Anti-calbindin: mouse monoclonal antibody (Swant, Bellinzona, Switzerland) recognizing a single-band at ~28kDa in immunoblots of mouse brain homogenates, consistent with the known size of calbindin D-28K (manufacture’s datasheet). This antibody produced a pattern of staining similar to the reported distribution of CB in the APC (Suzuki and Bekkers, 2010).
Anti-calretinin: goat polyclonal antibody (Millipore, Temecula, CA) recognizing a single band at 29kDa in immunoblots of rat cerebellum, consistent with the known size of calretinin (Winsky et al., 1996). Preadsorption of the antibody with recombinant calretinin eliminates immunoreactivity in brain tissue (Winsky et al., 1996).
Anti-cholecystokinin: mouse monoclonal antibody (CURE, Los Angeles, CA) characterized by using enzyme-linked immunosorbent assay (ELISA) and radioimmunoassay (Ohning et al., 1994). It specifically binds the C terminal of CCK (Ohning et al., 1996), and produced a pattern of staining similar to the previously reported distribution of CCK in the PC (Suzuki and Bekkers, 2010a. b; 2011).
Anti-neuropeptide Y: rabbit polyclonal antibody (ImmunoStar, Hudson, TX) has staining blocked in immunhistochemistry by pre-absorption with the diluted antiserum with excess NPY, but not other related peptides such as peptide YY (manufacture’s datasheet). It produced a pattern of labeling in the APC similar to previous findings in the mouse PC (Suzuki and Bekkers, 2010).
Anti-parvalbumin: mouse monoclonal antibody (Swant, Bellinzona, Switzerland) labeled a subpopulation of neurons in normal brain with high efficiency, but does not stain the brain of parvalbumin knockout mice (manufacture’s datasheet). It produced a pattern of labeling in the APC similar to previous findings in the mouse PC (Suzuki and Bekkers, 2010).
Anti-somatostatin: rabbit polyclonal antibody (ImmunoStar, Hudson, TX) has staining blocked in immunhistochemistry by pre-absorption with somatostatin, somatostatin 25, and somatostatin 28, but not other related peptides such as NPY, VIP, substance P, amylin, glucagon, or insulin (manufacture’s datasheet). It produced a pattern of labeling in the APC similar to staining patterns reported for somatostatin in the rat PC (Cummings, 1997).
Anti-vasoactive intestinal peptide: rabbit polyclonal antibody (ImmunoStar, Hudson, TX) has staining blocked in immunhistochemistry by the pre-absorption with VIP, but not other related peptides such as secretin, gastric inhibitory polypeptide, somatostatin, glucagon, insulin, ACTH, gastrin 34, peptide YY, substance P, NPY, or CGRP (manufacture’s datasheet). It produced a pattern of labeling in the APC similar to previous findings in the mouse PC (Suzuki and Bekkers, 2010).
Anti-GAD67: mouse monoclonal antibody (Millipore, Temecula, CA) specifically identifies the 67kDa isoform of GAD from rat brain lysate on western blots. There was no detectable cross reactivity with GAD65 by western blot on brain lysate when compared to blot probed with an antibody for both GAD65 & GAD67 (Fong et al., 2005; manufacture’s datasheet). It produced a pattern of labeling in the granule cell layer of the olfactory bulb consistent with previous findings (Parrish-Aungst, et al., 2007).
Anti-CAMKII: rabbit polyclonal antibody (Santa Cruz Biotechnology, Santa Cruz CA) identifies a single band of 50 kD protein on Western blot analysis of CaMKII expression in the rat brain extract that is eliminated by preincubation with either non-phosphorylated or phosphorylated peptide (manufacturer’s datasheet).
Myelin Staining
A modification of the Schmued (1990) method was used. Adult male mice were anesthetized as above and perfused with 2% paraformaldehyde: 2% glutaraldehyde in PBS and postfixed. Vibratome sections (60 μm) mounted on subbed slides were washed in 0.02M PBS for 2 minutes and then incubated in 0.2% hydrogen tetrachloroaureate-trihydrate in 0.02M PBS at 60°C for 12–15 minutes. The staining was the intensified by immersion in 0.2% potassium gold chloride in 0.9% saline at 60°C while being monitored every 2–3 minutes. After two washes in 0.02M PBS the sections were incubated in 1% sodium thiosulfate for 3 minutes at 60°C., washed again, dehydrated and coverslipped.
LOT Electron Microscopy
An adult male mouse was anesthetized as above and perfused with 2% glutaraldehyde/2% paraformaldehyde in PBS. After post fixing overnight, 100 μm thick vibratome sections were cut. Two sections were selected to represent the rostral and caudal olfactory peduncle. The tissue was incubated for 30 minutes in 1% OsO4/PBS, embedded in Epon, and ultrathin sections imaged with a JEOL 1010 TEM at 800X using a 16 megapixel CCD camera. The LOT at both levels was visualized in composite montages. After measuring the perimeter of the LOT, sampling regions were identified at approximately 150 μm intervals. At each location a 50 μm wide sample extended from the pial surface to the deep border (defined as the area where axon density abruptly decreased) was obtained. Every myelinated profile within the test regions was outlined on a tablet computer (Lenovo Thinkpad X201). For axon density estimates the figures overlapping the left, but not the right border were included. For profile morphology (size and shape) figures overlapping both left and right borders were excluded. The strategy provided a sample of over 26,000 profiles. Images were analyzed with Image J (Rasband, 2009).
For the production and analysis of figures, images were acquired and minimally adjusted for brightness and contrast with Adobe Photoshop CS2 and plates were constructed with Adobe Illustrator (San Jose, CA).
Results
Figure 1 depicts selected coronal Nissl sections from a complete series through a mouse olfactory peduncle. The anterior-most (Fig 1A) is the final coronal section containing only OB tissue while the posterior-most is 21 sections (each 36 μm) more caudal. The mouse peduncle is much smaller than that of the rat: comparisons between celloidin-embedded sections from both species available in our lab indicated that the anterior/posterior extent is approximately 3X larger in the rat (2100 vs 750 μm). The mouse peduncle shares the same general configuration as the rat (compare Fig 1 with Figure 1 in Brunjes et al., 2005). As coronal sections are viewed in an anterior-to-posterior sequence, pP emerges on the lateral side in the deep granule cell layer of the OB In further posterior sections pPl arches dorsally over the SVZ (Fig 1B, C) and then, still later, begins to cross ventrally under the SVZ (Fig 1D). Further posteriorly pP entirely encircles the SVZ (Fig 1E, F). pE is first seen as a line of cells in the middle of Layer 1 on the lateral side of the peduncle. Slightly more caudally, pE arches dorsally and ventrally around pP (Fig 1C). The middle region of the thin line of cells disappears even more posteriorly, leaving only a dorsal and ventral remnant (Fig 1D). The ventral remnant is the last to be observed in caudal regions (Fig 1E).
Cell Counts
Unbiased stereological methods were employed to estimate the total number of neurons in pE and pP from mice 3, 12 and 24 months of age (Fig 2). No significant age-related differences in neuron number or tissue volume were found in pE (F’s < 3.12; p’s >0.86; Fig 2A). Pooling the data from all ages indicates that pE contains about 16,500 neurons in a cell layer with a volume of approximately 0.043 mm3.
Fig 2.

Age-related changes in neuronal populations in pars principalis and pars externa of the AON. A) Age related changes in the total number of neurons and cellular layer volume for pars externa; the data for pars principalis is in panel (B). C) Changes in cell density by age in both regions. D) Alterations in projected soma area for both regions. E) Data for pars principalis expressed by subregion: d= pars dorsalis, l=pars lateralis, m=pars medialis and v= pars ventroposterior. Asterisks depict significant comparisons. See text for details.
In pP both total neuron number (Fig 2B) and cell density (Fig 2C) exhibited more than a 20 percent decrease from 3 to 12 months and then remained relatively constant, though with the small sample size these changes were not significantly different (number: F(2,9)= 3.30, p<.084; density: F(2,9)= 3.90, p< 0.060. Fig 2B). A significant age-related decrease in the volume of Layer II was observed (F(2,9)= 4.31, p< 0.049). At every age group the cell density for pP was significantly lower than the cell density for pE (Fig 2C, F(1,18)=115.8, p<.001). Averaging across all ages reveals that pP contains about 58,300 neurons and that the volume of Layer 2 is approximately 0.307 mm3.
Cell Size
In pE there were no significant age-related changes in cell size (Fig 2D; F(2,9)=.316, p=ns). In pP there was more than a 10 percent decrease in cell size from 3 to 24 months, however this change was not significant (F(2,9)=1.88, p<.21). Average soma size in pE was significantly smaller than in pP at both 3 and 12 months, but not for the 24 month old group (F(1, 18)= 28.9, p<.001, Bonferroni’s post-hoc comparisons p<.05 at 3 and 12 months). Fig 2E depicts regional changes in pP. Although there were no overall changes in pP, average soma size decreased in pPl between 3 and 24 months (F(2,9)=4.51, p<.05, Tukey’s post-hoc p<.05).
Cell Distribution
Since, as mentioned, pP is often subdivided based on Nissl cytoarchitectonics, it was of interest to examine the stereological data to determine whether any age-related changes could be localized. Some of the area boundaries described by Haberly and Price (1978) are easily applied to mice; for example, defining pPl as the region deep to the LOT. Haberly and Price defined pPm by its projection pattern (primarily to the ipsilateral OB), location (on the ventral side of the medial surface of Layer II), and by the observation that the cells were “small and relatively tightly packed” (p. 763). They placed the ventral border as the cell free zone of Layer 2 (which, as noted above, is absent in mice). To address the issue, cell size and shape in the mouse (Fig 2) was compared with previous findings from the rat using identical methods and criteria (Meyer et al., 2005). Substantial differences in the distribution of large, small and flattened cells were observed in mice compared to rats (see Discussion). The precise delineation of pP subregions in mice may need to be assessed by other means, such as differences in projection patterns and or defined subpopulations of neurons.
As a result, boundaries were defined simply on geographical bases to examine any age-related regional changes in neuron number. pPl, observed throughout rostrocaudal extent of the AON, was defined as the region under the LOT. pPm, first seen in rostrocaudal sections when Layer 2 nearly encircles the SVZ, was considered to be the portion of cellular region from the mid-point on the medial side of the SVZ to the ventralmost extent of the Layer 2. The other areas were defined simply as the intermediate regions between these two: pPd extending from pPm to the point where Layer II bends to meet pPl, and pPv as ventro-lateral portions of Layer 2 not under the LOT and not a portion of pPm.
Fig 2B depicts the age-related changes in the number, regional volume and density in these zones. Significant differences in numbers of neurons were observed across both regions (F(3,2) =53.52, p<0.0001) and ages (F(3,2) = 3.55, p< 0.04) but not for the interaction (F(2,6) = 1.444, p=0.225). Similar differences were observed for the volume (regions: F(3,2) =270.88; p<0.0001; ages: F(3,2) = 5.702, p< 0.007, regions X age: F(2,6)= 1.507, p = 0.204). Cell density was very similar between the four zones, ranging only from 213,000 (pPd) to 237,000 (pPv) neurons/mm3. Therefore, the relative number of cells found within an area is determined by the region’s volume (pPd, 35.0%, pPl, 38.8%, pPv 12.4% and pPm 13.7%).
Cell morphology and phenotype
The pyramidal cell is the principal neuron type in pP. A sample of 25 Golgi-Cox stained cells was used to characterize the dendritic morphology of the “average” mouse pyramidal cell (Fig 4). The results indicate that standard mouse pyramidal cells in mice has 20 apical and 15 basilar branch segments with a total length of 705 and 382 μm, respectively.. Many pyramidal cells in other forebrain cortices (neocortex, hippocampus and PC) express CAMKII (e.g., Muller et al., 2006). Double labeling for CAMKII and GAD 67 suggests that the same is true in pP: in 212 GAD-67 immunopositive cells no overlap was encountered with CAMKII-positive profiles. The size, location, and soma morphology of many of the CAMKII cells was consistent with the pyramidal morphology.
Fig 4.

Quantitative analysis of apical and basilar dendritic fields of pars principalis pyramidal cells. A) drawings of a deep (left) and superficial (right) pyramidal cell. Scale bar = 40μm. Bottom: results of “branch” analysis of dendritic architecture for apical (B, D, F) and basilar (C, E, G) domains. Data set was subdivided by the location of cell somata, either in the deep, middle or superficial third of Layer 2. B, C) the percentage of cells observed with processes at each branch order. D, E) mean number of branches at each order. F, G) mean length of processes at each branch order.
A number of non-pyramidal neuron types have also been described in pP in both Golgi (Brunjes and Kenerson, 2010) and immunohistochemical (Brunjes et al., 2005) studies. Efforts have been made to catalog inhibitory interneurons in many other forebrain cortical areas (e.g., Ascoli et al., 2008, Markham et al., 2004), including the piriform cortex (Gavrilovici et al., 2010; Kubota and Jones 1993, Luna and Schoppa, 2008, Suzuki and Bekkers, 2010a, b, 2011; Westenbroek et al., 1987; Young and Sun, 2009; Zhang et al., 2006). GABAergic cells can be divided up into at least 7 different species by their co-expression of either different calcium binding proteins (CB, CR, and PV) or peptides (SOM, VIP, NPY, and CCK). Our data, derived from counts of every labeled cell in every section from three specimens labeled for each antigen, indicates that all 7 variants can be found throughout every structure in the mouse peduncle (Fig 5). Since evidence exists that some of these antigens can be colocalized within cells (e.g., Suzuki and Bekkers, 2010a, b), single labeling studies such as these can only be used to determine relative abundance. Wide variations in the expression of these antigens were observed. For example, in pP, CB-immunoreactive cells were the most numerous, and about five times more prevalent than cells labeled for PV. CR, VIP, and NPY-positive cells were one fourth as numerous as PV cells. SOM and CCK-immunopositive cells were relatively scarce.
Fig 5.
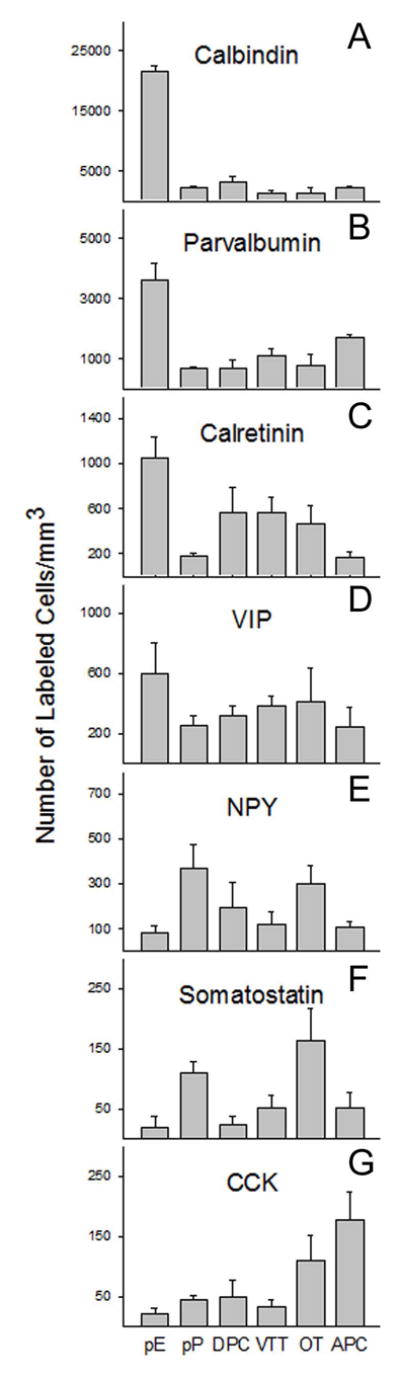
Regional differences in the density (number of labeled figures/mm3) of profiles immunopositive for each of 7 markers in all of the areas (pars externa, pars principalis, dorsal peduncular cortex, ventral tenia tecta, anterior olfactory tubercle and anterior piriform cortex) of the olfactory peduncle. Note that while each area contained cells expressing each antigen, patterns of expression varied considerably.
Neurons expressing the calcium binding proteins were especially prevalent in pE (Fig 5). Of the three, CB-immunopositive neurons were the most numerous, with levels in pE higher than any other peduncular zone (F(5,12)=133.2, p<.001, Tukey’s post-hoc p<.05 for comparisons of pE to every other region). PV immunostaining was also higher in pE than any other test area (F(5,12)= 13.2, p<.001, Tukey’s post hoc p<.05 for comparisons of pE to every other region). CR labeling was higher in pE than in either pP or APC (F(5,12)=4.88, p<.05, Tukey’s post hoc p<.05 for pE to pP and pE to APC comparisons). While pE does contain cells that express GAD 67 (unpublished data), it should be recognized that other olfactory areas exhibit strong immunoreactivity to calcium binding proteins in populations of non-GABAergic neurons (e.g., the vomeronasal nerve; Jia and Halpern, 2004; Kishimoto et al., 1993). Double-labeling studies need to be done to confirm the organization of pE.
While general patterns observed in other regions of the peduncle were roughly similar to those observed in pP (e.g., relatively dense staining for the calcium binding proteins), regional differences were observed (Fig 5). For example, SOM positive neurons were more numerous in OT than in pE or DPC (F(5,12)= 3.77, p<.05, Tukey’s post hoc p<.05 for OT comparisons to pE and DPC), and CCK positive neurons were more numerous in APC than in pE or VTT (F(5,12)=4.14, p<.05, Tukey’s post-hoc p<.05 for APC comparisons with pE and VTT). The findings indicate that immunostaining may be an important tool for researchers trying to carefully delineate boundaries within the peduncle.
The Lateral Olfactory Tract
Myelin staining
The LOT contains the axons of the OB’s projection neurons, the mitral and tufted cells. Myelin staining (Fig 6) reveals that in mice, as in other species, these axons course through the internal granule cell layer of the OB, dividing the region’s cell bodies into small groupings. Fibers from the dorsal and medial OB coalesce into a series of channels through the internal plexiform layer of the accessory olfactory bulb and then enter the dorsal LOT (Shepherd and Haberly 1970). Fibers from the remaining regions of the bulb move ventrolaterally and join the LOT directly. One difference between mice and rats is that the LOT is easily visible in Nissl sections of the mouse posterior OB as a ventrolateral cell free zone in the middle of the granule cell layer (Figs 1b, 6a, b). In more caudal sections the mitral cell layer thins and the LOT emerges to the surface of the brain. At this point, fibers can be seen entering the LOT both from the ventral and dorsal sides (Fig 6D).
Fig. 6.

Photomicrographs of sections through the anterior olfactory peduncle stained for myelin (black) and counterstained with methylene blue. A) In the caudal olfactory bulb the lateral olfactory tract is visible as an accumulation of myelinated fibers in the granule cell layer on the ventrolateral side (arrow). Note that on the dorsal side here and in panels (B) and (C) myelin staining is dense in deep region of the AOB, as fibers from the dorsal and medial olfactory bulb travel through the region to the enter the dorsal LOT in more caudal regions (top arrow in D). In panels (B) and (C) the LOT moves superficially to assume a position on the ventrolateral surface of the peduncle. Arrows in (D) depict myelinated fibers entering at both the dorsal and ventral margin of of the LOT. Myelin staining in the core of the sections represents the anterior limb of the anterior commissure, which is in close associate with the SVZ (rostral migratory stream). Scale bar = 500 μm.
Electron microscopy
Fig 7 depicts the two sample areas selected to study the organization of myelinated fibers in the LOT: an “anterior” region in the rostral peduncle where fibers are still entering the tract from the dorsal and ventral surfaces, and a “posterior” region where the tract has condensed into a more compact bundle. The data from the two sample sites yielded almost exactly the same number of profiles (13,374 in the anterior and 13,212 in the posterior region) but different sample areas (19340 μm2 in the anterior and 16868 μm2 in the posterior regions). Axon diameter was estimated by minor axis size as a conservative estimate of process caliber. Frequency histograms (Fig 7b) show that profile distributions had similar shapes in the two sample areas, with the mean size being slightly smaller in the anterior region (mean = 0.776 μm, SEM = 0.003 for anterior, 0.893 μmSEM =0.003 for posterior, t(26584)=12.79, p<.00001). Estimates of the shape of the axons were made by calculating the ratio of the minor and major axes, as flat profiles indicate axons travelling in a plane oblique to the coronal section. On average, profiles in the anterior sample were more elongated (mean= 0.586, vs the posterior = 0.705), doubtlessly due to the fact that the LOT is still receiving and organizing new axons. The average density of profiles was 0.671/μm2 in the anterior samples (with values ranging from 0.450/μm2 in area 4 to 1.170 μm2 in area 11, Fig 8) while the overall density in the posterior section was 0.872 profiles/μm2 (with a range from 0.550 μm2 in area 1 to 1.485 in area 8, Fig 9). It is difficult to accurately extrapolate these density estimates into total number of axons for several reasons. As mentioned, the anterior section does not have clear dorsal or ventral boundaries and in both regions the LOT does not have a clearly defined internal border, with axons often seen in varying numbers deep to the main body of dense profiles. Nevertheless, using an estimate of the area of the darkest staining in the light photomicrograph of the posterior section in Fig 7 with the mean profile density described above suggests that there are approximately 113,000 axons in the tissue at this level.
Fig 7.
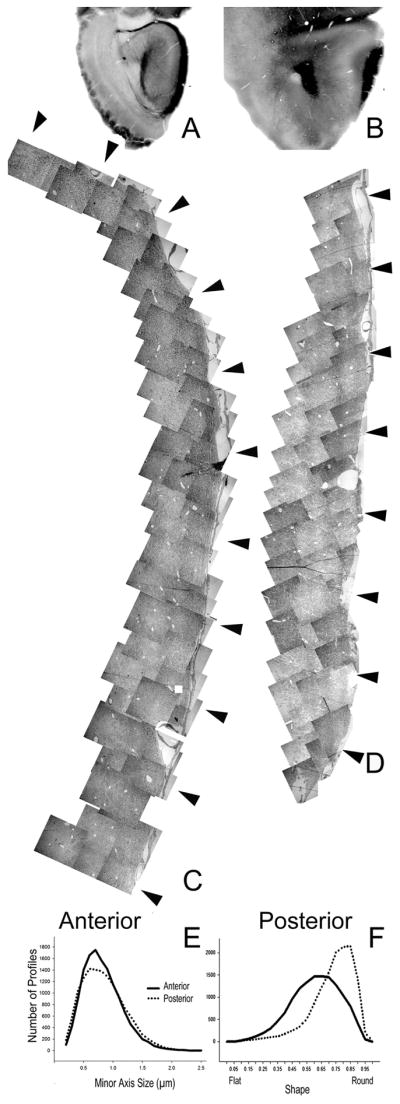
A, B) Low power photomicrographs of the sections selected to represent the lateral olfactory tract in the anterior (A) and posterior (B) olfactory peduncle. Montages of the electron micrographs of the LOTs are seen in C (anterior) and D (posterior). Arrows represent sample sites, which were 50 μm wide, extended from the pial surface (right) to the deep edge of the LOT, and were spaced approximately 150 μm apart. E) Frequency plot for the minor axis of axons sampled in the anterior and posterior zones. Both showed similar curves but the average was slightly higher in the posterior region. F) Frequency plot for the shape factor (ratio of minor and major axes) of figures sampled in the anterior and posterior zones. In the anterior region axons are more elongated as they move to assume their position within the tract.
Fig 8.

The LOT in the anterior olfactory peduncle. The left column depicts every myelinated axon found in each of the 11 sample areas (See Fig 7, A,C). (Level 1 = the dorsal LOT and Level 11 the ventral; the pial surface is to the right; columns are 50 μm wide). The next columns depict the subsample of those axons with minor axes > 1 SD above the mean (“large”), minor axes > 1 SD below the mean (“small”), and with shape factors (ratio of minor and major axes) > 1SD below the mean (“flat”).
Fig 9.

The LOT in the posterior olfactory peduncle. The left column depicts every myelinated axon found in each of the 8 sample areas (See Fig 7, B,D). (Level 1 = the dorsal LOT and Level 8 the ventral; the pial surface is to the right; columns are 50 μm wide). The next columns depict the subsample of those axons with minor axes > 1 SD above the mean (“large”), minor axes > 1 SD below the mean (“small”), and with shape factors (ratio of minor and major axes) > 1SD below the mean (“flat”).
Examination of the anterior region (Fig 8) suggests that at this level the LOT does not have an obvious and rigidly defined internal organization. Nevertheless, regional patterns do exist both along the dorsoventral extent of the tract and within sample areas, suggesting that the LOT does have internal structure. For example, large profiles were more prevalent in some areas (e.g., levels 2 and 4 in Fig 8) and small axons in others (e.g., 11). Within levels 3 and 11 small profiles congregate near the pial surface. Flat profiles are densest in the middle sample areas (levels 4–7). In area 9 a bundle of elongated axons can be seen traversing the region at an oblique angle, suggesting that they are relocating in the tract as a group.
The posterior region had a much smaller dorsal-ventral extent, but extended deeper into the peduncle. Once again, while not rigidly partitioned, regional variations are apparent. For example, sample areas 1 and 3 have the densest populations of small profiles, while the intervening areas (2 and 4) have a preponderance of large figures (Fig 9). As in the anterior region, bundles of small axons collected near the pial surface are obvious in some regions (1 and 6), and long profiles are rare at the dorsal and ventral extent of the tract, and more common in the middle, with highest densities in level 5.
In order to examine deep-to-superficial patterns in the tract the data sets were divided into quartiles (Fig 10). Differences were observed with every measure. First, the anterior and posterior test areas differed substantially in axon distribution: in anterior regions the highest number of profiles was found in the third deepest zone, while in posterior regions peak density was more superficial (Fig 10A). Second, average axon profile area in the anterior test region were significantly larger in superficial zones (Fig 10B; F(3, 13363)= 39.3, p <.001, all but two deepest regions differed significantly; Bonferroni’s post-hoc, p < .05), but posterior test region had the opposite gradient, with larger profiles in the deeper areas (F(3,13209)= 58.5, p<.001, all comparisons significantly different using Bonferroni’s post-hoc, p <.05). Overall, average profile area was significantly larger in the anterior sample (t(7457) =13.6, p<.001). Third, smallest caliber axons were found in the most superficial areas in anterior test region (Fig 10C) with the largest mean minor axes found in the two middle quartiles (F(3, 13363)= 97.8, p<.001, all but the middle two zones were significantly different using Bonferroni’s post-hoc test, p<.05). The posterior test region had more linear results with minor axes decreasing from deep to superficial (F(3,13209)= 106.3, p<.001, all comparisons significantly different using Bonferroni’s post-hoc test, p<.05). Overall, average axon caliber was significantly smaller in the anterior sample (t(8032) = 19.2, p<.001) and between anterior and posterior sites in each quadrant (Bonferroni’s post-hoc test, p<.05). Finally, axons were more elongated in the superficial-most quartile the anterior test region (F(3,13363)= 64.5, p<.001, significantly different from all other quadrants using Bonferroni’s post-hoc, p<.05). The opposite pattern was revealed in the posterior region with the roundest axons found superficially (F(3,13209)=26.5, p<.001, significantly different from all other quadrants using Bonferroni’s post-hoc, p<.05). In every quadrant axons were more elongated in the anterior sample (Bonferroni’s post-hoc, p<.05).
Figure 10.

Analysis of deep-to-superficial differences in the LOT. Data from both the anterior (black bars) and posterior (gray bars) peduncle samples were divided into deep-to-superficial quartiles. A) Percentage of axons found in each area. In the anterior sample more axons were located in the deep LOT, while in posterior regions more fibers were found superficially. B) Average profile area (μm2). Larger profiles were observed in the superficial half of the LOT in anterior regions when compared to either the deeper regions or to fibers in the posterior sample. C) Average minor axis (μm). Small caliber profiles were more prevalent in the superficial-most quartile both the anterior and posterior samples. D) Flat profiles were evenly distributed through the LOT in both regions, although profiles were more elongated in the anterior region, probably reflecting the redistribution of recent additions to the LOT.
Discussion
Mice have become a favored model in neurobiology for a number of reasons, including the rapid rise of research in genetics. The results of the experiments presented above afford a detailed look at the mouse olfactory peduncle. Many of the studies provide novel information about features of the peduncle that have not been reported before in any species. For example, the results include estimations of the number and density of neurons in the AON, and demonstrate age-related changes in neuron soma size in pPl. The findings also include an overview of various subspecies of GABAergic neurons. Every region in the peduncle expressed each of the 7 antigens (CR, CB, PV, VIP, CCK, SOM, and NPY) seen in other forebrain cortical areas (e.g., Ascoli et al., 2008; Markram et al., 2004) suggesting basic similarities in configuration. Nevertheless, substantial differences in the patterns of expression of the 7 markers were observed across the regions (Fig 5). For example, pE was very densely populated by neurons that express the calcium binding proteins (CB, PV and CR), but few of the other antigens investigated. pP and OT had high levels of SOM, while CCK levels were highest in the APC and OT. These individual signatures are, therefore, one way to define boundaries between regions in the peduncle.
Some of the results indicate that the olfactory peduncle of the mouse and rat are similar. Both share a general configuration, though the mouse’s smaller size means that the regions scale differently. While in both species the LOT ensheaths the lateral side of the anterior peduncle and coalesces into a compact bundle in caudal regions, in mice it is apparent deep within the granule cell layer of the caudal OB before emerging on the ventrolateral surface of the brain. The dendritic morphology of pP pyramidal cell is also similar in both mice and rats (Brunjes and Kenerson, 2010). Both species have similar average total numbers of apical (mouse: 20; rat: 19) and basilar (mouse: 15; rat: 18) dendritic branches. However, the average total length of dendrites in mice are about 30% smaller in both the apical (mouse: 705 μm, rat: 922 μm) and basilar (mouse: 382 μm, rat: 550 μm) domains. Thus, mouse pyramidal cells are structured similarly to those in the rat, but approximately a third smaller.
Other results indicate differences between the species. Nissl observations indicate that the difference in size of the olfactory peduncle between the species translates to anterior-posterior differences in the spatial distribution of structures. For example, in mice, within less than 100 μm of the point where pP completely encircles the SVZ, the DPC emerges as a thickening in the outer portion of dorsomedial Layer 2 (Fig 1D, E). In the rats the circular portion of the AON extends for a much longer a/p distance (>200 μm), and is marked by a conspicuous cell free zone (the traditional boundary between pPm and pPv, see Fig 1 in Brunjes et al., 2005) that is absent in mice. Second, in mice there is relatively little space between the caudal boundary of pE and the anterior-most portion of the VTT (Fig 1E–G), and a similar small space between the caudal end of the VTT and the emergence of the OT (Fig 1G,H). Third, in mice the OB extends deeply into the olfactory peduncle (Fig 1G: its caudal boundary is posterior the rostral border of the VTT, where in the rat there is about more than 200 μm gap between the two structures). Fourth, in mice pE is found primarily on the lateral side of the peduncle, barely crossing the midline as it arches across the dorsal pP, while in rats the structure encircles about two-thirds of the structure.
Second, the distribution of cell body size and shape in pP varies between mice and rats. For example, Fig 2C indicates that “small” cells (>1 STD smaller than mean soma projected area) are relatively uniformly distributed in the mouse, with 42% found in the ventral half of pP. However, Fig 1F in Meyer et al., 2005 indicates that in the rat more than half (57%) are found in the ventral portion of the structure. Different patterns were also observed for the “large” (>2 STD larger than mean soma projected area) cells; in mice, 75% are found on the dorsal side of pP (Fig 2B), but in the rat more than 75% of large cells are found on the lateral side, under the LOT (Fig 1E in Meyer et al., 2005). Similarly, in mice, cells with flattened somata are scarce in the ventromedial quadrant (Fig 2D) while in rats they are relatively evenly distributed throughout the structure (Fig 1H in Meyer et al., 2005). These findings suggest that rules based on Nissl cytoarchitectonics may not always be generalizable between species. The precise delineation of subregions in pP in mice, therefore, needs to be assessed by other means. One important way would be to replicate the work demonstrating regional differences in axonal projection patterns (Davis and Macrides, 1981; Luskin and Price, 1983; Reyher et al., 1988; Brunjes et al., 2005; Matsutani, 2010).
Species differences were also observed in the internal structure of the LOT. Price and Sprich (1975) reported that the rat LOT was substantially organized, with large axons concentrated in the mid-dorsoventral region and small axons were observed at the top and bottom of the tract. Figs 8–10 indicate that while there were local differences both on dorsoventral and superficial to deep dimensions in both the anterior and posterior peduncle, no large, overall patterns were observed in mice. Like the rat, in mice occasional collections of small axons were observed near the pial surface (Fig 8, 9).
The LOT contains the axons of the mitral and tufted cells from the OB. In anterior regions these fibers are topographically distributed; axons from the dorsal and ventral OB maintain the same position in the LOT. However, by the caudal olfactory peduncle the relationships disappear (Shepherd and Haberly, 1970; Price and Sprich, 1975; Inaki, 2004), and tufted cell fibers leave the tract to innervate the AON, OT and APC (Matsutani et al., 1989; Nagayama et al., 2010; Wesson and Wilson, 2010). The LOT also contains axons from other cells in the OB (Kosaka and Kosaka, 2010) and fibers that run rostrally towards the OB (e.g, from the horizontal limb of the diagonal band, Price and Powell, 1970). It would be of considerable interest to selectively visualize the axons from different sources in the LOT to compare their relative locations.
The results above suggest that the mouse LOT contains roughly 113,000 myelinated axons, a number quite different from previous estimates (e.g., Price and Sprich, 1975, reported 42,000 in the rat and Allison and Warwick, 1949, about 60,000 in the rabbit). One way to resolve this difference would be to assess the number of mitral and tufted cells, but most reported cell counts were made using biased counting methods (e.g., Allison and Warwick, 1949, Panhuber et al., 1985; Frazier-Cierpial and Brunjes, 1988). It has been estimated that the mouse OB has approximately 1800 glomeruli (Sakano, 2010; Isaaacson, 2010), and estimates of the number of mitral cells extending primary dendrites into a single glomerulus range from 25–100 (Cleland & Linster, 2005; Fantana et al., 2008; Isaacson, 2010). Assuming that 30 mitral cells innervate each glomerulus, about 54,000 mitral cell axons would be found in the LOT, a number higher than Price and Sprich (1975)’s estimate for the entire LOT. If the number of projecting tufted cells equals the number of mitral cells, then the LOT should contain 108,000 fibers from these cells. Adding in a consideration for the other projections from the bulb and centrifugal afferents described above, a number emerges that is reasonably close to the rough estimate included in present work.
Taken together, the results above provide a glimpse of the organization of the mouse olfactory peduncle. The work indicates that mice and rats differ in several respects and thus provides a caveat for those assuming that results from the two species are interchangeable. Most of regions that make up the peduncle are relatively unstudied but far from unimportant; their position in the olfactory circuit indicates that they play important roles in both odor processing and in linking olfaction to other brain areas. Further study will be important in unraveling the peduncle’s role in olfactory function.
Fig 3.

A) Polar plot showing locations of the sample of 2429 Nissl-stained cells derived from single matched sections of pars principalis selected from each of 3 animals. Plots of soma area yielded a unimodal distribution with a mean of 65.51 μm2. B) Large cells (>2 SD above mean soma area) were preferentially located in dorsal region while C) small cells (cell size > 1SD below the mean) were relatively uniformly distributed in the tissue. D) Analysis of soma shape (ratio of long to short axis) revealed that relatively flat cells (ratio < 0.70) were absent in the ventromedial quadrant but evenly distributed elsewhere. E) Frequency histogram of cell shape data suggests a uniform population of primarily round cells. Arrow shows cutoff for cells shown in panel D.
Acknowledgments
Supporting Grants: NIH DC0338
Thanks to Dr. Alev Erisir for help with electron microscopy, Dr. Susan Hendricks for stereological assistance, Jim Corson and Valerie Sapp. The antibody raised against CCK was provided by the CURE Digestive Diseases Research Center, Antibody/RIA core, NIH Grant #DK41301.
Literature Cited
- Abercrombie M. Estimation of nuclear population from microtome sections. Anat Rec. 1946;94:239–247. doi: 10.1002/ar.1090940210. [DOI] [PubMed] [Google Scholar]
- Adamek GD, Shipley MT, Sanders MS. The indusium griseum in the mouse: architecture, Timm’s histochemistry and some afferent connections. Brain Res Bull. 1984;12:657–68. doi: 10.1016/0361-9230(84)90147-3. [DOI] [PubMed] [Google Scholar]
- Ascoli GA, Alonso-Nanclares L, Anderson SA, Barrionuevo G, Benavides-Piccione R, Burkhalter A, Buzsáki G, Cauli B, Defelipe J, Fairén A, Feldmeyer D, Fishell G, Fregnac Y, Freund TF, Gardner D, Gardner EP, Goldberg JH, Helmstaedter M, Hestrin S, Karube F, Kisvárday ZF, Lambolez B, Lewis DA, Marin O, Markram H, Muñoz A, Packer A, Petersen CC, Rockland KS, Rossier J, Rudy B, Somogyi P, Staiger JF, Tamas G, Thomson AM, Toledo-Rodriguez M, Wang Y, West DC, Yuste R Petilla Interneuron Nomenclature Group. Petilla terminology: nomenclature of features of GABAergic interneurons of the cerebral cortex. Nat Rev Neurosci. 2008;9:557–68. doi: 10.1038/nrn2402. [DOI] [PMC free article] [PubMed] [Google Scholar]
- Brunjes PC, Illig KR, Meyer EA. A field guide to the anterior olfactory nucleus/cortex. Brain Res Reviews. 2005;50:305–335. doi: 10.1016/j.brainresrev.2005.08.005. [DOI] [PubMed] [Google Scholar]
- Brunjes PC, Kenerson M. The anterior olfactory nucleus: quantitative study of dendritic morphology. J Comp Neurol. 2010;518:1603–1616. doi: 10.1002/cne.22293. [DOI] [PMC free article] [PubMed] [Google Scholar]
- Cleland TA, Linster C. Computation in the olfactory system. Chem Senses. 2005;30:801–813. doi: 10.1093/chemse/bji072. [DOI] [PubMed] [Google Scholar]
- Cummings SL. Neuropeptide Y, somatostatin, and cholecystokinin of the anterior piriform cortex. Cell Tissue Res. 1997;289:39–51. doi: 10.1007/s004410050850. [DOI] [PubMed] [Google Scholar]
- Curtis MA, Monzo HJ, Faull RL. The rostral migratory stream and olfactory system: smell, disease and slippery cells. Prog Brain Res. 2009;175:33–42. doi: 10.1016/S0079-6123(09)17503-9. [DOI] [PubMed] [Google Scholar]
- Davis BJ, Macrides F. The organization of centrifugal projections from the anterior olfactory nucleus, ventral hippocampal rudiment and piriform cortex to the main olfactory bulb in the hamster: an autoradiographic study. J Comp Neurol. 1981;203:475–493. doi: 10.1002/cne.902030310. [DOI] [PubMed] [Google Scholar]
- Davis BJ, Macrides F, Young WM, Schneider SP, Rosene DL. Efferents and centrifugal afferents of the main and accessory olfactory bulbs in the hamster. Brain Res Bull. 1978;3:59–72. doi: 10.1016/0361-9230(78)90062-x. [DOI] [PubMed] [Google Scholar]
- Fantana AL, Soucy ER, Meister M. Rat olfactory bulb mitral cells receive sparse glomerular inputs. Neuron. 2008;59:802–814. doi: 10.1016/j.neuron.2008.07.039. [DOI] [PubMed] [Google Scholar]
- Fong AY, Stornetta RL, Foley CM, Potts JT. Immunohistochemical localization of GAD67-expressing neurons and processes in the rat brainstem: subregional distribution in the nucleus tractus solitaries. J Comp Neurol. 2005;493:274–290. doi: 10.1002/cne.20758. [DOI] [PubMed] [Google Scholar]
- Gavrilovici C, D’Alfonso S, Poulter MO. Diverse interneuron populations have highly specific interconnectivity in the rat piriform cortex. J Com Neurol. 2010;518:1570–88. doi: 10.1002/cne.22291. [DOI] [PubMed] [Google Scholar]
- Glaser EM, Van Der Loos H. Analysis of thick brain sections by obverse-reverse computer microscopy: application of a new, high clarity Golgi-Nissl stain. J Neurosci Methods. 1981;4:117–125. doi: 10.1016/0165-0270(81)90045-5. [DOI] [PubMed] [Google Scholar]
- Guillery RW. On counting and counting errors. J Comp Neurol. 2002;447:1–7. doi: 10.1002/cne.10221. [DOI] [PubMed] [Google Scholar]
- Gundersen HJG, Jensen EBV, Kieu K, Nielsen J. The efficiency of systematic sampling in stereology reconsidered. J Micros. 1999;193:199–211. doi: 10.1046/j.1365-2818.1999.00457.x. [DOI] [PubMed] [Google Scholar]
- Haberly LB. Parallel-distributed processing in olfactory cortex: new insights from morphological and physiological analysis of neuronal circuitry. Chem Senses. 2001;26:551–76. doi: 10.1093/chemse/26.5.551. [DOI] [PubMed] [Google Scholar]
- Haberly LB, Price JL. Association and commissural fiber systems of the olfactory cortex of the rat: II. Systems originating in the olfactory peduncle. J Comp Neurol. 1978;178:781–808. doi: 10.1002/cne.901810407. [DOI] [PubMed] [Google Scholar]
- Hayakawa T, Ito H, Zyo K. Neuroanatomical study of afferent projections to the supramammillary nucleus of the rat. Anat Embryol (Berl) 1993;188:139–148. doi: 10.1007/BF00186247. [DOI] [PubMed] [Google Scholar]
- Inaki K, Nishimura S, Nakashiba T, Itohara S, Yoshihara Y. Laminar organization of the developing lateral olfactory tract revealed by differential expression of cell recognition molecules. J Comp Neurol. 2004;479:243–56. doi: 10.1002/cne.20270. [DOI] [PubMed] [Google Scholar]
- Isaacson J. Odor representations in mammalian cortical circuits. Current Opin Neurobiol. 2010;20:328–331. doi: 10.1016/j.conb.2010.02.004. [DOI] [PMC free article] [PubMed] [Google Scholar]
- Jia C, Halpern M. Calbindin D28k, parvalbumin, and calretinin immunoreactivity in the main and accessory olfactory bulbs of the gray short-tailed opossum, Monodelphis domestica. J Morphol. 2004;259:271–280. doi: 10.1002/jmor.10166. [DOI] [PubMed] [Google Scholar]
- Kang N, Baum M, Cherry JA. Different profiles of main and accessory olfactory bulb mitral/tufted cell projections revealed in mice using an anterograde trace and a whole-mount flattened cortex preparation. Chem Senses. 2010;36:251–260. doi: 10.1093/chemse/bjq120. [DOI] [PMC free article] [PubMed] [Google Scholar]
- Kay RB, Meyer EA, Illig KR, Brunjes PC. Spatial distribution of neural activity in the anterior olfactory nucleus evoked by odor and electrical stimulation. J Comp Neurol. 2011;519:277–289. doi: 10.1002/cne.22519. [DOI] [PMC free article] [PubMed] [Google Scholar]
- Kikuta S, Kashiwadani H, Mori K. Compensatory rapid switching of binasal inputs in the olfactory cortex. J Neurosci. 2008;28:11989–11997. doi: 10.1523/JNEUROSCI.3106-08.2008. [DOI] [PMC free article] [PubMed] [Google Scholar]
- Kikuta S, Sato K, Kashiwadani H, Tsunoda K, Yamasoba T, Mori K. Neurons in the anterior olfactory nucleus pars externa detect right or left localization of odor sources. Proc Natl Acad Sci U S A. 2010;107:12363–8. doi: 10.1073/pnas.1003999107. [DOI] [PMC free article] [PubMed] [Google Scholar]
- Kishimoto J, Keverne EB, Emson PC. Calretinin, calbindin-D28k and parvalbumin-like immunoreactivity in mouse chemoreceptor neurons. Brain Res. 1993;610:325–329. doi: 10.1016/0006-8993(93)91417-q. [DOI] [PubMed] [Google Scholar]
- Kosaka T, Kosaka K. “Interneurons” in the olfactory bulb revisited. Neuroscience Research. 2011;69:93–99. doi: 10.1016/j.neures.2010.10.002. [DOI] [PubMed] [Google Scholar]
- Kubota Y, Jones EG. Co-localization of two calcium binding proteins in GABA cells of rat piriform cortex. Brain Res. 1993;600:339–44. doi: 10.1016/0006-8993(93)91394-8. [DOI] [PubMed] [Google Scholar]
- Luna VM, Schoppa NE. GABAergic circuits control input-spike coupling in the piriform cortex. J Neurosci. 2008;28:8851–8859. doi: 10.1523/JNEUROSCI.2385-08.2008. [DOI] [PMC free article] [PubMed] [Google Scholar]
- Markram H, Toledo-Rodriguez M, Wang Y, Gupta A, Silberberg G, Wu C. Interneurons of the neocortical inhibitory system. Nat Rev Neurosci. 2004;5:793–807. doi: 10.1038/nrn1519. [DOI] [PubMed] [Google Scholar]
- Matsutani S. Trajectory and terminal distribution of single centrifugal axons from olfactory cortical areas in the rat olfactory bulb. Neuroscience. 2010;169:436–48. doi: 10.1016/j.neuroscience.2010.05.001. [DOI] [PubMed] [Google Scholar]
- Matsutani S, Senba E, Tohyama M. Terminal field of cholecystokinin-8-like immunoreactive projection neurons of the rat main olfactory bulb. J Comp Neurol. 1989;285:73–82. doi: 10.1002/cne.902850107. [DOI] [PubMed] [Google Scholar]
- McGinley MJ, Westbrook GL. Membrane and synaptic properties of pyramidal neurons in the anterior olfactory nucleus. J Neurophysiol. 2011 doi: 10.1152/jn.00715.2010. In Press. [DOI] [PMC free article] [PubMed] [Google Scholar]
- Meyer EA, Illig KR, Brunjes PC. Differences in chemo- and cytoarchitectural features within pars principalis of the rat anterior olfactory nucleus suggest functional specialization. J Comp Neurol. 2006;498:786–795. doi: 10.1002/cne.21077. [DOI] [PMC free article] [PubMed] [Google Scholar]
- McNamara AM, Cleland TA, Linster C. Characterization of the synaptic properties of olfactory bulb projections. Chem Senses. 2004;29:225–33. doi: 10.1093/chemse/bjh027. [DOI] [PubMed] [Google Scholar]
- Muller JF, Mascagni F, McDonald AJ. Pyramidal cells of the rat basolateral amygdala: synaptology and innervation by parvalbumin-immunoreactive interneurons. J Comp Neurol. 2006;494:635–50. doi: 10.1002/cne.20832. [DOI] [PMC free article] [PubMed] [Google Scholar]
- Nagayama S, Enerva A, Fletcher ML, Masurkar AV, Igarashi KM, Mori K, Chen WR. Differential axonal projection of mitral and tufted cells in the mouse main olfactory system. Front Neural Circuits. 2010;4:1–8. doi: 10.3389/fncir.2010.00120. [DOI] [PMC free article] [PubMed] [Google Scholar]
- Neville KR, Haberly LB. Olfactory cortex. In: Shepherd GM, editor. The Synaptic Organization of the Brain. 5. Oxford Univ. Press; New York: 2004. pp. 415–454. [Google Scholar]
- Ohnig GV, Wong HC, Walsh JH. Different kinetics for immunoneutralization of circulating gastrin by gastrin monoclonal antibody and its Fab1 fragment in rats. Peptides. 1994;15:417–423. doi: 10.1016/0196-9781(94)90198-8. [DOI] [PubMed] [Google Scholar]
- Ohnig GV, Wong HC, Lloyd KC, Walsh JH. Gastrin mediates the gastric mucosal proliferative response to feeding. Am J Physiol. 1996;271:G470–476. doi: 10.1152/ajpgi.1996.271.3.G470. [DOI] [PubMed] [Google Scholar]
- Panhuber H, Laing DG, Willcox ME, Eagleson GK, Pittman AE. The distribution of the size and number of mitral cells in the olfactory bulb of the rat. J Anat. 1985;140:297–308. [PMC free article] [PubMed] [Google Scholar]
- Parrish-Aungst S, Shipley M, Erdelyi F, Szabo G, Puche A. Quantitative analysis of neuronal diversity in the mouse olfactory bulb. J Comp Neurol. 2007;501:825–836. doi: 10.1002/cne.21205. [DOI] [PubMed] [Google Scholar]
- Price JL. An autoradiographic study of complementary laminar patterns of termination of afferent fibers to the olfactory cortex. J Comp Neurol. 1973;150:87–108. doi: 10.1002/cne.901500105. [DOI] [PubMed] [Google Scholar]
- Price JL, Powell TPS. An experimental study of the origin and the course of the centrifugal fibers to the olfactory bulb in the rat. J Anat. 1970;107:215–237. [PMC free article] [PubMed] [Google Scholar]
- Price JL, Sprich WW. Observations on the lateral olfactory tract of the rat. J Comp Neurol. 1975;162:321–36. doi: 10.1002/cne.901620304. [DOI] [PubMed] [Google Scholar]
- Rasband WS. ImageJ. U. S. National Institutes of Health; Bethesda, Maryland, USA: 1997–2009. http://rsb.info.nih.gov/ij/ [Google Scholar]
- Sakano H. Neural map formation in the mouse olfactory system. Neuron. 2010;67:530–542. doi: 10.1016/j.neuron.2010.07.003. [DOI] [PubMed] [Google Scholar]
- Schmued LC. A rapid, sensitive histochemical stain for myelin in frozen brain sections. J Histochem Cytochem. 1990;38:717–20. doi: 10.1177/38.5.1692056. [DOI] [PubMed] [Google Scholar]
- Shepherd GM, Haberly LB. Partial activation of olfactory bulb: analysis of field potentials and topographical relation between bulb and lateral olfactory tract. J Neurophysiol. 1970;33:64–53. doi: 10.1152/jn.1970.33.5.643. [DOI] [PubMed] [Google Scholar]
- Shipley MT, Ennis M. Functional organization of olfactory system. J Neurobiol. 1996;30:123–176. doi: 10.1002/(SICI)1097-4695(199605)30:1<123::AID-NEU11>3.0.CO;2-N. [DOI] [PubMed] [Google Scholar]
- Suzuki N, Bekkers JM. Distinctive classes of GABAergic interneurons provide layer-specific phasic inhibition in the anterior piriform cortex. Cereb Cortex. 2010a;12:2971–2984. doi: 10.1093/cercor/bhq046. [DOI] [PMC free article] [PubMed] [Google Scholar]
- Suzuki N, Bekkers JM. Inhibitory neurons in the anterior piriform cortex of the mouse: classification using molecular markers. J Comp Neurol. 2010b;518:1670–87. doi: 10.1002/cne.22295. [DOI] [PubMed] [Google Scholar]
- Suzuki N, Bekkers JM. Two layers of synaptic processing by principal neurons in piriform cortex. J Neurosci. 2011;31:22156–2166. doi: 10.1523/JNEUROSCI.5430-10.2011. [DOI] [PMC free article] [PubMed] [Google Scholar]
- Wesson DW, Wilson DA. Sniffing out the contributions of the olfactory tubercle to the sense of smell: hedonics, sensory integration, and more? Neurosci Biobehav Rev. 2011;35:655–68. doi: 10.1016/j.neubiorev.2010.08.004. [DOI] [PMC free article] [PubMed] [Google Scholar]
- Westenbroek RE, Westrum LE, Hendrickson AE, Wu JY. Immunocytochemical localization of cholecystokinin and glutamic acid decarboxylase during normal development in the prepyriform cortex of rats. Brain Res. 1987;431:191–206. doi: 10.1016/0165-3806(87)90208-2. [DOI] [PubMed] [Google Scholar]
- Whitman MC, Greer CA. Adult neurogenesis and the olfactory system. Prog Neurobiol. 2009;89:162–75. doi: 10.1016/j.pneurobio.2009.07.003. [DOI] [PMC free article] [PubMed] [Google Scholar]
- Winsky L, Isaacs KR, Jacobowitz DM. Calretinin mRNA and immunoreactivity in the medullary reticular formation of the rat; colocatlization with glutamate receptors. Brain Res. 1996;741:123–133. doi: 10.1016/s0006-8993(96)00908-0. [DOI] [PubMed] [Google Scholar]
- Wyss JM, Sripanidkulchai K. The indusium griseum and anterior hippocampal continuation in the rat. J Comp Neurol. 1983;219:251–72. doi: 10.1002/cne.902190302. [DOI] [PubMed] [Google Scholar]
- Yan Z, Tan J, Qin C, Lu Y, Ding C, Luo M. Precise circuitry links bilaterally symmetric olfactory maps. Neuron. 2008;58:613–24. doi: 10.1016/j.neuron.2008.03.012. [DOI] [PubMed] [Google Scholar]
- Yoshida A, Dostrovsky JO, Chiang CY. The afferent and efferent connections of the nucleus submedius in the rat. J Comp Neurol. 1992;324:115–133. doi: 10.1002/cne.903240109. [DOI] [PubMed] [Google Scholar]
- Young A, Sun QQ. GABAergic inhibitory interneurons in the posterior piriform cortex of the GAD67--GFP Mouse. Cereb Cortex 2009. 2009;19:3011–29. doi: 10.1093/cercor/bhp072. [DOI] [PMC free article] [PubMed] [Google Scholar]
- Zhang C, Szabó G, Erdélyi F, Rose JD, Sun QQ. Novel interneuronal network in the mouse posterior piriform cortex. J Comp Neurol. 2006;499:1000–15. doi: 10.1002/cne.21166. [DOI] [PubMed] [Google Scholar]