Abstract
In the fasted state, increases in circulating glucagon promote hepatic glucose production through induction of the gluconeogenic program. Triggering of the cAMP pathway increases gluconeogenic gene expression via the de-phosphorylation of the CREB coactivator CRTC2 1. Glucagon promotes CRTC2 dephosphorylation in part through the PKA-mediated inhibition of the CRTC2 kinase SIK2. A number of Ser/Thr phosphatases appear capable of dephosphorylating CRTC2 2,3, but the mechanisms by which hormonal cues regulate these enzymes remain unclear. Here we show that glucagon stimulates CRTC2 dephosphorylation in hepatocytes by mobilizing intracellular calcium stores and activating the calcium/calmodulin dependent Ser/Thr phosphatase calcineurin/PP2B. Glucagon increased cytosolic calcium through the PKA-mediated phosphorylation of inositol 1,4,5-trisphosphate receptors (InsP3Rs), which we show here associate with CRTC2. Following their activation, InsP3Rs enhanced gluconeogenic gene expression by promoting the calcineurin-mediated dephosphorylation of CRTC2. During feeding, increases in insulin signaling reduced CRTC2 activity via the AKT-mediated inactivation of InsP3Rs. InsP3R activity was increased in diabetes, leading to upregulation of the gluconeogenic program. As hepatic down-regulation of InsP3Rs and calcineurin improved circulating glucose levels in insulin resistance, these results demonstrate how cross-talk between cAMP and calcium pathways at the level of the InsP3 receptor modulates hepatic glucose production under fasting conditions and in diabetes.
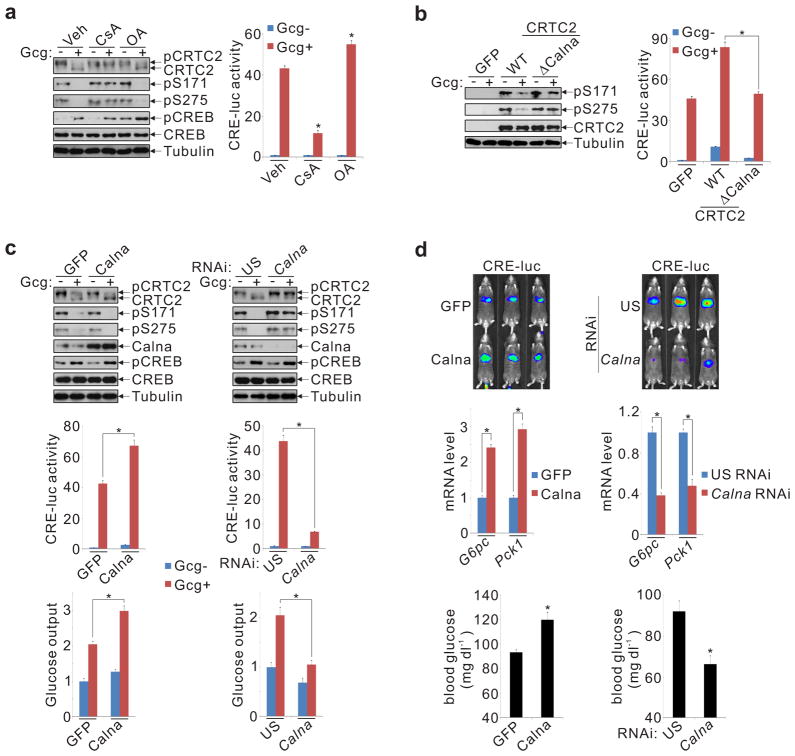
We tested a series of Ser/Thr protein phosphatase (PP) inhibitors for their ability to block CRTC2 activation in response to glucagon. Exposure to the PP2B/calcineurin inhibitor cyclosporine A (CsA) disrupted the glucagon-induced dephosphorylation and nuclear translocation of CRTC2, but okadaic acid (OA), an inhibitor of PP1, PP2A, and PP4 did not (fig. 1a, sup. fig. 1a). CsA and other calcineurin inhibitors also reduced CRE-luciferase (luc) reporter activity (fig. 1a, sup. fig. 1b), but they had no effect in cells expressing phosphorylation-defective (Ser171, 275 Ala) and therefore active forms of CRTC2 (sup. figs. 1c-e).
Figure 1.
Calcineurin promotes CRTC2 activation during fasting. A. Effect of Ser/Thr phosphatase inhibitors (okadaic acid (OA), cyclosporin A (CsA) on CRTC2 dephosphorylation and CRE-luciferase (luc) reporter activation (*P < 0.001; n=3). B. Effect of glucagon (Gcg) on dephosphorylation (left) and activity (right) of wild-type (WT) and calcineurin-defective (ΔCalna) CRTC2 in hepatocytes (*P < 0.001; n=3). C. Effect of calcineurin A over-expression (left) or knockdown (right) on CRTC2 dephosphorylation (top), CRE-luc reporter activity (middle, *P < 0.001; n=3), and glucose output (bottom, *P < 0.001; n=3) from hepatocytes. D. Effect of hepatic calcineurin over-expression (left) or knockdown (right) on CRE-luc activity, gluconeogenic gene (Pck1, G6pc) expression, and blood glucose concentrations in 6–8 hour fasted mice (*P < 0.01; n=5). For this and other figures, data are shown as mean ± s.e.m.
Based on the ability for CsA to interfere with CRTC2 activation, we considered that calcineurin may promote the dephosphorylation of CRTC2 in response to glucagon. Supporting this idea, CRTC2 contains two consensus (PXIXIT) motifs that mediate an association with calcineurin 3,4 (sup. fig. 2a,b). Moreover, mutation of both motifs disrupted the glucagon-dependent dephosphorylation of CRTC2 (fig. 1b) and prevented its nuclear translocation (sup. fig. 2c), thereby down-regulating CRE-luc activation (fig. 1b).
Based on these results, we tested whether calcineurin modulates expression of the gluconeogenic program. Adenoviral over-expression of the calcineurin catalytic subunit in hepatocytes augmented CRTC2 dephosphorylation, CRE-luc activity, and glucose secretion in response to glucagon, whereas calcineurin knockdown had the opposite effect (fig. 1c). Although calcineurin could, in principle, modulate CRTC2 activity indirectly through effects on cAMP signaling, calcineurin over-expression or knockdown did not alter the phosphorylation of cellular PKA substrates in cells exposed to glucagon (sup. fig. 2d).
We examined next whether calcineurin modulates hepatic gluconeogenesis in vivo. Modest (2-fold) over-expression of calcineurin in liver increased gluconeogenic gene expression, hepatic CRE-luc activity, and fasting blood glucose concentrations (fig. 1d, sup. fig. 3a). Conversely, knockdown of hepatic calcineurin reduced expression of the gluconeogenic program and lowered circulating glucose levels (fig. 1d, sup. fig. 3b), demonstrating that this phosphatase contributes to the fasting adaptation in liver. Calcineurin appeared to stimulate gluconeogenesis via the CREB pathway; depletion of CRTC2 blocked effects of calcineurin over-expression in this setting (sup. fig. 4).
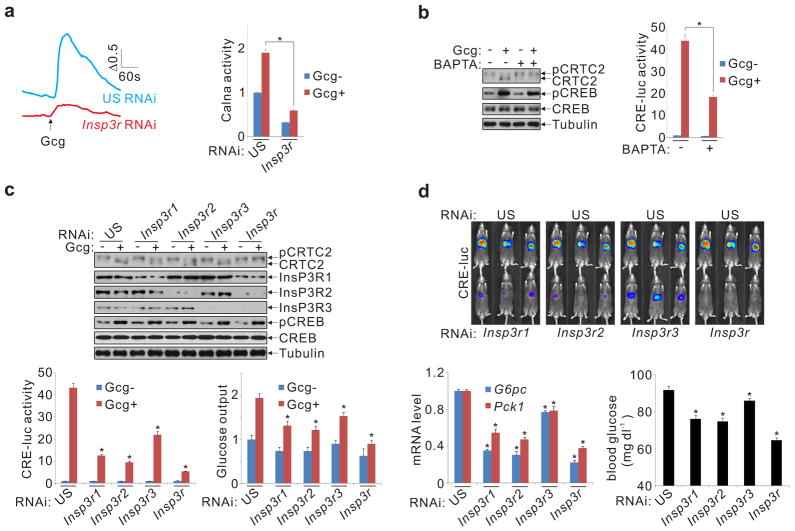
Realizing that calcineurin activity is dependent on increases in intracellular calcium, we tested whether the cAMP pathway stimulates calcium mobilization. Exposure of primary hepatocytes to glucagon triggered a rapid increase in cellular free calcium (fig. 2a, sup. fig. 5a); these effects were partially reversed by co-treatment with the PKA inhibitor H89 (sup. fig. 5b). The rise in intracellular calcium appears critical for CRTC2 activation because co-incubation with the calcium chelator BAPTA disrupted CRTC2 dephosphorylation and CRE-luc activation in response to glucagon (fig. 2b). Arguing against an effect of calcium on cAMP signaling, exposure to BAPTA did not block the PKA-mediated phosphorylation of CREB in response to glucagon.
Figure 2.
Glucagon stimulates CRTC2 dephosphorylation via activation of InsP3 receptors. A. Effect of glucagon (Gcg) on calcium mobilization in hepatocytes by fluorescence imaging. Calcium mobilization and calcineurin activation following knockdown of all three InsP3R family members shown (*P < 0.001; n=3). B. Effect of calcium chelator (BAPTA) on CRTC2 dephosphorylation and CRE-luc activation (*P < 0.001; n=3). C. Effect of InsP3R depletion on CRTC2 dephosphorylation, CRE-luc activity, and glucose output from hepatocytes (*P < 0.001; n=3). D. Effect of hepatic InsP3R knockdown on CRE-luc activity, blood glucose, and gluconeogenic gene expression (*P < 0.01; n=5).
We imagined that cAMP may increase calcium mobilization through the PKA-dependent phosphorylation of an intracellular calcium channel. In mass spectrometry studies to identify proteins that undergo phosphorylation by PKA in response to glucagon, we recovered the inositol 1,4,5-trisphosphate receptor 1 (InsP3R1) from immunoprecipitates of phospho-PKA substrate antiserum (sup. fig. 5c). InsP3R1 and its related family members (InsP3R2, InsP3R3) are calcium release channels that promote the mobilization of endoplasmic reticulum (ER) calcium stores following their activation in response to extracellular signals 5–9. Moreover, cAMP agonists have also been shown to enhance InsP3R receptor activity through PKA-mediated phosphorylation.
Inhibiting InsP3Rs, either by exposure of hepatocytes to Xestospongin C (Xc) or by knockdown of all three InsP3Rs, disrupted cytosolic calcium mobilization and calcineurin activation in response to glucagon and forskolin (fig. 2a, sup. fig. 6a). Moreover, Xc treatment and InsP3R knockdown also blocked glucagon effects on CRTC2 dephosphorylation, CRE-luc activation, and induction of the gluconeogenic program (fig. 2c, sup. fig. 6a,b). We confirmed effects of InsP3R depletion using hepatocytes from mice with a knockout of InsP3R2 10, the predominant InsP3R isoform in these cells (sup. figs. 6c-e).
Based on these results, InsP3Rs would also be expected to modulate fasting glucose production in vivo. Decreasing hepatic InsP3R expression, either by knockdown of all three Insp3Rs in liver or by targeted disruption of the InsP3R2 gene, reduced fasting CRE-luc activity, gluconeogenic gene expression, and circulating glucose concentrations, demonstrating the importance of these receptors in glucose homeostasis (fig. 2d, sup. fig. 7).
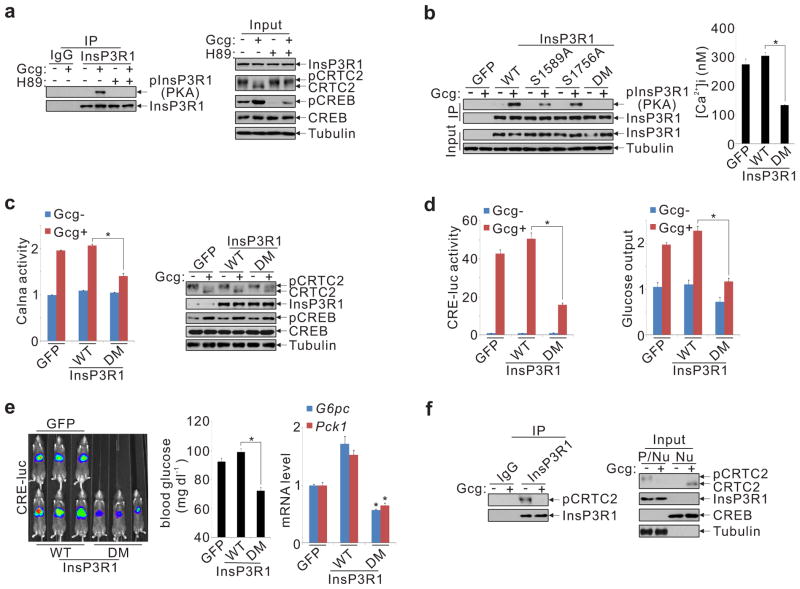
We tested whether glucagon modulates InsP3R activity through PKA-mediated phosphorylation. Exposure of hepatocytes to glucagon increased the phosphorylation of InsP3R1 as well as InsP3R2 and InsP3R3 by immunoblot assay with phospho-PKA substrate antiserum; these effects were blocked by the PKA inhibitor H89 (fig. 3a, sup. fig. 8a). Moreover, mutation of serine residues at consensus PKA sites in InsP3R1 (Ser1589, Ser1756) to alanine completely disrupted InsP3R1 phosphorylation in response to glucagon (fig. 3b). As a result, over-expression of PKA-defective (S1589,1756A) InsP3R1 interfered with calcium mobilization and calcineurin activation, and it reduced CRE-luc activation and glucose secretion from hepatocytes exposed to glucagon (fig. 3b-d).
Figure 3.
Glucagon stimulates CRTC2 activity via PKA-dependent phosphorylation of InsP3Rs. A. and B. Immunoblots of InsP3R1 immunoprecipitates using phospho-PKA substrate antiserum to show effect of H89 (A) and Ala mutations (B) at one or both (DM) PKA consensus sites (Ser1589, Ser1756) on InsP3R1 phosphorylation in hepatocytes exposed to glucagon (Gcg). Effect of wild-type and PKA-mutant InsP3R1 on calcium mobilization in response to Gcg (B) shown (*P < 0.001; n=3). C. and D. Effect of wild-type or PKA-defective InsP3R1 (DM) on calcineurin (Calna) activation (C) and CRTC2 dephosphorylation (C), as well as CRE-luc activation (D) and glucose output (D) from hepatocytes (*P < 0.001; n=3). E. Effect of wild-type and PKA-defective InsP3R1 on hepatic CRE-luc activity, fasting blood glucose, and gluconeogenic gene expression (G6pc, Pck1) (*P < 0.01 versus wild-type; n=5). F. Co-immunoprecipitation of CRTC2 with InsP3R1 in primary hepatocytes. Exposure to glucagon (100 nM; 15 minutes) indicated. Input levels of CRTC2 and InsP3R1 in nuclear (Nu) and post-nuclear (p/Nu) supernatant fractions shown.
Similar to glucagon, fasting also stimulated hepatic InsP3R1 phosphorylation at Ser1589 and Ser1756 (sup. fig. 8b). And over-expression of PKA-defective InsP3R1 reduced fasting CRE-luc induction, calcineurin activation, and gluconeogenic gene expression, leading to lower circulating glucose concentrations (fig. 3e, sup. fig. 8c,d). Taken together, these results support an important role for the PKA-mediated phosphorylation of InsP3R in hepatic gluconeogenesis.
We considered that the proximity of CRTC2 to the calcium signaling machinery may be important for its activation. Supporting this notion, CRTC2 was found to associate with InsP3R1 via its N-terminal CREB binding domain (CBD) in co-immunoprecipitation assays (fig. 3f, sup. figs. 9a-d). Moreover, CRTC2 was enriched in ER-containing high density microsomal (HDM) fractions, which also contain the InsP3Rs (sup. fig. 9e). The InsP3R:CRTC2 association appears critical for CRTC2 localization in the perinuclear space because RNAi-mediated knockdown of the InsP3Rs led to redistribution of CRTC2 in the cytoplasm (sup. fig. 9f). Disrupting the CRTC2:InsP3R interaction, by deletion of the CBD in CRTC2 or by addition of an N-terminal myristoylation signal that targets CRTC2 to the plasma membrane, blocked CRTC2 dephosphorylation and CRE-reporter activation in response to glucagon (sup. figs. 9g-i). Taken together, these results suggest that the association of CRTC2 with InsP3Rs enhances its sensitivity to fasting signals.
Under feeding conditions, insulin inhibits gluconeogenesis in part by increasing CRTC2 phosphorylation. We wondered whether insulin interferes with InsP3R effects on CRTC2 activitation. Supporting this idea, AKT has been shown to block calcium mobilization by phosphorylating InsP3Rs at Ser 2682 (in InsP3R1) 11. Indeed, exposure of hepatocytes to insulin increased InsP3R phosphorylation by immunoblot analysis with phospho-AKT substrate antiserum (sup. fig. 10a); mutation of Ser 2682 (in InsP3R1) to alanine blocked these effects. Insulin treatment also reduced glucagon-dependent increases in calcium mobilization and calcineurin activation in cells expressing wild-type InsP3R1, but it had no effect in cells expressing AKT-defective (S2682A) InsP3R1 (sup. fig. 10b). As a result, CRTC2 dephosphorylation, CRE-luc activity, and glucose output were elevated in hepatocytes expressing (S2682A)-InsP3R compared to wild-type (sup. fig. 10c).
We examined whether InsP3R1 phosphorylation by AKT is important in regulating hepatic glucose production in vivo. In line with this notion, feeding increased hepatic InsP3R1 phosphorylation at Ser2682 (sup. fig. 8b). Moreover, over-expression of AKT-defective InsP3R1 partially suppressed feeding-induced decreases in CRE-luc activity and gluconeogenic gene expression, leading to elevations in circulating glucose concentrations (sup. fig. 10d). Taken together, these results suggest that the AKT-mediated phosphorylation of InsP3Rs during feeding inhibits hepatic gluconeogenesis by blocking the calcineurin-dependent dephosphorylation of CRTC2.
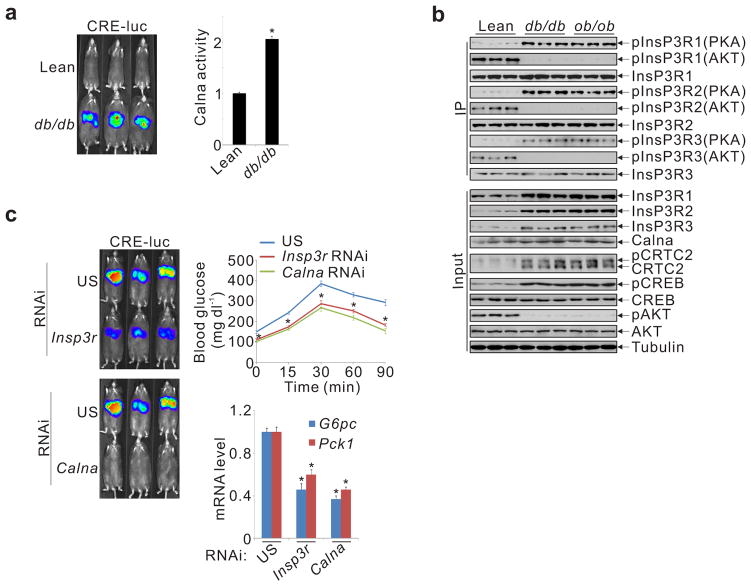
We wondered whether hepatic InsP3R signaling contributes to increases in gluconeogenesis in the setting of insulin resistance. Supporting this notion, hepatic calcineurin activity was enhanced in both ob/ob and db/db diabetic animals, leading to increases in CRE-luc activity (fig. 4a, sup. fig. 11a,b). Pointing to a role for InsP3R, hepatic amounts of PKA-phosphorylated, active InsP3Rs were increased in these diabetic mice, while amounts of AKT-phosphorylated, inactive InsP3R were reduced (fig. 4b). Correspondingly, knockdown of either calcineurin or InsP3Rs in db/db mice reduced CRE-luc activity, gluconeogenic gene expression, and hepatic gluconeogenesis (fig. 4c, sup. fig. 11c).
Figure 4.
InsP3R activity is upregulated in diabetes. A. Hepatic CRE-luc and calcineurin activity in lean and db/db mice (*P < 0.001; n=5). B. Immunoblots showing relative amounts and phosphorylation of InsP3R family members in livers of ad libitum fed lean, db/db, or ob/ob mice. InsP3R phosphorylation at PKA or AKT sites indicated. C. Effect of RNAi-mediated depletion of InsP3Rs or calcineurin A on CRE-luc activity, gluconeogenic gene expression, and hepatic glucose production in db/db mice, determined by pyruvate tolerance testing (*P < 0.01; n=5).
Collectively, our results demonstrate that glucagon promotes CRTC2 dephosphorylation during fasting by triggering increases in cytoplasmic calcium that lead to calcineurin activation (sup. fig. 12). The ability for glucagon to increase calcium signaling via the PKA-mediated phosphorylation of InsP3Rs demonstrates an important regulatory node for cross-talk between cAMP and calcium signaling pathways in liver and perhaps other insulin sensitive tissues. The partial inhibition of calcium entry by the PKA inhibitor H89 also points to additional regulatory inputs12,13 that may function with PKA to increase InsP3R activity in response to glucagon. CRTC2 has also been found to stimulate metabolic gene expression by upregulating the nuclear hormone receptor coactivator PGC1α in liver 14,15 and muscle 16. Based on the well-recognized role of calcium signaling in PGC1α dependent transcription, InsP3Rs may also function importantly in this setting.
METHODS SUMMARY
Adenoviruses were delivered by tail vein injection 17. Hepatic CRE-luc activity was visualized using an IVIS Imaging system. Mice were imaged 3–5 days after injection of CRE-luc adenovirus. Pyruvate tolerance testing was performed on mice fasted overnight and injected intraperitoneally with pyruvate (2g kg−1). Insp3r2 knockout mice have been described 10. Cultured primary mouse hepatocytes were prepared as reported 18. Cellular fractionation studies were conducted using primary mouse hepatocytes 18. Calcium imaging experiments were performed using a CCD camera on primary hepatocytes loaded with fura-2 dye. Mass spectrometry studies were performed on CRTC2 immunoprecipitates prepared from HEK293T cells and on immunoprecipitates of phospho-PKA substrate antiserum prepared from primary hepatocytes exposed to glucagon. Anti-InsP3R1 (A302-158A) and InsP3R3 (A302-160A) antibodies were purchased from Bethyl Laboratories, anti-InsP3R2 (ab77838) antiserum was from Abcam, anti-Calcineurin (610260) from BD Biosciences, anti-GRP78 (ADI-SPA-826-F) from Enzo Life Sciences, anti-phospho-PKA substrate (RRXS/T, 9624), anti-phospho-AKT substrate (RXXS/T, 9614) and CRTC2 (pS171, 2892) from Cell Signaling. Phospho (Ser275) CRTC2 antibody was used as described 19. Details are included in the Supplementary Methods.
METHODS
Mouse strains and adenovirus
Adenoviruses (1 X10⁸ plaque forming units (pfu) GFP, Calcineurin, InsP3R1, InsP3R1 DM (S1589A/S1756A), unspecific (US) RNAi, Calcineurin RNAi, Insp3r1 RNAi, Insp3r2 RNAi, Insp3r3 RNAi, Crtc2 RNAi, 1 X10⁹ pfu CRE-luc reporter, 5X10⁷ pfu RSV β-gal) were delivered to 8–10 week old male C57BL/6J, B6.V-lep<ob>/J, B6.Cg-m+/+Lepr<db>/J by tail vein injection 17. Insp3r2 knockout mice were described previously 10. All mice were adapted to their environment for 1 week before study and were housed in colony cages with 12h light/dark cycle in a temperature-controlled environment. For in vivo imaging experiments, mice were imaged on day 3–5 after adenovirus delivery. Wild-type CRTC2, CRTC2 (S171A), GFP, unspecific RNAi, Crtc2 RNAi, CRE-luc, and RSV β-gal adenoviruses have been described previously 17,20. The adenoviruses containing rat InsP3R1, InsP3R1 DM and InsP3R1 (S2682A) were generated from the InsP3R1 plasmid, kindly provided by Dr. Ilya Bezprozvanny (UT Southwestern Medical Center at Dallas). Calcineurin adenovirus was constructed using a mouse Calcineurin plasmid (Addgene). CRTC2 CBD (51-692aa), S275A and S171A/S275A adenoviruses were made from mouse CRTC2. Myristoylated-CRTC2 (Myr-CRTC2) adenovirus was generated with mouse CRTC2 fused to an N-terminal myristoylation tag (MGSSKSKPKDPSQR) from Src. Calcineurin RNAi, Insp3r1 RNAi, Insp3r2 RNAi, Insp3r3 RNAi adenoviruses were constructed using the sequence 5’-GGGTACCGCATGTACAGGAAAA-3’, 5’-GGGTACTGGAATAGCCTCTTCC-3’, 5’-GGGTAACAAGCACCACCATCCC-3’ and 5’-GGGCAAGCTGCAGGTGTTCCTG-3’, respectively. All expressed constucts used in this study were confirmed by sequencing.
In vivo analysis
For in vivo imaging, mice were imaged as described 17,20 under ad libitum feeding conditions or after fasting for 6 hours. For pyruvate challenge experiments, mice were fasted overnight and injected intraperitoneally with pyruvate (2g kg−1). Blood glucose values were determined using a LifeScan automatic glucometer. For immunoblot, mouse tissues were sonicated, centrifuged and supernatants were reserved for protein determinations, and SDS – PAGE analysis.
Cell culture, cellular fractionation, luciferase assay, calcineurin activity and cAMP measurement
HEK293T (ATCC) cells were cultured in DMEM containing 10% FBS (HyClone), 100 mg ml−1 penicillin-streptomycin. Mouse primary hepatocytes were isolated and cultured as previously described 18. Cellular fractionation studies were conducted as previously reported 18. For reporter studies, Ad-CRE-luc infected hepatocytes (1 pfu per cell) were exposed to glucagon (Gcg, 100 nM) for 2~4h. For cyclosporine A (CsA, 10 μM) or okadaic acid (OA, 100 nM) or cell permeable calcineurin autoinhibitory peptide (10 μM) or CN585 (100 μM) or Calyculin A (10 nM) or Xestospongin C (Xc, 2 μM) or H89 (30 μM) or BAPTA (50 μM) inhibition, hepatocytes were pre-treated with the inhibitors for one hour. Luciferase activities were normalized to β-galactosidase activity from adenoviral-encoded RSV β-gal. Calcineurin activity (test kit from Enzo Life Sciences) and cellular cAMP levels (test kit from Cayman Chemical Company) were measured according to manufacturer’s instructions.
Calcium imaging
Mouse primary hepatocytes were plated on glass coverslips and loaded with 5 μM Fura-2 acetoxymethyl ester (Molecular Probes) in the presence of 0.025% (w/v) pluronic F127 (Sigma-Aldrich) in Media 199 (Mediatech) for 30 minutes. Coverslips were mounted on a laminar flow perfusion chamber (Warner Instruments Corp.) and perfused with Media 199 or a solution of 100 nM glucagon in Media 199. Images of Fura-2 loaded cells were collected with a cooled CCD camera while the excitation wavelength was alternated between 340 nm and 380 nm. The ratio of fluorescence intensity at the two excitation wavelengths was calculated after subtracting background fluorescence. [Ca2+]i (cytosolic free calcium concentration) was calculated using a Fura-2 calcium imaging calibration kit (Invitrogen). Images were collected and analyzed using the MetaFluor software package (Universal Imaging Corp.). Graphs represent average responses from groups of 30–40 individual cells from representative single experiments. Bar graphs represent average responses (fold over average baseline) from 150–200 cells per condition. All experiments were repeated at least three times with similar results.
Immunoblot, immunoprecipitation, immunostaining
Immunoblot, immunoprecipitation, and immunostaining assays were performed as described 18. CRTC2, pCREB (Ser133), CREB, pAKT (Thr308), AKT, tubulin, HA, and FLAG antibodies were previously described 18. The antibodies anti-InsP3R1 (A302-158A) and InsP3R3 (A302-160A) were purchased from Bethyl Laboratories, anti-InsP3R2 (ab77838) from Abcam, anti-Calcineurin (610260) from BD Biosciences, anti-GRP78 (ADI-SPA-826-F) from Enzo Life Sciences, anti-phospho-PKA substrate (RRXS/T, 9624), anti-phospho-AKT substrate (RXXS/T, 9614) and CRTC2 (pS171, 2892) from Cell Signaling. CRTC2 (pS275) antibody was employed as described 19.
Quantitative PCR
Total cellular RNAs from whole liver or from primary hepatocytes were extracted using the RNeasy kit (Qiagen) and used to generate cDNA with SuperScript II enzyme (Invitrogen). cDNA were analyzed by quantitative PCR as described 18.
Mass spectrometry
Immunoprecipitates of endogenous CRTC2 from HEK293T cells and of phospho-PKA substrate antiserum from glucagon stimulated hepatocytes were prepared for mass spectrometric studies as previously reported 21, and analyzed by electrospray ionization tandem mass spectrometry on a Thermo LTQ Orbitrap instrument.
Statistical analyses
All studies were performed on at least three independent occasions. Results are reported as mean ± s.e.m. The comparison of different groups was carried out using two-tailed unpaired Student’s t-test. Differences were considered statistically significant at P<0.05.
Supplementary Material
Acknowledgments
This work was supported by NIH grants R01-DK049777, R01-DK083834, and R01-DK091618 (MM), the Kieckhefer Foundation, The Clayton Foundation for Medical Research, and the Leona M. and Harry B. Helmsley Charitable Trust.
Footnotes
Author Contributions: YW, IT, and MM designed and interpreted the experiments. YW, GL, RS, and JG carried out the experimental work. YW, KO, and JC carried characterized glucose metabolism in Insp3R2 knockout mice. WF performed proteomic studies, and YW and MM wrote the paper.
References
- 1.Altarejos JY, Montminy M. CREB and the CRTC co-activators: sensors for hormonal and metabolic signals. Nat Rev Mol Cell Biol. 2011;12:141–51. doi: 10.1038/nrm3072. [DOI] [PMC free article] [PubMed] [Google Scholar]
- 2.Yoon YS, et al. Suppressor of MEK null (SMEK)/protein phosphatase 4 catalytic subunit (PP4C) is a key regulator of hepatic gluconeogenesis. Proc Natl Acad Sci U S A. 2010;107:17704–9. doi: 10.1073/pnas.1012665107. [DOI] [PMC free article] [PubMed] [Google Scholar]
- 3.Screaton RA, et al. The CREB coactivator TORC2 functions as a calcium- and cAMP-sensitive coincidence detector. Cell. 2004;119:61–74. doi: 10.1016/j.cell.2004.09.015. [DOI] [PubMed] [Google Scholar]
- 4.Hogan PG, Chen L, Nardone J, Rao A. Transcriptional regulation by calcium, calcineurin, and NFAT. Genes Dev. 2003;17:2205–32. doi: 10.1101/gad.1102703. [DOI] [PubMed] [Google Scholar]
- 5.Ferris CD, Huganir RL, Bredt DS, Cameron AM, Snyder SH. Inositol trisphosphate receptor: phosphorylation by protein kinase C and calcium calmodulin-dependent protein kinases in reconstituted lipid vesicles. Proc Natl Acad Sci U S A. 1991;88:2232–5. doi: 10.1073/pnas.88.6.2232. [DOI] [PMC free article] [PubMed] [Google Scholar]
- 6.Volpe P, Alderson-Lang BH. Regulation of inositol 1,4,5-trisphosphate-induced Ca2+ release. II. Effect of cAMP-dependent protein kinase. Am J Physiol. 1990;258:C1086–91. doi: 10.1152/ajpcell.1990.258.6.C1086. [DOI] [PubMed] [Google Scholar]
- 7.Bird GS, Burgess GM, Putney JW., Jr Sulfhydryl reagents and cAMP-dependent kinase increase the sensitivity of the inositol 1,4,5-trisphosphate receptor in hepatocytes. J Biol Chem. 1993;268:17917–23. [PubMed] [Google Scholar]
- 8.Patterson RL, Boehning D, Snyder SH. Inositol 1,4,5-trisphosphate receptors as signal integrators. Annu Rev Biochem. 2004;73:437–65. doi: 10.1146/annurev.biochem.73.071403.161303. [DOI] [PubMed] [Google Scholar]
- 9.Futatsugi A, et al. IP3 receptor types 2 and 3 mediate exocrine secretion underlying energy metabolism. Science. 2005;309:2232–4. doi: 10.1126/science.1114110. [DOI] [PubMed] [Google Scholar]
- 10.Cruz LN, et al. Regulation of multidrug resistance-associated protein 2 by calcium signaling in mouse liver. Hepatology. 2010;52:327–37. doi: 10.1002/hep.23625. [DOI] [PMC free article] [PubMed] [Google Scholar]
- 11.Szado T, et al. Phosphorylation of inositol 1,4,5-trisphosphate receptors by protein kinase B/AKT inhibits Ca2+ release and apoptosis. Proc Natl Acad Sci U S A. 2008;105:2427–32. doi: 10.1073/pnas.0711324105. [DOI] [PMC free article] [PubMed] [Google Scholar]
- 12.Tovey SC, et al. Regulation of inositol 1,4,5-trisphosphate receptors by cAMP independent of cAMP-dependent protein kinase. J Biol Chem. 2010;285:12979–89. doi: 10.1074/jbc.M109.096016. [DOI] [PMC free article] [PubMed] [Google Scholar]
- 13.Wakelam MJ, Murphy GJ, Hruby VJ, Houslay MD. Activation of two signal-transduction systems in hepatocytes by glucagon. Nature. 1986;323:68–71. doi: 10.1038/323068a0. [DOI] [PubMed] [Google Scholar]
- 14.Yoon J, et al. Control of hepatic gluconeogenesis through the transcriptional coactivator PGC-1. Nature. 2001;413:131–138. doi: 10.1038/35093050. [DOI] [PubMed] [Google Scholar]
- 15.Herzig S, et al. CREB Regulates Hepatic Gluconeogenesis via the Co-activator PGC-1. Nature. 2001;413:179–183. doi: 10.1038/35093131. [DOI] [PubMed] [Google Scholar]
- 16.Wu Z, et al. Transducer of regulated CREB-binding proteins (TORCs) induce PGC-1alpha transcription and mitochondrial biogenesis in muscle cells. Proc Natl Acad Sci U S A. 2006;103:14379–84. doi: 10.1073/pnas.0606714103. [DOI] [PMC free article] [PubMed] [Google Scholar]
- 17.Dentin R, et al. Insulin modulates gluconeogenesis by inhibition of the coactivator TORC2. Nature. 2007;449:366–9. doi: 10.1038/nature06128. [DOI] [PubMed] [Google Scholar]
- 18.Wang Y, Vera L, Fischer WH, Montminy M. The CREB coactivator CRTC2 links hepatic ER stress and fasting gluconeogenesis. Nature. 2009;460:534–7. doi: 10.1038/nature08111. [DOI] [PMC free article] [PubMed] [Google Scholar]
- 19.Jansson D, et al. Glucose controls CREB activity in islet cells via regulated phosphorylation of TORC2. Proc Natl Acad Sci U S A. 2008;105:10161–6. doi: 10.1073/pnas.0800796105. [DOI] [PMC free article] [PubMed] [Google Scholar]
- 20.Liu Y, et al. A fasting inducible switch modulates gluconeogenesis via activator/coactivator exchange. Nature. 2008;456:269–73. doi: 10.1038/nature07349. [DOI] [PMC free article] [PubMed] [Google Scholar]
- 21.Wang B, et al. A hormone-dependent module regulating energy balance. Cell. 2011;145:596–606. doi: 10.1016/j.cell.2011.04.013. [DOI] [PMC free article] [PubMed] [Google Scholar]
Associated Data
This section collects any data citations, data availability statements, or supplementary materials included in this article.


