Abstract
Scavenger receptor A (SR-A) is a key transmembrane receptor in the endocytosis of lipids and contributes to the pathogenesis of atherosclerosis. To assess its role in hyperlipidemic chronic kidney disease, wild-type and SR-A-deficient (knockout) mice underwent uninephrectomy followed by either normal or high-fat diet. After 16 weeks of diet intervention, hyperlipidemic wild-type mice presented characteristic features of progressive nephropathy: albuminuria, renal fibrosis, and overexpression of transforming growth factor (TGF)-β1/Smad. These changes were markedly diminished in hyperlipidemic knockout mice and attributed to reduced renal lipid retention, oxidative stress, and CD11c+ cell infiltration. In vitro, overexpression of SR-A augmented monocyte chemoattractant protein-1 release and TGF-β1/Smad activation in HK-2 cells exposed to oxidized low-density lipoprotein. SR-A knockdown prevented lipid-induced cell injury. Moreover, wild-type to knockout bone marrow transplantation resulted in renal fibrosis in uninephrectomized mice following 16 weeks of the high-fat diet. In contrast, knockout to wild-type bone marrow transplantation led to markedly reduced albuminuria, CD11c+ cell infiltration, and renal fibrosis compared to wild-type to SR-A knockout or wild-type to wild-type bone marrow transplanted mice, without difference in plasma lipid levels. Thus, SR-A on circulating leukocytes rather than resident renal cells predominantly mediates lipid-induced kidney injury.
Keywords: CD11c-positive cell, hyperlipidemia, oxidative stress, scavenger receptor A, transforming growth factor-β1
Evidence has been increasingly provided that lipid accumulation in kidney contributes to the progression of chronic kidney disease (CKD).1, 2 Receptor-mediated lipid uptake is the crucial step for lipid retention in the kidney, while this is also caused by impaired cholesterol synthesis and inhibited cholesterol efflux via adenosine triphosphate-binding cassette transporter 1.3, 4, 5, 6, 7, 8, 9 Several lines of data have indicated that the specific transmembrane receptors, including scavenger receptor A (SR-A), CD36, lectin-like oxidized low-density lipoprotein receptor-1, and C-X-C motif ligand 16, recognize oxidative low-density lipoprotein (ox-LDL) based on atherogenesis data.5, 6, 7, 8, 9 Among these receptors, SR-A has been identified on macrophages, endothelial cells, renal mesangial cells, smooth muscle cells, dendritic cells, and renal tubular epithelial cells.6, 10, 11, 12, 13 Unlike other lipoprotein receptors, SR-A is not regulated via negative feedback by cytoplasmic cholesterol, and hence plays a key role in the formation of foam cells.12, 14
Previous studies have shown that deletion of SR-A decreased aortic wall plaque formation in mice fed with high-fat diet and had no impact on the plasma lipid level.5, 11, 13 SR-A mediates endocytosis of ox-LDL, and activates intracellular signaling pathways that contribute to the atherosclerosis. Its mechanistic role in atherosclerosis elicited by hyperlipidemia may suggest possible mechanisms underlying the development of lipid-induced renal injury and enhance the design of novel therapeutic strategies against the progression of CKD. However, the effect of SR-A deficiency on the progressive CKD of hyperlipidemia and the underlying mechanism by which SR-A modulates renal fibrosis remains poorly understood.
Here, we use SR-A deficient (SR-A−/−) mice to test the hypothesis that its deficiency will protect kidney from lipid nephrotoxicity in progressive renal fibrosis. We identified SR-A as a key regulator in the renal lipid retention, CD11c+ cell recruitment, and oxidative stress in uninephrectomized mice following 16 weeks of high-fat diet. Using genetic approaches, we validated SR-A as a critical modulator of transforming growth factor (TGF)-β1/Smad signaling and monocyte chemoattractant protein-1 (MCP-1) in HK-2 cells exposed to ox-LDL in vitro. In bone marrow (BM) chimeric mice, SR-A−/− to wild-type (WT) bone marrow transplantation (BMT) led to reduced albuminuria, renal CD11c+ cell filtration, and kidney fibrosis independent of plasma lipid control.
RESULTS
SR-A deficiency ameliorated albuminuria and renal fibrosis in uninephrectomized mice fed with high-fat diet
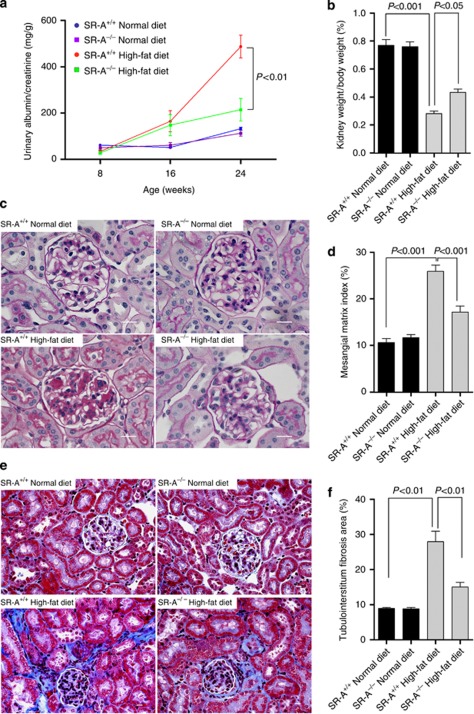
All SR-A−/− mice were verified by Southern blot, western blot, and immunohistochemistry (Supplementary Figure S1a–c online). No significant abnormalities in body weight, morphology, renal histology, and plasma biochemical parameters were found as long as 24 weeks of age between WT and SR-A−/− mice (Figure 1c and e and Table 1). To evaluate the effect of SR-A on the hyperlipidemic renal disease, WT and SR-A−/− mice at 8 weeks of age underwent uninephrectomy, followed by either normal or high-fat diet for 16 weeks, following the way as described.15 Both WT and SR-A−/− mice that consumed high-fat diet showed markedly increased body weights and systemic lipid levels when compared with normal-diet mice (Table 1). There was no difference in plasma lipids between WT and SR-A−/− mice in the conditions of either normal or high-fat diet, indicating that SR-A did not affect the systemic lipid levels.
Figure 1.
Albuminuria and renal histology in uninephrectomized mice at 16 weeks of dietary intervention. (a) Urinary albumin/creatinine tested at time points indicated. (b) Kidney weight, normalized for body weight. (c) Representative histological photomicrograph of glomeruli by periodic acid–Schiff staining. Scale bar=19 μm. (d) Bar graph summarizing the mesangial matrix index. (e) Representative histological photomicrograph of kidney by Masson's trichrome staining. Scale bar=19 μm. (f) Bar graph summarizing the percentage of tubulointerstitial fibrosis area. Each bar represented the mean±s.e.m., n=6–12 each group. SR-A, scavenger receptor A; SR-A+/+, SR-A wild-type mice; SR-A−/−, SR-A deficiency mice.
Table 1. Metabolic data of four groups at 16 weeks of experiment.
|
Normal diet |
High-fat diet |
|||
|---|---|---|---|---|
| Groups | WT | SR-A−/− | WT | SR-A−/− |
| Body weight (g) | 34.6±1.5 | 35.2±1.6 | 55.2±1.8a | 54.5±1.7 |
| BP (mm Hg) | 92.0±11.2 | 91.1±8.9 | 94.2±10.3 | 93.2±10.7 |
| Plasma Cr (μmol/l) | 67.5±4.3 | 66.2±4.8 | 106.0±7.8a | 82.4±6.5b |
| Plasma triglyceride (mmol/l) | 1.31±0.31 | 1.24±0.44 | 2.58±0.53a | 2.45±0.46 |
| Plasma cholesterol (mmol/l) | 2.35±0.43 | 2.42±0.36 | 6.73±0.62a | 6.36±0.53 |
| Plasma MCP-1 (μg/l) | 125.1±6.7 | 127.0±10.3 | 294.0±11.2a | 144.0±10.2b |
| Plasma IL-6 (μg/l) | 109.43±6.3 | 111.28±9.5 | 445.3±15.6a | 169.4±8.7b |
| Plasma TNF-α (μg/l) | 69.50±4.8 | 69.20±4.5 | 144.6±10.9a | 99.9±6.4b |
Abbreviations: BP, blood pressure; Cr, creatinine; IL-6, interleukin-6; MCP-1, monocyte chemoattractant protein-1; SR-A, scavenger receptor A; SR-A−/−, SR-A deficiency mice; TNF-α, tumor necrosis factor-α WT, SR-A wild-type mice.
P<0.05 versus WT mice fed with normal diet.
P<0.05 versus WT mice fed high-fat diet.
Data are means±s.e.m.; n=12 in each group.
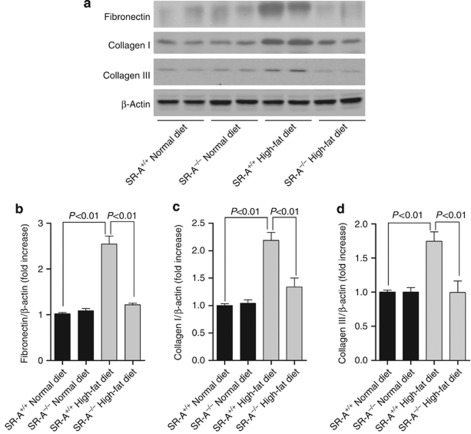
Consistent with the previous studies,1, 2, 16 our data showed that WT mice consuming high-fat diet developed progressive albuminuria; however, this was lower at 8 weeks, and significantly reduced at 16 weeks of dietary intervention in SR-A−/− mice (Figure 1a). In addition, high-fat diet resulted in markedly reduced kidney weight/body weight in WT mice but was mild in SR-A−/− mice (Figure 1b). Normal-diet WT and SR-A−/− mice did not show remarkably increased albuminuria (Figure 1a). Morphologically, diet-induced hyperlipidemia caused significant glomerular mesangial matrix accumulation and tubulointerstitial fibrosis, but no remarkable microvascular damage in kidney was observed under light microscope. In contrast, SR-A deficiency substantially reduced glomerular mesangial matrix index and tubulointerstitium fibrotic area compared with those of WT mice with hyperlipidemia (Figure 1c–f). In addition, persistent hyperlipidemia markedly increased the renal deposition of fibronectin, collagen I, and collagen III in WT mice but was mild in SR-A−/− mice (Figure 2a–d). Importantly, the improved renal outcome in SR-A−/− mice was determined to be independent of hyperlipidemia, as diet-induced high plasma levels of cholesterol and triglyceride were similar in both mice genotypes (Table 1).
Figure 2.
Renal extracellular matrix deposition in uninephrectomized mice at 16 weeks of dietary intervention. (a) Representative western blot analyses of fibronectin, collagen I, and collagen III in whole kidney lysate. Densitometric analysis of (b) fibronectin, (c) collagen I, and (d) collagen III in western blot. Each bar represented the mean±s.e.m., n=3 each group. β-Actin was used as loading control. SR-A, scavenger receptor A; SR-A+/+, SR-A wild-type mice; SR-A−/−, SR-A deficiency mice.
SR-A deficiency reduced renal lipid accumulation and oxidative stress in uninephrectomized mice fed with high-fat diet
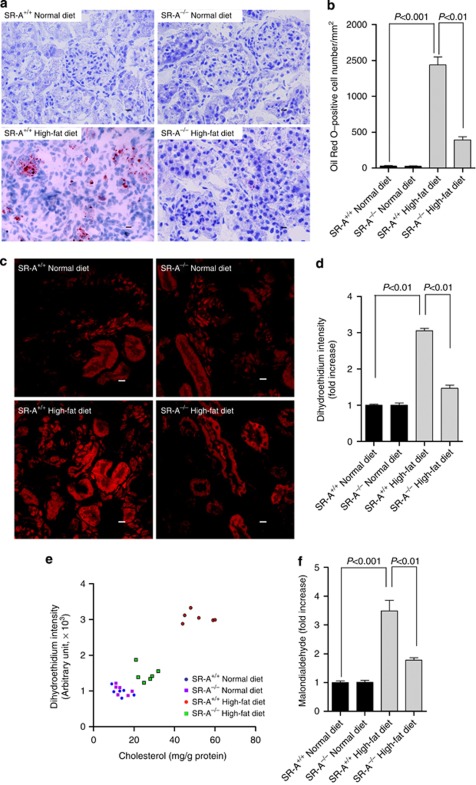
Using Oil Red O staining, we detected increased lipids retention in the kidneys of high-fat diet mice. SR-A deficiency markedly reduced the renal lipid deposition compared with WT mice consuming high-fat diet (Figure 3a and b), indicating that the ameliorated kidney fibrosis in SR-A−/− mice was correlated with lower renal lipid deposition. Although the initial events involved in lipid-mediated renal damage are unclear, oxidative stress is thought to be especially important.2, 17 We revealed that mice consuming high-fat diet showed a threefold increase in renal reactive oxidative species (ROS), which was reduced in SR-A−/− mice (Figure 3c and d). To link the decreased ROS production to lower lipid deposition in the kidneys, renal ROS and the cholesterol content were quantified in the mice described above. Our data showed that the mice with higher renal cholesterol content correlated with higher ROS production in the kidneys; in SR-A−/− mice, renal ROS decreased with lower content of cholesterol (Figure 3e). Also, mice consuming high-fat diet showed a 3.5-fold increase in renal malondialdehyde, a biomarker for oxidative stress,18 which was significantly reduced in SR-A−/− mice (Figure 3f). Thus, these data suggested that SR-A deficiency decreased renal cholesterol deposition and, consequently, reduced oxidative stress in lipid-induced kidney injury.
Figure 3.
Renal lipid accumulation and oxidative stress in uninephrectomized mice at 16 weeks of dietary intervention. (a) Representative Oil Red O staining in the kidneys. Red, Oil Red O–positive cells; blue, hematoxylin counterstaining. Scale bar=19 μm. (b) Bar graph summarizing Oil Red–positive cells in the kidney. (c) Representative photomicrograph of super oxidative anion assessed by staining of dihydroethidium in the kidney. Scale bar=19 μm. (d) Bar graph summarizing dihydroethidium intensity in the kidney. (e) Correlation between dihydroethidium intensity and the renal cholesterol content in the kidney, n=24, r=0.9261, 95% confidence interval (CI) 0.8344–0.9679, P<0.01. (f) Malondialdehyde level in the kidney of mice at 16 weeks of experiment. Each bar represented the mean±s.e.m., n=6 each group. SR-A, scavenger receptor A; SR-A+/+, SR-A wild-type mice; SR-A−/−, SR-A deficiency mice.
SR-A deficiency decreased renal CD11c+ cell filtration and inflammation in uninephrectomized mice fed with high-fat diet
One detrimental effect of oxidative stress is to cause inflammation in the progressive kidney disease.2, 4, 8 To test the effect of SR-A deficiency on inflammatory profile in response to hyperlipidemia, mice plasma inflammatory markers were examined. There was a twofold increase in plasma tumor necrosis factor (TNF)-α and a fourfold increase in interleukin (IL)-6 in WT mice consuming high-fat diet compared with those of normal diet; in contrast, SR-A deficiency markedly reduced plasma levels of TNF-α and IL-6 (Table 1).
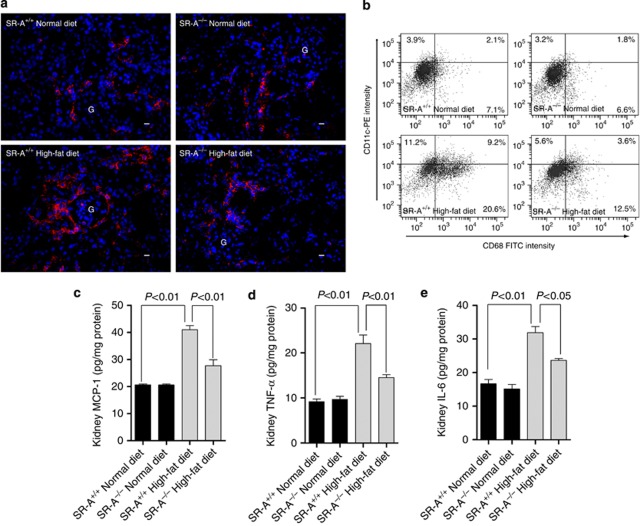
Recent data showed that a specific subset of CD11c+ cells are targets for free fatty acid–mediated increases in expression of proinflammatory cytokine.19 We revealed that mice consuming high-fat diet showed significantly increased CD11c+ cells number in glomeruli and tubulointerstitium, which was substantially reduced in SR-A−/− mice (Figure 4a). Using a flow cytometric analysis, we further found that both CD11c+/CD68+ and CD11c−/CD68+ cells increased in the kidneys of mice fed with high-fat diet; however, SR-A−/− mice showed 60% reduction of CD11c+/CD68+ and 39.3% reduction of CD11c−/CD68+ cells compared with that of WT mice (Figure 4b). The difference in the reduced levels of the two subtype cells in ameliorated kidney implicated that CD11c+ macrophages are more important than resident macrophages in lipid-induced kidney injury. In addition, SR-A deficiency markedly reduced TNF-α and IL-6 levels in kidneys compared with that of WT mice in groups of high-fat diet (Figure 4c–e).
Figure 4.
Filtration of CD11c+ cells and the proinflammatory markers in the kidney of uninephrectomized mice at 16 weeks of dietary intervention. (a) Representative immunofluorescent staining of CD11c-positive cells in the kidney. Red, CD11c+ cells; blue, 4,6-diamidino-2-phenylindole (DAPI)-stained nuclei; scale bar=19 μm; G, glomeruli. (b) Representative flow cytometry analysis of CD11c+, CD68+, and CD11c+/CD68+ cells in the kidneys. The number in each field represented the mean percentage of the cell number from at least three independent experiments. FITC, fluorescein isothiocyanate. (c) Renal cytosolic MCP-1, (d) TNF-α, and (e) IL-6 assayed by enzyme-linked immunosorbent assay. Each bar represented the mean±s.e.m. for three independent experiments. IL-6, interleukin-6; MCP-1, monocyte chemoattractant protein-1; SR-A, scavenger receptor A; SR-A+/+, SR-A wild-type mice; SR-A−/−, SR-A deficiency mice; TNF-α, tumor necrosis factor-α.
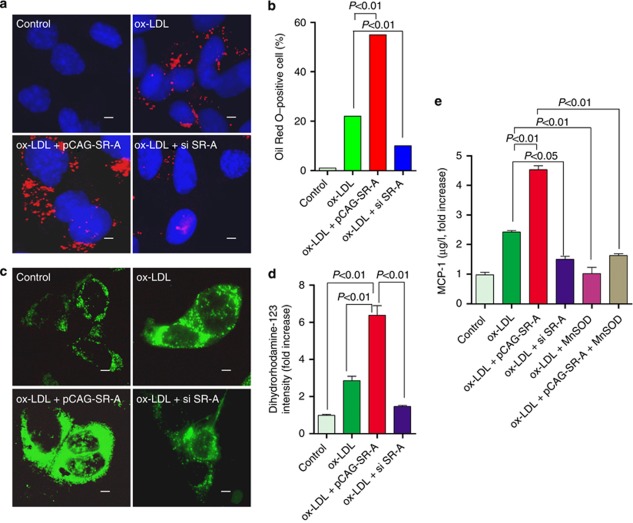
Several lines of study demonstrated that MCP-1 is a key mediator for inflammation.20, 21, 22 Our data showed that WT mice consuming high-fat diet exhibited substantially increased MCP-1 in plasma and kidney, and this increase was suppressed in SR-A−/− mice (Table 1 and Figure 4c). To better understand the effect of SR-A on MCP-1 expression in high-fat diet mice, HK-2 cells, an immortalized proximal tubular epithelial cell line, were incubated with ox-LDL after forced expression or knockdown of SR-A. Consistent with these findings in vivo, forced expression of SR-A increased the lipids retention in HK-2 cells, and augmented the ox-LDL-stimulated ROS generation and MCP-1 expression; in contrast, knockdown of SR-A protected HK-2 cells from ox-LDL-stress (Figure 5a–e). To verify that the increased expression of MCP-1 was caused by ox-LDL-induced ROS, we examined MCP-1 in supernatant of cultured HK-2 cells pretreated with antioxidant manganese superoxide dismutase (MnSOD). Our data clearly showed that inhibition of ox-LDL-stimulated ROS markedly decreased the MCP-1 production in the condition of either normal or overexpression of SR-A (Figure 5e).
Figure 5.
Effects of SR-A on lipid uptake, oxidative stress, and MCP-1 expression in HK-2 cells exposed to ox-LDL. (a) Representative Oil Red O staining of HK-2 cells incubated with ox-LDL (10 μmol/l). Red, Oil Red O–positive cells; blue, 4,6-diamidino-2-phenylindole (DAPI) counterstaining; scale bar=1 μm. (b) Bar graph summarizing the percentage of Oil Red O–positive cells (300 cells were counted in three independent experiments). (c) Representative cellular image of ROS stained by dihydrorhodamine-123 in HK-2 cells at 24 h after incubation with ox-LDL (10 μmol/l). Scale bar=1 μm. (d) Bar graph summarizing ROS in HK-2 cells. Each bar represented the mean±s.e.m. for three independent experiments. (e) MCP-1 levels in the supernatant analyzed by enzyme-linked immunosorbent assay. Each bar represented the mean±s.e.m. for three independent experiments. MCP-1, monocyte chemoattractant protein-1; MnSOD, manganese superoxide dismutase; ox-LDL, oxidative low-density lipoprotein; ROS, reactive oxygen species; si, small interfering; SR-A, scavenger receptor A.
SR-A modulated TGF-β1/Smad signaling in tubular cells exposed to ox-LDL
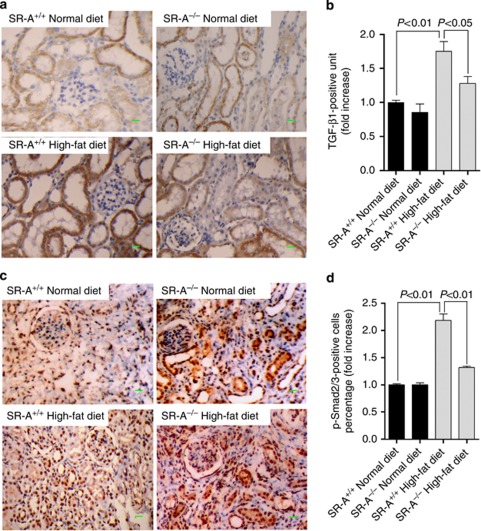
Previous evidence has demonstrated a link between inflammatory environment and activation of TGF-β1/Smad signaling that contributes to pathological decline.23, 24, 25, 26 The current study showed that renal TGF-β1 was markedly increased in WT mice but was mild in SR-A−/− mice fed with high-fat diet (Figure 6a and b). Upregulated TGF-β1 was confined largely to the area where fibrosis was evident. Coincident with the increased presence of TGF-β1, the percentage of phosphorylated Smad2/3 (p-Smad2/3)–positive nuclei was markedly increased in the kidneys of WT mice at 16 weeks of high-fat diet, and this increase was substantially reduced in SR-A−/− mice (Figure 6c and d). These data demonstrated that ameliorated renal fibrosis in hyperlipidemic SR-A−/− mice related to the inhibited renal TGF-β1/Smad signaling.
Figure 6.
TGF-β1/p-Smad2/3 expression in the kidney of uninephrectomized mice at 16 weeks of dietary intervention. Representative immunohistochemistry image of (a) TGF-β1 and (c) p-Smad2/3 in the kidney. Quantification of (b) TGF-β1 and (d) phosphorylated Smad2/3 (p-Smad2/3) expressed in kidneys. Scale bar=19 μm. Each bar represents the mean±s.e.m. for at least six mice. SR-A, scavenger receptor A; SR-A+/+, SR-A wild-type mice; SR-A−/−, SR-A deficiency mice; TGF-β1, transforming growth factor-β1.
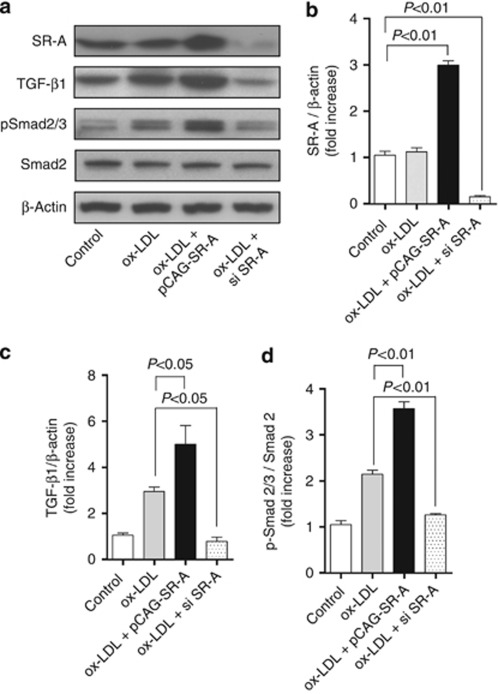
To further address that the renoprotective effect of SR-A deficiency is associated with the inhibited TGF-β1/Smad signaling, we stimulated HK-2 cells with ox-LDL after forced expression or knockdown of SR-A. As shown in Figure 7a–d, forced expressing SR-A enhanced TGF-β1 expression and Smad2/3 activation. Conversely, knockdown of SR-A inhibited TGF-β1 expression and Smad2/3 activation in HK-2 cells exposed to ox-LDL.
Figure 7.
Effect of SR-A on TGF-β1/Smad signaling in HK-2 cells exposed to ox-LDL. (a) Representative western blot analyses of SR-A, TGF-β1, Smad2, and phospho-Smad2/3 in HK-2 cells incubated with ox-LDL (10 μmol/l) for 24 h. Densitometric analysis of (b) SR-A, (c) TGF-β1, and (d) phosphorylated Smad2/3 (p-Smad2/3) in a. Each bar represents the mean±s.e.m. for at least three mice. β-Actin was used as a loading control. ox-LDL, oxidative low-density lipoprotein; si, small interfering; SR-A, scavenger receptor A; TGF-β1, transforming growth factor-β1.
BM-derived leukocytes from SR-A−/− mice decreased albuminuria and renal fibrosis in uninephrectomized mice fed with high-fat diet
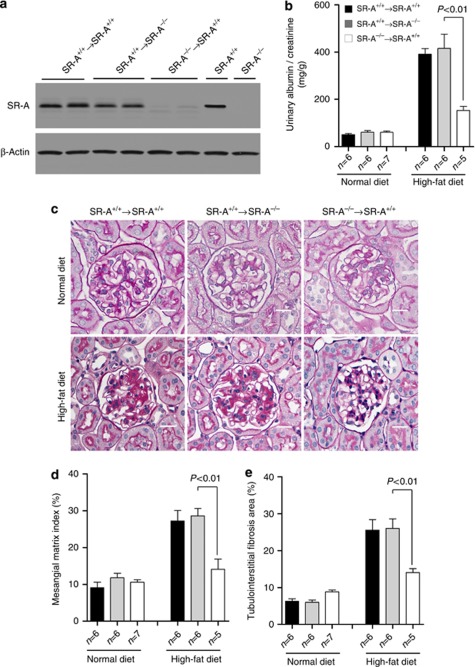
To determine the contribution of SR-A from BM-derived leukocytes to lipid-induced kidney injury, we performed reciprocal BMT between WT and SR-A−/− mice, using both as donors and recipients of BMT. Neither SR-A deficiency nor BMT affected the total number of peripheral blood erythrocyte and leukocyte counts or leukocyte differential (Table 2). All mice that did not receive BMT died within 3 weeks of the transplant. At 4 weeks after BMT, peripheral blood counts returned to normal and the mice underwent uninephrectomy, and were then randomized to either normal or high-fat diet for 16 weeks. Circulating leukocytes isolated from WT to WT and WT to SR-A−/− BMT mice showed similar levels of SR-A expression compared with those of leukocytes from untransplanted WT mice, indicating successful BM replenishment (Figure 8a). Interestingly, SR-A−/− to WT BMT mice showed less albumin/creatinine ratio and decreased glomerular mesangial matrix index and tubulointerstitial fibrosis area compared with those of WT to WT or WT to SR-A−/− BMT mice (Figure 8b–e). Indeed, albumin/creatinine ratio, mesangial matrix index, and tubulointerstitial fibrosis area in WT to SR-A−/− BMT mice were comparable to those of WT to WT BMT mice.
Table 2. Peripheral blood counts on erythrocyte and leukocyte in mice at 4 weeks of BMT.
|
Non-BMT mice |
BMT mice |
||||
|---|---|---|---|---|---|
| Groups | WT (n=12) | SR-A−/− (n=12) | WT to WT (n=12) | WT to SR-A−/− (n=12) | SR-A−/− to WT (n=12) |
| RBC number ( × 104/mm3) | 1115±73.5 | 1126±96.6 | 1184±110.8 | 1152±100.3 | 1239±121.4 |
| Leukocyte number ( × 102/mm3) | 21±2.01 | 20±2.14 | 21±1.47 | 20±1.68 | 22±1.97 |
| Lymphocyte (%) | 86.5±4.91 | 86.2±6.13 | 85.6±5.23 | 87.5±7.06 | 87.1±4.64 |
| Monocyte (%) | 3.4±0.38 | 3.5±0.26 | 4.0±0.25 | 3.5±0.65 | 4.1±0.32 |
| Neutrophil (%) | 9.4±0.65 | 9.5±1.12 | 9.7±0.95 | 9.8±1.64 | 9.8±1.79 |
Abbreviations: BMT, bone marrow transplantation; RBC, red blood cell number; SR-A, scavenger receptor A; SR-A−/−, SR-A deficiency mice; WT, SR-A wild-type mice.
Data are means±s.e.m.
Figure 8.
Albuminuria and renal histology in BMT uninephrectomized mice at 16 weeks of dietary intervention. (a) Representative western blot analyses of SR-A expression in circulating leukocytes. (b) Urinary albumin/creatinine. (c) Representative histological photomicrograph of kidney stained for glomerular mesangial matrix (periodic acid–Schiff stain). Scale bar=19 μm. (d) Bar graph summarizing the mesangial matrix index (MMI) in periodic acid–Schiff–stained section. (e) Bar graph summarizing the percentage of tubulointerstitial fibrosis area in trichrome-stained section. Each bar represents the mean±s.e.m. for at least six mice. BMT, bone marrow transplantation; SR-A, scavenger receptor A; SR-A+/+, SR-A wild-type mice; SR-A−/−, SR-A deficiency mice.
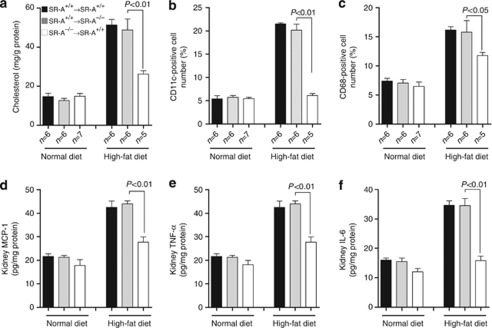
The role of BM-derived leukocyte SR-A in lipid-induced kidney injury was further evaluated at 16 weeks of high-fat diet in BMT mice. Renal content of cholesterol within kidney was markedly reduced in SR-A−/− to WT BMT mice compared with that of WT to WT or WT to SR-A−/− mice. Interestingly, the percentage of renal CD11c+ cells and CD68 macrophages in SR-A−/− to WT BMT mice was substantially less than those of WT to WT or WT to SR-A−/− BMT mice (Figure 9b and c). In addition, there were less MCP-1, TNF-α, and IL-6 expressed in kidney and that in plasma of SR-A−/− to WT BMT mice compared with those of WT to SR-A−/− or WT to WT BMT mice (Figure 9d–f and Table 3). These findings indicate that SR-A in circulating leukocytes rather than in renal resident cells is the predominant mediator in lipid-induced kidney injury.
Figure 9.
Renal lipid accumulation, leukocyte filtration, and cytokine expression in BMT uninephrectomized mice at 16 weeks of dietary intervention. (a) Renal cholesterol content in the kidney. Percentage of (b) CD11c+ and (c) CD68+ cells in the kidneys analyzed by flow cytometry. (d) Renal cytosolic MCP-1, (e) TNF-α, and (f) IL-6 assayed by enzyme-linked immunosorbent assay. Each bar represented the mean±s.e.m. for at least six mice. BMT, bone marrow transplantation; IL-6, interleukin-6; MCP-1, monocyte chemoattractant protein-1; SR-A, scavenger receptor A; SR-A+/+, SR-A wild-type mice; SR-A−/−, SR-A deficiency mice; TNF-α, tumor necrosis factor-α.
Table 3. Metabolic data of the BMT mice at 16 weeks of dietary intervention.
|
Normal diet |
High-fat diet |
|||||
|---|---|---|---|---|---|---|
| Groups | WT to WT (n=6) | WT to SR-A−/− (n=6) | SR-A −/− to WT (n=7) | WT to WT (n=6) | WT to SR-A−/− (n=6) | SR-A −/− to WT (n=5) |
| Body weight (g) | 33.4±3.5 | 34.2±2.5 | 34.1±2.5 | 54.9±3.6a | 55.5±3.4b | 55.3±4.7c |
| BP (mm Hg) | 92.5±10.3 | 92.7±9.3 | 92.0±11.5 | 92.2±10.7 | 94.2±10.8 | 93.1±8.9 |
| Plasma Cr (mol/l) | 62.5±5.3 | 66.5±6.4 | 63.5±4.7 | 110.4±6.5a | 106.0±7.8b | 96.2±8.5c,d,e |
| Plasma triglyceride (mmol/l) | 1.33±0.56 | 1.41±0.61 | 1.35±0.36 | 2.55±0.41a | 2.58±0.63b | 2.54±0.94c |
| Plasma cholesterol (mmol/l) | 2.45±0.48 | 2.39±0.63 | 2.49±0.46 | 6.76±0.93a | 6.79±0.69b | 6.72±0.76c |
| Plasma MCP-1 (μg/l) | 129.1±9.2 | 126.1±8.7 | 128.9±9.7 | 279.0±10.2a | 264.0±11.2b | 167.0±10.3c,d,e |
| Plasma IL-6 (μg/l) | 112.5±6.7 | 108.3±6.9 | 110.4±6.3 | 469.9±8.7a | 439.1±14.6b | 211.2±9.5c,d,e |
| Plasma TNF-α (μg/l) | 73.5±6.9 | 69.0±7.8 | 68.5±7.1 | 159.9±6.8a | 174.6±10.1b | 99.20±14.6c,d,e |
Abbreviations: BMT, bone marrow transplantation; BP, blood pressure; Cr, creatinine; IL-6, interleukin-6; MCP-1, monocyte chemoattractant protein-1; SR-A, scavenger receptor A; SR-A−/−, SR-A deficiency mice; TNF-α, tumor necrosis factor-α WT, SR-A wild-type mice.
P<0.05 versus WT to WT BMT mice fed with normal diet.
P<0.05 versus WT to SR-A−/− BMT mice fed with normal diet.
P<0.05 versus SR-A−/− to WT BMT mice fed with normal diet.
P<0.05 versus WT to WT BMT mice fed with high fat diet.
P<0.05 versus WT to SR-A−/− BMT mice fed with high-fat diet.
Data are means±s.e.m.
DISCUSSION
An emerging body of evidence suggests that hyperlipidemia is not only a risk factor for CKD progression, but also an independent inducer for renal dysfunction.1, 2 We now document in this study the profibrotic effects of SR-A on progressive renal fibrosis elicited by hyperlipidemia in vivo and in vitro. Our results indicate that SR-A is a key molecule to modulate the oxidative stress, inflammation, and fibrosis in the pathogenesis of hyperlipidemic CKD. Our finding suggests that SR-A deficiency protects mice from progressive nephropathy of hyperlipidemia through inhibiting of CD11c+ cell recruitment and TGF-β1/Smad pathway. Importantly, we validate the effectiveness of in vivo reconstitution with SR-A−/− mice BM-derived leukocytes in lipid-induced nephropathy.
There is increasing evidence that ROS and other reactive species are directly involved in redox signaling pathways that promote inflammation. Our integrated in vivo and in vitro experimental design identified SR-A as a key modulator for tubular cells to uptake lipid. Consistent with previous studies,8, 18, 27, 28 our finding revealed that SR-A modulated ox-LDL-induced ROS generation in tubular cells, consequently stimulated the expression of MCP-1, which is a key mediator to recruit or activate inflammatory cells, and was also important in generating proinflammatory cytokine.20, 21, 22
Another major finding of this study is that CD11c+ cell–specific SR-A is a primary inducer of renal injury in progressive nephropathy of hyperlipidemia. Emerging bodies of evidence have demonstrated a close association between the intensity of inflammation and the severity of renal fibrosis.8, 14, 29, 30 Indeed, the interstitial macrophages correlate closely with fibrosis.6, 15, 31, 32 Macrophages are phenotypically and functionally heterogeneous, potentially able to promote inflammation and fibrosis or to prevent it via scavenging activities.10, 30 Recently, a specific subset of CD11c+ macrophages was shown to be recruited to obese adipose and muscle tissue, and produced high levels of proinflammatory cytokines that were linked to the tissue injury. CD11c+ cell ablation led to a marked decrease in inflammatory markers locally and systemically.19 Indeed, our data clearly showed that SR-A−/− mice fed with high-fat diet demonstrated marked decrease in CD11c+ cells filtration and inflammatory markers expression in both kidneys and plasma. In chimeric study, SR-A−/− to WT BMT led to reduced renal CD11c+ as well as CD68+ cells filtration, inflammatory cytokines expression, albuminuria, and renal fibrosis at 16 weeks of high-fat diet compared with those of WT to WT or WT to SR-A−/− BMT mice. These findings indicate that SR-A on circulating leukocytes, such as CD11c+, rather than on resident cells is the predominant mediator of lipid-induced kidney injury. Although the markedly increased MCP-1 may be the key molecule to recruit CD11c+ in kidney, the precise mechanism by which SR-A modulates CD11c+ function is necessary to determine in the future study.
In addition to the oxidative stress and inflammatory profile, we revealed that SR-A modulates TGF-β1/Smad signaling. A wide array of studies has established that TGF-β1 modulates renal fibrosis through its downstream Smad signaling.23, 33, 34 Indeed, our finding showed that deletion of SR-A significantly inhibited TGF-β1expression and thereby diminished phosphorylated Smad2/3 in the fibrotic kidneys. Furthermore, the current study provided the first evidence that forced expression of SR-A directly activates TGF-β1/Smad signaling in HK-2 cells exposed to ox-LDL in vitro. Therefore, inhibition of TGF-β1/Smad pathway in uninephrectomized SR-A−/− mice with hyperlipidemia may be a mechanism whereby SR-A promotes renal fibrosis. These findings implicate that SR-A/TGF-β1/Smad pathway is a novel target in the treatment of renal fibrosis on hyperlipidemic mice model.
Taken together, our data allow us to establish that SR-A in tubular epithelial cells initiates lipid-induced oxidative stress and MCP-1 release, which leads to more circulating leukocytes recruited and promotes the renal fibrosis. Importantly, SR-A on circulating leukocytes rather than renal resident cells predominantly mediates lipid-induced kidney injury. These findings provide new insights into the role of SR-A in hyperlipidemic kidney injury and open a window of opportunity for a novel therapeutic intervention for the progression of CKD.
MATERIALS AND METHODS
Antibodies, plasmids, and other reagents
The antibodies and their sources are as follows: monoclonal anti-mouse CD11c and polyclonal anti-mouse SR-A were from BD Biosciences (Bedford, MA); monoclonal anti-mouse fibronectin, collagen I and III, TGF-β1, and polyclonal anti-mouse phosphoserine Smad2/3 and Smad2 were from Santa Cruz (Santa Cruz, CA); monoclonal anti-mouse β-actin was from Sigma-Aldrich (Buchs SG, Switzerland); and monoclonal anti-human TGF-β1, polyclonal anti-human phosphoserine Smad2/3, Smad2, SR-A, and monoclonal anti-mouse CD68 were from Abcam (Cambridge, MA).
SR-A small interfering RNA (siRNA; sc-44116) and nonspecific siRNA was purchased from Santa Cruz. pNVL3-MnSOD plasmid35 was a kind gift from Dr Yewei Ma (Baylor College of Medicine, Houston, TX). The 3′-untranslated region of the Homo sapiens macrophage scavenger receptor 1 (MSR1) gene (NM_138715) was amplified from HK-2 genomic DNA by PCR using the HotMaster Taq DNA polymerase (5 PRIME, Gaithersburg, MD), with the following primers: 5′-CATCAGGGATCCATGGAGCAGTGGGATCACTTTC-3′ (forward) and 5′-CATCAGGTTTAAACTTATAAAGTGCAAGTGACTCCAG-3′ (reverse). The 3763-bp PCR product was cloned between the PmeI and BamHI site of the pCAG-GFP vector (Addgene plasmid 16664), to generate pCAG-SR-A.
Ox-LDL was a kind gift from Dr Jizhong Chen36 (Baylor College of Medicine). Dihydrorhodamine-123 and dihydroethidium were purchased from Invitrogen (Carlsbad, CA); Creatinine Companion kit and urine albumin ELISA kit were purchased from Exocell (Philadelphia, PA); malondialdehyde TBARS Assay Kit was purchased from Cell Biolabs (San Diego, CA); RNeasy kit was purchased from Qiagen (Valencia, CA); MCP-1, TNF-α, and IL-6 ELISA kits were purchased from Phoenix Pharmaceuticals (Burlingame, CA); cholesterol CII kit and L-type triglyceride H kit were purchased from Wako Chemicals (Richmond, VA). All other reagents were purchased from Sigma-Aldrich unless otherwise noted.
Animal studies
SRA−/− mice and their wild-type control have been described elsewhere.13 To establish a lipid-induced kidney injury model, ∼20 g, male, 8-week-old WT and SRA−/− mice underwent uninephrectomy, and were then randomized into four groups: group 1: WT, normal diet (standard chow containing 270 mg cholesterol per kg); group 2: SR-A−/−, normal diet; group 3: WT, high-fat diet (standard chow supplemented with 10% saturation oil and 1% cholesterol);15, 37 and group 4: SR-A−/−, high-fat diet; 12 animals in each group. Following 16 weeks of diet intervention, blood and kidneys were harvested for next experiment. All animal studies were carried out with the review and approval of the animal care and use committee of Sun Yat-sen University and Baylor College of Medicine.
Blood biochemical components and blood pressure analysis
Plasma creatinine, MCP-1, TNF-α, IL-6, cholesterol, and triglyceride were measured using the kits described above according to the manufacturer's protocol. Systolic blood pressure was measured through a tail-cuff apparatus (AD Instruments, Bella Vista, Australia) in conscious mice. Systolic blood pressure values were derived from an average of five measurements per animal.
Morphometric studies
With periodic acid–Schiff–stained sections, light microscopic views of 40 consecutive glomerular cross-sections per mouse were scanned into a computer. Glomerular and mesangial matrix area were quantified in a blinded fashion using an image analysis system (NIS Elements, Nikon, Sendai, Japan). Mesangial matrix index was calculated as the ratio of mesangial area to tuft area × 100 (% area). The percentage of tubulointerstitial fibrosis area was determined on Masson's trichrome-stained sections using a computer-aided manipulator program as described above. In all, 20 fields of tubulointerstitial area under low magnification ( × 200) per mouse were scanned to analyze the fibrosis area.
Oil Red O staining
Frozen sections were stained by Oil Red O and quantified as described with modification.38 Briefly, Oil Red O–positive cells were counted in at least 20 high-power ( × 400) fields with a micro square scale plate (0.0625 mm2) arranged in ocular lens. The number of Oil Red O–positive cells in kidney was represented as cells/mm2.
Immunohistochemistry and immunoblot analysis
Association of fibrosis protein was assessed by western blot and immunohistochemistry as described previously.39, 40
Lipid extraction and lipid peroxidation determination
Total lipid was extracted from kidneys by the method of Bligh and Dyer.41 Lipoperoxides in renal tissue were determined by measurement of malondiadehyde–thiobarbituric acid using a kit described above according to the manufacturer's protocol.
Determination of ROS
Distribution of superoxide anion in kidney was stained by dihydroethidium (5 μmol/l) on frozen sections and the intensity was analyzed at 585 nm with a confocal microscopy. Quantification of superoxide anion in HK-2 cells was analyzed on the coverslips stained with dihydrorhodamine-123 (5 μmol/l). Fluorescence of the dihydrorhodamine-123 oxidation product was measured with a multi-channel analyzer using 490 nm excitation and recording the fluorescence emission at the optimum (525±3 nm).
Cell culture and plasmid, siRNA transfection
HK-2 cells (human renal proximal tubular epithelial cells) were cultured as described.42 Cells were grown to confluence and serum-deprived for 48 h before experimental manipulation. All experiments were performed under serum-free conditions. Under these conditions, the cells remained viable in a nonproliferation state. Nonspecific siRNA, SR-A siRNA, pCAG-SR-A, and pNVL3-MnSOD plasmid were transfected into HK-2 cells using Lipofectamine 2000TM (Invitrogen) at a final concentration of 30 nmol/l.
Flow cytometry
Mice renal cells were prepared as described.43 The following primary monoclonal antibodies were used for labeling cell suspensions: monoclonal anti-CD11c (1:100), which recognizes the circulating cells, and monoclonal anti-CD68 (1:100), which recognize resident macrophages. Cells at a concentration of 5–10 × 106 /ml were incubated with primary antibody in Hank's balanced salt solution with 1% fetal calf serum (HBSS-FCS) at 4 °C for 45 min. After three washes in HBSS-FCS, cells were resuspended at the same concentration and incubated with fluorescein-conjugated second antibody (Invitrogen) with 1% bovine serum albumin for 30 min at 4 °C. The cells were washed twice in HBSS-FCS and finally suspended at ∼1 × 10⁶ cells/ml in protein-free HBSS for flow cytometry (BD Biosciences) analysis.
BMT protocol
Male WT C57BL/6 (The Jackson Laboratory, Sacramento, CA) and SR-A−/− mice, 8 weeks old, underwent total body lethal irradiation (9.5 Gy) to eliminate endogenous BM stem cells and circulating leukocytes. BM cells used for repopulation were extracted from the femur and tibia of 12 WT and 12 SR-A−/− mice. Irradiated mice were injected intravenously with 107 BM cells from either WT or SR-A−/− mice. At 4 weeks after BMT, blood and leukocyte counts returned to normal (Table 2). Therefore, uninephrectomized operation was performed 4 weeks after BMT. All irradiated mice that were not injected with transplanted BM cells died within 2 to 3 weeks after radiation.
Statistical analyses
Data obtained from this study were expressed as the mean±s.e.m. Statistical analyses were performed using one-way analysis of variance followed by Tukey's multiple comparison test with GraphPad Prism 5.0 (GraphPad Software, San Diego, CA) to determine the significance of differences in multiple comparisons. A P-value of <0.05 was considered statistically significant.
Acknowledgments
We are grateful to Dr Wenhua Ling and Dr Ming Xia (Public Health School, Sun Yat-sen University, Guangzhou, China) for the supply of SR-A knockout mice. We appreciate Dr Xueqing Yu (The First Affiliated Hospital, Sun Yat-sen University) and Dr Hiroshi Suzuki (Obihiro University of Agriculture and Veterinary Medicine, Obihiro, Japan) for technical support. This work was supported by grants from the National Natural Science Foundation Committee (30670979) and Nature Science Foundation Committee of Guangdong Province (5001206), China.
All the authors declared no competing interests.
Footnotes
SUPPLEMENTARY MATERIAL
Figure S1. Identification of SR-A gene in mice.
Supplementary material is linked to the online version of the paper at http://www.nature.com/ki
Supplementary Material
References
- Moorhead JF, Chan MK, El-Nahas M, et al. Lipid nephrotoxicity in chronic progressive glomerular and tubulo-interstitial disease. Lancet. 1982;2:1309–1311. doi: 10.1016/s0140-6736(82)91513-6. [DOI] [PubMed] [Google Scholar]
- Ruan XZ, Varghese Z, Moorhead JF. An update on the lipid nephrotoxicity hypothesis. Nat Rev Nephrol. 2009;5:713–721. doi: 10.1038/nrneph.2009.184. [DOI] [PubMed] [Google Scholar]
- Herzlinger D. Renal interstitial fibrosis: remembrance of things past. J Clin Invest. 2002;110:305–306. doi: 10.1172/JCI16377. [DOI] [PMC free article] [PubMed] [Google Scholar]
- Trevisan R, Dodesini AR, Lepore G. Lipids and renal disease. J Am Soc Nephrol. 2006;17:S145–S147. doi: 10.1681/ASN.2005121320. [DOI] [PubMed] [Google Scholar]
- Suzuki H, Kurihara Y, Takeya M, et al. The multiple roles of macrophage scavenger receptors (MSR) in vivo: resistance to atherosclerosis and susceptibility to infection in MSR knockout mice. J Atheroscler Thromb. 1997;4:1–11. doi: 10.5551/jat1994.4.1. [DOI] [PubMed] [Google Scholar]
- Okamura DM, Lopez-Guisa JM, Koelsch K, et al. Atherogenic scavenger receptor modulation in the tubulointerstitium in response to chronic renal injury. Am J Physiol Renal Physiol. 2007;293:F575–F585. doi: 10.1152/ajprenal.00063.2007. [DOI] [PubMed] [Google Scholar]
- Hu C, Kang BY, Megyesi J, et al. Deletion of LOX-1 attenuates renal injury following angiotensin II infusion. Kidney Int. 2009;76:521–527. doi: 10.1038/ki.2009.234. [DOI] [PubMed] [Google Scholar]
- Okamura DM, Pennathur S, Pasichnyk K, et al. CD36 regulates oxidative stress and inflammation in hypercholesterolemic CKD. J Am Soc Nephrol. 2009;20:495–505. doi: 10.1681/ASN.2008010009. [DOI] [PMC free article] [PubMed] [Google Scholar]
- Yamamoto N, Toyoda M, Abe M, et al. Lectin-like oxidized LDL receptor-1 (LOX-1) expression in the tubulointerstitial area likely plays an important role in human diabetic nephropathy. Intern Med. 2009;48:189–194. doi: 10.2169/internalmedicine.48.1251. [DOI] [PubMed] [Google Scholar]
- Grolleau A, Misek DE, Kuick R, et al. Inducible expression of macrophage receptor Marco by dendritic cells following phagocytic uptake of dead cells uncovered by oligonucleotide arrays. J Immunol. 2003;171:2879–2888. doi: 10.4049/jimmunol.171.6.2879. [DOI] [PubMed] [Google Scholar]
- Babaev VR, Gleaves LA, Carter KJ, et al. Reduced atherosclerotic lesions in mice deficient for total or macrophage-specific expression of scavenger receptor-A. Arterioscler Thromb Vasc Biol. 2000;20:2593–2599. doi: 10.1161/01.atv.20.12.2593. [DOI] [PubMed] [Google Scholar]
- Kamada N, Kodama T, Suzuki H. Macrophage scavenger receptor (SR-A I/II) deficiency reduced diet-induced atherosclerosis in C57BL/6J mice. J Atheroscler Thromb. 2001;8:1–6. doi: 10.5551/jat1994.8.1. [DOI] [PubMed] [Google Scholar]
- Suzuki H, Kurihara Y, Takeya M, et al. A role for macrophage scavenger receptors in atherosclerosis and susceptibility to infection. Nature. 1997;386:292–296. doi: 10.1038/386292a0. [DOI] [PubMed] [Google Scholar]
- Ruan XZ, Moorhead JF, Fernando R, et al. Regulation of lipoprotein trafficking in the kidney: role of inflammatory mediators and transcription factors. Biochem Soc Trans. 2004;32:88–91. doi: 10.1042/bst0320088. [DOI] [PubMed] [Google Scholar]
- Eddy AA. Interstitial inflammation and fibrosis in rats with diet-induced hypercholesterolemia. Kidney Int. 1996;50:1139–1149. doi: 10.1038/ki.1996.421. [DOI] [PubMed] [Google Scholar]
- Kasiske BL, O'Donnell MP, Schmitz PG, et al. Renal injury of diet-induced hypercholesterolemia in rats. Kidney Int. 1990;37:880–891. doi: 10.1038/ki.1990.62. [DOI] [PubMed] [Google Scholar]
- Vasconcelos EM, Degasperi GR, de Oliveira HC, et al. Reactive oxygen species generation in peripheral blood monocytes and oxidized LDL are increased in hyperlipidemic patients. Clin Biochem. 2009;42:1222–1227. doi: 10.1016/j.clinbiochem.2009.05.010. [DOI] [PubMed] [Google Scholar]
- Nielsen F, Mikkelsen BB, Nielsen JB, et al. Plasma malondialdehyde as biomarker for oxidative stress: reference interval and effects of life-style factors. Clin Chem. 1997;43:1209–1214. [PubMed] [Google Scholar]
- Patsouris D, Li PP, Thapar D, et al. Ablation of CD11c-positive cells normalizes insulin sensitivity in obese insulin resistant animals. Cell Metab. 2008;8:301–309. doi: 10.1016/j.cmet.2008.08.015. [DOI] [PMC free article] [PubMed] [Google Scholar]
- Charo IF, Ransohoff RM. The many roles of chemokines and chemokine receptors in inflammation. New Engl J Med. 2006;354:610–621. doi: 10.1056/NEJMra052723. [DOI] [PubMed] [Google Scholar]
- Deshmane SL, Kremlev S, Amini S, et al. Monocyte chemoattractant protein-1 (MCP-1): an overview. J Interferon Cytokine Res. 2009;29:313–326. doi: 10.1089/jir.2008.0027. [DOI] [PMC free article] [PubMed] [Google Scholar]
- Tesch GH, Schwarting A, Kinoshita K, et al. Monocyte chemoattractant protein-1 promotes macrophage-mediated tubular injury, but not glomerular injury, in nephrotoxic serum nephritis. J Clin Invest. 1999;103:73–80. doi: 10.1172/JCI4876. [DOI] [PMC free article] [PubMed] [Google Scholar]
- Schnaper HW, Hayashida T, Poncelet AC. It's a Smad world: regulation of TGF-beta signaling in the kidney. J Am Soc Nephrol. 2002;13:1126–1128. doi: 10.1681/ASN.V1341126. [DOI] [PubMed] [Google Scholar]
- Wang W, Huang XR, Li AG, et al. Signaling mechanism of TGF-beta1 in prevention of renal inflammation: role of Smad7. J Am Soc Nephrol. 2005;16:1371–1383. doi: 10.1681/ASN.2004121070. [DOI] [PubMed] [Google Scholar]
- Fiocchi C. TGF-beta/Smad signaling defects in inflammatory bowel disease: mechanisms and possible novel therapies for chronic inflammation. J Clin Invest. 2001;108:523–526. doi: 10.1172/JCI13863. [DOI] [PMC free article] [PubMed] [Google Scholar]
- Steinmetz OM, Stahl RA. A new partnership between TGF-beta1 and glucocorticoids in the network of inflammation. Kidney Int. 2003;63:2317–2318. doi: 10.1046/j.1523-1755.2003.00083.x. [DOI] [PubMed] [Google Scholar]
- Chade AR, Bentley MD, Zhu X, et al. Antioxidant intervention prevents renal neovascularization in hypercholesterolemic pigs. J Am Soc Nephrol. 2004;15:1816–1825. doi: 10.1097/01.asn.0000130428.85603.6b. [DOI] [PubMed] [Google Scholar]
- Iacobini C, Menini S, Ricci C, et al. Advanced lipoxidation end-products mediate lipid-induced glomerular injury: role of receptor-mediated mechanisms. J Pathol. 2009;218:360–369. doi: 10.1002/path.2536. [DOI] [PubMed] [Google Scholar]
- Duffield JS, Tipping PG, Kipari T, et al. Conditional ablation of macrophages halts progression of crescentic glomerulonephritis. Am J Pathol. 2005;167:1207–1219. doi: 10.1016/S0002-9440(10)61209-6. [DOI] [PMC free article] [PubMed] [Google Scholar]
- Ye Q, Chen Y, Lei H, et al. Inflammatory stress increases unmodified LDL uptake via LDL receptor: an alternative pathway for macrophage foam-cell formation. Inflamm Res. 2009;58:809–818. doi: 10.1007/s00011-009-0052-4. [DOI] [PubMed] [Google Scholar]
- Utsunomiya K, Ohta H, Kurata H, et al. The effect of macrophage colony-stimulating factor (M-CSF) on the progression of lipid-induced nephrotoxicity in diabetic nephropathy. J Diabetes Complications. 1995;9:292–295. doi: 10.1016/1056-8727(95)80025-a. [DOI] [PubMed] [Google Scholar]
- Hattori M, Nikolic-Paterson DJ, Miyazaki K, et al. Mechanisms of glomerular macrophage infiltration in lipid-induced renal injury. Kidney Int Suppl. 1999;71:S47–S50. doi: 10.1046/j.1523-1755.1999.07112.x. [DOI] [PubMed] [Google Scholar]
- Nakagawa T, Li JH, Garcia G, et al. TGF-beta induces proangiogenic and antiangiogenic factors via parallel but distinct Smad pathways. Kidney Int. 2004;66:605–613. doi: 10.1111/j.1523-1755.2004.00780.x. [DOI] [PubMed] [Google Scholar]
- Zeisberg M, Hanai J, Sugimoto H, et al. BMP-7 counteracts TGF-beta1-induced epithelial-to- mesenchymal transition and reverses chronic renal injury. Nat Med. 2003;9:964–968. doi: 10.1038/nm888. [DOI] [PubMed] [Google Scholar]
- Epperly MW, Travis EL, Whitsett JA, et al. Overexpression of manganese superoxide dismutase (MnSOD) in whole lung or alveolar type II cells of MnSOD transgenic mice does not provide intrinsic lung irradiation protection. Int J Cancer. 2001;96:11–21. doi: 10.1002/1097-0215(20010220)96:1<11::aid-ijc2>3.0.co;2-r. [DOI] [PubMed] [Google Scholar]
- Chen JZ, Zhang FR, Tao QM, et al. Number and activity of endothelial progenitor cells from peripheral blood in patients with hypercholesterolaemia. Clin Sci (Lond) 2004;107:273–280. doi: 10.1042/CS20030389. [DOI] [PubMed] [Google Scholar]
- Eddy AA. Interstitial fibrosis in hypercholesterolemic rats: role of oxidation, matrix synthesis, and proteolytic cascades. Kidney Int. 1998;53:1182–1189. doi: 10.1046/j.1523-1755.1998.00889.x. [DOI] [PubMed] [Google Scholar]
- Jiang T, Liebman SE, Lucia MS, et al. Role of altered renal lipid metabolism and the sterol regulatory element binding proteins in the pathogenesis of age-related renal disease. Kidney Int. 2005;68:2608–2620. doi: 10.1111/j.1523-1755.2005.00733.x. [DOI] [PubMed] [Google Scholar]
- Xiao H, Shi W, Liu S, et al. 1,25-Dihydroxyvitamin D(3) prevents puromycin aminonucleoside- induced apoptosis of glomerular podocytes by activating the phosphatidylinositol 3-kinase/Akt-signaling pathway. Am J Nephrol. 2009;30:34–43. doi: 10.1159/000200769. [DOI] [PubMed] [Google Scholar]
- Fu P, Liu F, Su S, et al. Signaling mechanism of renal fibrosis in unilateral ureteral obstructive kidney disease in ROCK1 knockout mice. J Am Soc Nephrol. 2006;17:3105–3114. doi: 10.1681/ASN.2005121366. [DOI] [PubMed] [Google Scholar]
- Bligh EG, Dyer WJ. A rapid method of total lipid extraction and purification. Can J Biochem Physiol. 1959;37:911–917. doi: 10.1139/o59-099. [DOI] [PubMed] [Google Scholar]
- Ryan MJ, Johnson G, Kirk J, et al. HK-2: an immortalized proximal tubule epithelial cell line from normal adult human kidney. Kidney Int. 1994;45:48–57. doi: 10.1038/ki.1994.6. [DOI] [PubMed] [Google Scholar]
- Cook HT, Smith J, Cattell V. Isolation and characterization of inflammatory leukocytes from glomeruli in an in situ model of glomerulonephritis in the rat. Am J Pathol. 1987;126:126–136. [PMC free article] [PubMed] [Google Scholar]
Associated Data
This section collects any data citations, data availability statements, or supplementary materials included in this article.


