

Abstract
The paracellular claudin channel of the thick ascending limb (TAL) of Henle is critical for Ca++ reabsorption in the kidney. Genome-wide association studies (GWASs) have identified claudin-14 associated with hypercalciuric nephrolithiasis. Here, we show that claudin-14 promoter activity and transcript are exclusively localized in the TAL. Under normal dietary condition, claudin-14 proteins are suppressed by two microRNA molecules (miR-9 and miR-374). Both microRNAs directly target the 3′-UTR of claudin-14 mRNA; induce its mRNA decay and translational repression in a synergistic manner. Through physical interaction, claudin-14 blocks the paracellular cation channel made of claudin-16 and -19, critical for Ca++ reabsorption in the TAL. The transcript and protein levels of claudin-14 are upregulated by high Ca++ diet, while downregulated by low Ca++ diet. Claudin-14 knockout animals develop hypermagnesaemia, hypomagnesiuria, and hypocalciuria under high Ca++ dietary condition. MiR-9 and miR-374 transcript levels are regulated by extracellular Ca++ in a reciprocal manner as claudin-14. The Ca++ sensing receptor (CaSR) acts upstream of the microRNA-claudin-14 axis. Together, these data have established a key regulatory role for claudin-14 in renal Ca++ homeostasis.
Keywords: bone mineral loss, hypercalciuria, kidney stone, tight junction
Introduction
Regulation of calcium homeostasis resides principally within the kidney. A monogenic renal disorder, autosomal recessive familial hypomagnesaemia with hypercalciuria and nephrocalcinosis (FHHNC; OMIM #248250), is caused by mutations in the claudin (CLDN) genes: CLDN16 (Simon et al, 1999) and CLDN19 (Konrad et al, 2006). A recent genome-wide association study (GWAS) has identified CLDN14 as a major risk gene of hypercalciuric nephrolithiasis and reduced bone mineral density (Thorleifsson et al, 2009). Claudins are tetraspan proteins consisting of a family of 27 members that form the paracellular channels allowing selective permeation of ions through the epithelial tight junction (TJ) (Tsukita et al, 2001; Mineta et al, 2011). The CLDN16 and CLDN19 genes are exclusively expressed in the thick ascending limb (TAL) of the nephron, where a major percentage of filtered divalent cations are reabsorbed paracellularly (30–35% Ca++ and 50–60% Mg++) (Greger, 1985). A run of in-vitro (Hou et al, 2005, 2008) and in-vivo (Hou et al, 2007, 2009) studies have shown that CLDN16 and CLDN19 form a heteromeric cation channel, which (i) permeates Ca++ and Mg++; (ii) generates a lumen-positive diffusion potential in the late TAL that contribute to the driving force for Ca++ and Mg++ reabsorption. CLDN14 is important for the physiology of cochlear hair cells in the inner ear (Ben-Yosef et al, 2003). Mutations in CLDN14 have been linked to autosomal recessive non-syndromic deafness (DFNB29) (Wilcox et al, 2001). Nevertheless, neither hypercalciuria nor nephrolithiasis has been found in human or transgenic knockout (KO) animals with these mutations (Wilcox et al, 2001; Ben-Yosef et al, 2003). Here, through biochemical analyses and electrophysiological recordings, we have found a mechanistic role for CLDN14 in renal Ca++ reabsorption that involves its physical and functional interaction with CLDN16. Gain of CLDN14 function in kidney epithelial cells diminished paracellular cation permeability of the CLDN16–CLDN19 channel.
Within physiological ranges, Ca++ intake variations are balanced by changes in renal excretion. The Ca++ sensing receptor (CaSR) provides a key mechanism for monitoring the circulating Ca++ levels and enabling the kidney to adjust excretion rates accordingly (Riccardi and Brown, 2010). In the kidney, CaSR regulates Ca++ transport through changes in the transepithelial potential and alterations of the paracellular channel permeability (Gamba and Friedman, 2009). Nevertheless, the mechanism of CaSR regulation in the kidney has long been a mystery. Here, we have shown that CaSR activation increases the gene expression levels of CLDN14 in the TAL of the kidney. MicroRNAs are single-stranded, non-coding RNA molecules of 19–25 nt in length, which are generated from endogenous hairpin-shaped transcripts (Krol et al, 2010), base pair with their target mRNAs and induce either translational repression or mRNA destabilization (Huntzinger and Izaurralde, 2011). Here, we have found two microRNAs that target the 3′-UTR of CLDN14 gene: miR-9 and miR-374. MiR-9 has a known function in cancer cell metastasis (Ma et al, 2010), while miR-374 is a novel microRNA. In the TAL cells, miR-9 and miR-374 repress CLDN14 transcript stability and translation in a synergistic manner. The transcript levels of both microRNAs are regulated by extracellular Ca++ through the CaSR. The signalling pathway of CaSR-microRNA-CLDN14-CLDN16/19 forms a complete regulatory loop for Ca++ homeostasis in the kidney.
Results
The renal localization of CLDN14 promoter, mRNA, and protein
The renal localization of CLDN14 has been controversial. Immunofluorescence analysis showed CLDN14 expression in the TAL of Henle's loop and the proximal tubules of mouse kidneys (Ben-Yosef et al, 2003; Elkouby-Naor et al, 2008), while another study reported no CLDN14 expression in the kidney (Kiuchi-Saishin et al, 2002). To clearly demonstrate CLDN14 gene expression in the kidney, regardless of any regulatory mechanism that may affect its mRNA or protein level (vide infra), we determined CLDN14 promoter activities in the mouse kidney. The CLDN14 promoter activity was assessed in vivo with a CLDN14-lacZ reporter mouse line (Ben-Yosef et al, 2003), in which the lacZ reporter gene replaced the CLDN14 gene under control of the endogenous CLDN14 promoter. Through rigorous colocalization analyses, we found that in CLDN14+/lacZ mouse kidneys, the β-galactosidase activity was detected in tubules that co-expressed the Tamm–Horsfall protein (THP: a TAL marker) (Figure 1A), but not in glomerulus (Supplementary Figure S1) or in tubules that were labelled with the Lotus tetragonolobus lectin (LTL: a proximal convoluted/straight tubule (PCT/PST) marker) or that co-expressed the thiazide-sensitive Na+/Cl− cotransporter (NCC: a distal convoluted tubule (DCT) marker) or aquoporin-2 (AQP2: a connecting tubule/collecting duct (CNT/CD) marker) (Supplementary Figure S1). To determine CLDN14 mRNA levels in the kidney, we microdissected each nephron segment from the mouse kidney obeying a rigorous criterion (Figure 1B, legend) and quantified CLDN14 transcript levels (normalized to β-actin mRNA levels) with real-time PCR. The TAL expressed the highest levels of CLDN14 mRNA (Figure 1C), which were over five-fold higher than in the glomerulus or DCT (P<0.05, n=3); over 10-fold higher than in PCT/PST or CNT/CD (P<0.01, n=3). These microdissected nephron segments were analysed for the mRNA levels of a TAL marker gene—CLDN16. CLDN16 transcripts were only found in the TAL (Figure 1C), ruling out the possibility of tubular cross-contamination during the microdissection process. To look for CLDN14 proteins in the kidney, we immunostained mouse kidney sections under normal dietary condition but found no detectable signal in the kidney (Figure 5C).
Figure 1.

CLDN14 gene localization in the kidney. (A) lacZ reporter assay detects β-galactosidase activity in renal tubules that exclusively colocalizes with the Tamm–Horsfall protein. Bar: 100 μm. (B) Microdissected tubular segments from the mouse kidney. Microdissection criterion: (i) PCT, DCT, and TAL joined at glomerulus/macula densa are dissected out; (ii) glomerulus and PCT are separated from macula densa; (iii) PCT is separated from glomerulus and DCT is separated from TAL free of any junctional tissue—macula densa; (iv) PST is separated from PCT, CNT/CD separated from DCT and TAL separated from CNT/CD according to morphological differences. Glom, glomerulus; PCT, proximal convoluted tubule; PST, proximal straight tubule; TAL, thick ascending limb; DCT, distal convoluted tubule; CNT, connecting tubule; CD, collecting duct. (C) CLDN14 and CLDN16 mRNA levels relative to β-actin mRNA levels in microdissected tubular segments. *P<0.05, n=3.
CLDN14 gene expression is suppressed by miR-9 and miR-374 in the kidney
The apparent suppression of CLDN14 proteins in the kidney prompted us to look for underlying regulatory mechanisms. The strong CLDN14 promoter activity in the kidney suggested post-transcriptional mechanisms for CLDN14 gene regulation. MicroRNAs are key regulatory molecules that regulate gene expression on the post-transcriptional level, by inducing target mRNA decay or translational repression (Huntzinger and Izaurralde, 2011). MicroRNAs recognize partially complementary binding sites located in 3′-UTRs of target mRNAs. The CLDN14 gene produces alternatively spliced transcripts in the human (five variants), the mouse (three variants), and the rat (one variant) (Materials and methods). The splicing variants differ in their 5′-UTR sequences while the coding region and 3′-UTR sequences are conserved in all variants. For predictions of microRNAs targeting CLDN14:3′-UTR based on sequence complementarities and cross-species conservation, four algorithms were used: TargetScan, miRanda, Diana microT, and MirTarget2 (Materials and methods). Because CLDN14:3′-UTR is short, only 183 bp in human (#AF314090), a total of 11 microRNAs were identified targeting the human sequence (Supplementary Table S1). MiR-9 consistently appeared in all four algorithms while miR-374 was reported by two independent algorithms (Supplementary Table S1). A cross-species search of the 11 microRNA binding sites in mouse CLDN14:3′-UTR (171 bp; #AF314089) reported only the miR-374 binding site conserved in human and mouse sequences. Human miR-374 has two isoforms—a and b, both sharing the same seed sequence. Mature human miR-374b (hsa-miR-374b) is identical to mouse and rat miR-374 (mmu-miR-374 and rno-miR-374 respectively). The miR-374 binding site (AUUAUA matching the seed sequence of miR-374) within CLDN14:3′UTR was conserved across species (Supplementary Figure S2). Three pre-miR-9 genes (miR-9-1, -2, and -3) encode the same mature miR-9. Sequence alignment identified a conserved miR-9 binding site within human CLDN14:3′-UTR (CCAAAG) (Supplementary Figure S2), which was however mutated in mouse and rat. Surprisingly, a second miR-9 binding site was found in mouse and rat CLDN14:3′-UTRs, located 69 bp upstream of the conserved site (Supplementary Figure S3).
To determine whether miR-9 or miR-374 targets CLDN14:3′-UTR directly, we generated the reporter constructs (pMir Reporter; Materials and methodss) that had the entire mouse CLDN14:3′-UTR sequence (171 bp) or human CLDN14:3′-UTR sequence (183 bp) cloned downstream of the firefly luciferase gene, termed as pMir-Reporter-CLDN14:3′-UTRmouse or pMir-Reporter-CLDN14:3′-UTRhuman, respectively. The pMir Reporter was transfected with scrambled miRNA, miR-9, or miR-374 precursor to HEK293 cells. A 25% decrease in firefly luciferase activity (P<0.01, n=4; normalized to Renilla luciferase activity; Figure 2A) was found for miR-9 when assayed with pMir-Reporter-CLDN14:3′-UTRmouse; an 18% decrease (P<0.05, n=4) for miR-374, compared with scrambled miRNA. The human CLDN14:3′-UTR was more sensitive to microRNA suppression, with miR-9 suppressing pMir-Reporter-CLDN14:3′-UTRhuman activity by 48%; miR-374 by 39% (P<0.001, n=4; Figure 2B). MiR-9 showed higher efficacy than miR-374 on both pMir Reporters. Deletion of miR-9 and miR-374 binding sites (Materials and methods) in CLDN14:3′-UTR abolished the miR-9 or miR-374 precursor effect (Figure 2C). To demonstrate whether microRNAs were required for CLDN14 regulation in vivo, we adapted the antagomir method (Krutzfeldt et al, 2005) to repress mature microRNA function in a cultured TAL cell model—MKTAL. The MKTAL cells derived from microdissected mouse TAL tubules and expressed the TAL-specific genes, THP and NKCC2 (Bourgeois et al, 2003). We assessed the efficacy of antagomir knockdown (KD) of microRNAs by the pMir-Reporter assay. Transfection with anti-miR-9 or anti-miR-374 but not scrambled antagomir increased pMir-Reporter-CLDN14:3′-UTRmouse activity by 1.38-fold (P<0.05, n=4; Figure 2D) or 1.46-fold (P<0.001, n=4), respectively, in MKTAL cells. Co-transfection with anti-miR-9 and anti-miR-374 (at molar ratio 1:1) increased luciferase activity by 2.11-fold (P<0.001, n=4), suggesting a functional synergy between these two microRNAs. This synergy was more evident in their regulation of endogenous CLDN14 expression in MKTAL cells. While neither anti-miR-9 nor anti-miR-374 alone affected CLDN14 mRNA levels, transfection with both antagomirs upregulated CLDN14 mRNA levels by 2.76-fold (P<0.05, n=6; normalized to β-actin mRNA; Figure 2E) in MKTAL cells. Concomitant CLDN14 translation assays revealed more pronounced microRNA effects. The repression of CLDN14 protein levels was relieved by co-transfection with anti-miR-9 and anti-miR-374, reflected by a 3.86-fold (P<0.05, n=3; normalized to β-actin protein; Figure 2F) increase on densitometric scale, but not by either antagomir alone. The synergistic effect of multiple microRNAs on their common cognate target has been demonstrated by several studies (Gregory et al, 2008; Yoo et al, 2009). MicroRNA, when bound to its target, triggers mRNA deadenylation through a common deadenylase complex (Huntzinger and Izaurralde, 2011). If an mRNA is bound with several microRNAs, ablation of a single microRNA would not sufficiently restore the mRNA stability. To determine whether microRNAs regulated CLDN14 gene expression in the mouse kidney, we isolated mouse TAL cells with an immunomagnetic separation method described before (Materials and methods; Hou et al, 2009). The isolated cells were viable and express the TAL-specific genes, THP and CLDN16 (Hou et al, 2009). Once isolated, they were plated in culture medium for <16 h followed by immediate antagomir transfection. Antagomir transfection into freshly isolated mouse TAL cells increased pMir-Reporter-CLDN14:3′-UTRmouse activity by 1.71-fold (anti-miR-9+anti-miR-374 versus scrambled antagomir; P<0.05, n=3; Figure 2G). The endogenous CLDN14 expression levels in isolated TAL cells were assessed with real-time RT–PCR. Transfection with anti-miR-9+anti-miR-374 significantly upregulated CLDN14 transcript levels by 1.87-fold (P<0.05, n=4; Figure 2H) compared with scrambled antagomir. Together, these data suggest that miR-9 and miR-374 synergistically regulate CLDN14 gene expression in the TAL of the kidney.
Figure 2.

MicroRNA regulation of CLDN14 expression in the kidney. (A–C) The firefly/Renilla luciferase activity ratios measured in HEK293 cells transfected with pMir-Reporter-CLDN14:3′-UTRmouse and scrambled miRNA, miR-9, or miR-374 precursor (A); with pMir-Reporter-CLDN14:3′-UTRhuman and miRNA precursor (B); with pMir-Reporter-CLDN14:3′-UTRhuman containing deletions in miRNA binding sites (C). (D) Transfection with antagomirs increases pMir-Reporter-CLDN14:3′-UTRmouse activity in MKTAL cells. (E) CLDN14 mRNA levels relative to β-actin mRNA levels in MKTAL cells transfected with antagomirs. (F) CLDN14 protein levels relative to β-actin protein levels in MKTAL cells transfected with antagomirs. (G) Antagomir transfection increases pMir-Reporter-CLDN14:3′-UTRmouse activity in freshly isolated mouse TAL cells. (H) CLDN14 mRNA levels in freshly isolated mouse TAL cells transfected with antagomirs.
CLDN14 interacts with CLDN16 in the kidney
Because CLDN16 and CLDN19 are colocalized in the TAL (Hou et al, 2008) and the colocalization requires their interaction (Hou et al, 2009), the TAL localization of CLDN14 prompted us to seek for evidence of CLDN14 interaction with CLDN16 or CLDN19. Claudins cis interact within the plane of the membrane to form dimers, or higher oligomeric state, followed by trans interactions between claudins in adjacent cells and additional cis interactions to assemble claudin oligomers into intramembrane TJ strands (Furuse et al, 1999). Because the oligomeric nature of the TJ structure denies an unambiguous study of any selected claudin interaction within the TJ matrix (Stevenson and Goodenough, 1984), simple cell systems with no TJ (e.g., yeast and embryonic HEK293 cells) were used to probe direct claudin interactions. To determine the cis interactions of CLDN14 with CLDN16 or 19, we used the split-ubiquitin yeast 2-hybrid (Y2H) membrane protein interaction assay (Hou et al, 2008). Our data show that CLDN14 interacted with itself and with CLDN16, as assayed with all three reporters (HIS3, lacZ, and ADE2) in the yeast NMY51 strain (Figure 3A). No interaction was evident for CLDN14 and CLDN19 on any of these reporter assays (Figure 3A). The level of interaction strength between CLDN14 and CLDN16 was equal to that of CLDN16–CLDN19 interaction, as quantified with the lacZ reporter (Figure 3B). To directly document CLDN14–CLDN16 interaction in epithelial cells, we attempted coimmunoprecipitation of CLDN14 and CLDN16 in doubly transfected HEK293 cells, an embryonic cell line with no endogenous claudin or transepithelial resistance (TER). At low cell density, which minimizes cell–cell contacts and trans interactions, interactions between CLDN14 and CLDN16 will be mostly cis. Immunoblotting showed that anti-CLDN14 antibody coprecipitated CLDN16, whereas anti-CLDN16 antibody reciprocally precipitated CLDN14 (Figure 3C). Other TJ protein antibodies, such as anti-CLDN1 and anti-occludin antibody (as non-specific binding controls), precipitated neither CLDN14 nor CLDN16 (Figure 3C). Anti-CLDN19 antibody was not able to precipitate CLDN14; nor was anti-CLDN14 antibody to precipitate CLDN19 (Figure 3D). In triply transfected cells expressing three claudins at the molecular ratio of 1:1:1, anti-CLDN19 antibody now precipitated CLDN14 with similar affinity to anti-CLDN16 antibody (Figure 3E), suggesting (i) CLDN19 acted through CLDN16 to interact with CLDN14; (ii) CLDN14 integrated into the CLDN16–CLDN19 complex instead of forming an independent CLDN14–CLDN16 complex. Anti-CLDN14 antibody precipitated the same amount of CLDN16 as anti-CLDN19 antibody (Figure 3E), suggesting (i) CLDN19–CLDN16 interaction was not affected in the presence of CLDN14; (ii) the interaction strength of CLDN14–CLDN16 was equal to that of CLDN19-CLDN16, consistent with the Y2H studies (Figure 3B). Together, these data indicate that CLDN14, 16, and 19 form an oligomer by utilizing two separate binding sites in CLDN16 to anchor CLDN14 and CLDN19, respectively.
Figure 3.

CLDN14 interacts with CLDN16. (A) Y2H assays showing interaction of CLDN14 with CLDN16 but not with CLDN19, determined by three reporter genes (HIS3, lacZ, and ADE2) in the yeast NMY51 strain. Plates with selective medium lacking leucine and tryptophan (SD-LW), indicating the transformation of both bait and prey vectors; with SD-LWH and SD-LWHA, indicating the expression of reporter genes HIS3 and ADE2; and the β-galactosidase assay are shown. (B) Quantitative β-galactosidase assay to determine the relative interaction strength of the following pairs: CLDN16–CLDN19, CLDN14–CLDN16, and CLDN14–CLDN19. (C, D) Coimmunoprecipitation of claudins in doubly transfected HEK293 cells to determine CLDN14–CLDN16 interaction (C) and CLDN14–CLDN19 interaction (D). (E) Coimmunoprecipitation of claudins in triply transfected HEK293 cells to determine CLDN14–CLDN16–CLDN19 interaction. Antibodies used for immunoprecipitation are shown above the lanes; antibody for blot visualization is shown at left. Non-specific 1: anti-CLDN1; Non-specific 2: anti-occludin; *Lane shows 10% of input amount as in other lanes.
CLDN14 abolishes the cation selectivity of CLDN16–CLDN19 heteromeric channel through repression of CLDN16
To determine the functional role of CLDN14 in the kidney, we stably expressed CLDN14 in the well-established epithelial cell model LLC-PK1 cells (Hou et al, 2005) that lack the endogenous expression of CLDN14, 16, or 19. As we aimed to have cells expressing CLDN14 over a prolonged period so that they could become fully polarized and form TJs, we used a previously described retroviral expression system (Materials and methods) to drive exogenous CLDN14 expression (Hou et al, 2005, 2008). In LLC-PK1 cells, transfected CLDN16 permeated cations (Hou et al, 2005) while CLDN19 blocked anion permeation (Hou et al, 2008). Co-expression of CLDN16 and CLDN19 generated cation selectivity of the TJ in a synergistic manner (Hou et al, 2008) and resembling the recorded levels in perfused TAL tubules (Hou et al, 2007). With a modified Ussing chamber recording method, we found CLDN14 expression alone in LLC-PK1 cells was without any significant effect on ion selectivity (PNa/PCl; Table I). Co-expression of CLDN14 with CLDN16 and CLDN19 abolished their cation selectivity (PNa/PCl: from 4.486±0.087 in CLDN16+19 reduced to 1.336±0.006 in CLDN14+16+19; Table I), reflected by a significant decrease in junctional diffusion potential (PD) (Figure 4; CLDN16+19: 9.53±0.09 versus CLDN14+16+19: 2.13±0.03 mV; P<0.01, n=3). The decrease in PNa/PCl was attributable to a 2.43-fold decrease in absolute PNa (Table I; CLDN16+19: 23.337±0.082 versus CLDN14+16+19: 9.603±0.019 × 10⁻⁶ cm/s; P<0.01, n=3), whereas PCl was only mildly affected. The TJ localization of CLDN16 or CLDN19 was not affected by CLDN14 expression (Supplementary Figure S4). Knowing that CLDN14 interacted with CLDN16, we asked whether CLDN14 affected CLDN16 permeability. Expression of CLDN14 in CLDN16 cell background significantly reduced PNa by 2.03-fold (Table I; CLDN16: 17.013±0.072 versus CLDN14+16: 8.395±0.028 × 10⁻⁶ cm/s; P<0.01, n=3), resulting in a significant decrease in PD (Figure 4) and PNa/PCl (Table I). Complete substitution of Na+ by Li+ or Ca++ on one side of the epithelium produced bi-ionic potentials from which the relative permeabilities could be calculated (Hou et al, 2007). CLDN14 expression produced no difference in CLDN16 channel bi-ionic potentials recorded for PLi/PNa or PCa/PNa (Table I: footnotes), indicating CLDN14 is a non-selective cation blocker. CLDN14 had no significant effect on CLDN19 function, compatible with the observation that CLDN14 did not interact with CLDN19. Therefore, CLDN14 abolished the cation selectivity of CLDN16–CLDN19 heteromeric channel by repressing CLDN16 permeability.
Table 1. Combinatorial expression analyses of claudin channel permeabilities.
| Group | TER (Ω·cm2) | Diffusion potential (mV) | PNa/PCl | PNa (10−6 cm/s) | PCl (10−6 cm/s) |
|---|---|---|---|---|---|
| LLC-PK1+vector | 68.0±3.6 | −8.87±0.23 | 0.257±0.012 | 5.510±0.206 | 21.480±0.204 |
| LLC-PK1+CLDN14 | 83.3±1.2 | −9.40±0.26 | 0.230±0.013 | 4.114±0.190 | 17.920±0.191 |
| LLC-PK1+CLDN16 | 50.3±2.3 | −1.00±0.06 | 0.874±0.007a | 17.013±0.072 | 19.473±0.072 |
| LLC-PK1+CLDN19 | 159.0±2.3 | −1.27±0.03 | 0.843±0.004 | 5.269±0.013 | 6.252±0.013 |
| LLC-PK1+CLDN14+CLDN16 | 74.3±2.2 | −4.77±0.03b | 0.515±0.003a,b | 8.395±0.028b | 16.310±0.030 |
| LLC-PK1+CLDN14+CLDN19 | 169.7±3.4 | −0.83±0.03 | 0.894±0.004 | 5.104±0.012 | 5.711±0.012 |
| LLC-PK1+CLDN16+CLDN19 | 64.3±1.2 | 9.53±0.09 | 4.486±0.087 | 23.337±0.082 | 5.206±0.082 |
| LLC-PK1+CLDN14+CLDN16+CLDN19 | 109.3±3.9 | 2.13±0.03c | 1.336±0.006c | 9.603±0.019c | 7.189±0.019 |
| aPLi/PNa: 1.086±0.008 in LLC-PK1+CLDN16 cells versus 1.102±0.011 in LLC-PK1+CLDN14+CLDN16, n=3, not significant. | |||||
| PCa/PNa: 0.724±0.009 in LLC-PK1+CLDN16 cells versus 0.705±0.008 in LLC-PK1+CLDN14+CLDN16, n=3, not significant. | |||||
| bP<0.01 relative to LLC-PK1+CLDN16 cells, n=3. | |||||
| cP<0.01 relative to LLC-PK1+CLDN16+CLDN19 cells, n=3. | |||||
Figure 4.

Effects of CLDN14 on CLDN16 and CLDN19 function in combinatorial expression assays. Diffusion potential values across LLC-PK1 cell monolayers expressing CLDN14, CLDN16, and CLDN19, individually or in combinations, are shown. Positive diffusion potential reflects cation selectivity of paracellular channel while negative potential reflects anion selectivity.
Regulation of CLDN14 gene expression by extracellular Ca++ in the kidney
Knowing that CLDN14 interacted with and regulated the CLDN16–CLDN19 channel, we asked whether CLDN14 played a physiological role in renal Ca++ homeostasis. If CLDN14 was required for renal excretion of Ca++, then manipulating the dietary intake would induce changes in its expression, compatible with its role in regulating CLDN16 and 19 functions. To manipulate dietary calcium intakes in animals, age (7–8 weeks old) and sex (female) matched mice were segregated into three groups (I–III) and fed with the basal diet (I; Ca++: 0.61%), low Ca++ diet (II; Ca++: 0), or high Ca++ diet (III; Ca++: 5%), respectively, for six consecutive days (Materials and methods). While the circulating Ca++ level was well defended under low Ca++ diet, high Ca++ diet induced significant hypercalcaemia in animal group III (plasma Ca++: 2.72 mM versus 2.53 mM in basal group I; P<0.01, n=5; Figure 5A). To determine the gene expression levels of CLDN14 in mouse kidneys receiving dietary treatments, we isolated kidney TAL cells at the end of each treatment with the immunomagnetic separation method described elsewhere in this study and quantified CLDN14 mRNA levels (normalized to β-actin mRNA) with real-time RT–PCR. While low Ca++ diet (II) significantly downregulated CLDN14 mRNA levels to 37% of the basal level (I) (P<0.01, n=5; Figure 5B), high Ca++ diet (III) significantly upregulated CLDN14 by 3.18-fold (P<0.01, n=5; Figure 5B) compared with the basal diet (I). CLDN14 proteins were immunostained in mouse kidneys to reveal changes in protein levels. While the staining signal for CLDN14 was not detectable in the basal group (I) (Figure 5C), high Ca++ diet (III) profoundly upregulated CLDN14 protein levels that now showed strong staining in TJs of the TAL tubules (Figure 5C, arrowhead). The TJ localization of CLDN16 or CLDN19 in mouse kidneys was not affected by dietary Ca++ variations (Supplementary Figure S5). Because the immunomagnetic separation method only generated limited TAL material from a mouse kidney, we pooled the TAL cells from all animals (n=5) within each dietary group and quantified CLDN14 protein levels by western blot. High Ca++ diet (III) increased CLDN14 protein levels by 3.12-fold on densitometric scale (Figure 5D; normalized to β-actin protein) compared with the basal diet (I). To prove that CLDN14 gene expression is regulated by extracellular Ca++ per se independent of any hormonal molecule (e.g., the PTH), we directly manipulated extracellular Ca++ levels in a cultured TAL model—MKTAL described elsewhere in this study. Strongly correlated with the elevation of extracellular Ca++ concentration (supplemented to an EBSS-based low Ca++ culture medium; Materials and methods), there was a progressive induction of CLDN14 mRNA level (Figure 5E), with statistical significance first reached at 0.2 mM Ca++ (P<0.01, n=3). The induction of CLDN14 mRNA level was dose dependent on and linear within the physiological range of extracellular Ca++ (0–3 mM) (Figure 5E). Maximal induction of CLDN14 mRNA level was observed by 5.38-fold with 3 mM Ca++ (P<0.01, n=3; Figure 5E). Because extracellular Ca++ is required for TJ assembly and affects TJ protein maturation (Wong, 1997; Zheng and Cantley, 2007), we used 0.1 mM Ca++ in culture medium as the control condition for protein assays. CLDN14 protein levels were significantly increased by 2.59-fold in 3 mM Ca++ (P<0.01, n=4; Figure 5F) compared with control. PTH, however, when supplemented over a range of doses (1, 10, and 100 nM), had no significant effect on CLDN14 gene expression in MKTAL cells (n=3; Figure 5G). Together, these results indicate that CLDN14 gene expression in the kidney is directly regulated by extracellular Ca++.
Figure 5.

Extracellular Ca++ regulation of CLDN14 in the kidney. (A) The plasma Ca++ levels in mice receiving dietary Ca++ variations. (B) CLDN14 mRNA levels relative to β-actin mRNA levels in mouse kidney TALs receiving dietary Ca++ variations. (C) Immunostaining on mouse kidney sagittal sections (10 μm) shows CLDN14 protein localization in the tight junctions (arrowhead) of TAL tubules from animal receiving high Ca++ diet but not basal diet. Bar: 50 μm. (D) CLDN14 protein levels relative to β-actin protein levels in mouse kidney TALs receiving dietary Ca++ variations. (E) CLDN14 mRNA levels in MKTAL cells cultured in 0–3 mM Ca++. (F) Quantitation of CLDN14 protein levels in MKTAL cells cultured in 3 mM Ca++ versus 0.1 mM Ca++. (G) CLDN14 mRNA levels in MKTAL cells cultured in 0–100 nM PTH.
CLDN14 is required for regulating Ca++ excretion in the kidney
While targeted deletion of CLDN14 in animals initially focussed on its role in the inner ear, subsequent physiological studies revealed normal renal function in CLDN14 KO mice under basal dietary condition (Ben-Yosef et al, 2003; Elkouby-Naor et al, 2008). The rare loss-of-function mutations (398delT and T254A) associated with recessive deafness DFNB29 caused no renal abnormality in affected homozygous individuals (Wilcox et al, 2001). The lack of renal phenotype in CLDN14 KO animal or DFNB29 patient was compatible with our findings that CLDN14 gene expression was endogenously suppressed in absence of high Ca++ intakes. Knowing that CLDN14 was upregulated by extracellular Ca++, we predicted a prominent renal phenotype in CLDN14 KO when fed with high Ca++ diet. We previously described a CLDN16 KD and CLDN19 KD animal model that both recapitulated human FHHNC phenotypes (Hou et al, 2007, 2009). Because CLDN14 inhibited the CLDN16–CLDN19 channel, KO of CLDN14 would generate a renal phenotype opposite to that in CLDN16 KD and CLDN19 KD. To demonstrate in-vivo role of CLDN14 in the kidney, we performed 24 h urinalysis on CLDN14 KO mice and their littermate WT controls (Materials and methods). Age and sex matched animals from each group were fed with high Ca++ diet (III; Ca++: 5%) for six consecutive days. The plasma Mg++ level in CLDN14 KO mice was significantly higher (by 15%; P<0.05, n=6; Table II) than in WT, whereas the circulating Ca++ level was not significantly altered. CLDN14 KO mice showed defects in adjusting renal tubular absorption rate to excrete excess quantities of filtered Ca++ and Mg++. The fractional excretion rate for Ca++ (FECa) in CLDN14 KO animals was only 32% of the level in WT (P<0.01, n=6; Table II); FEMg in CLDN14 KO was 45% of WT (P<0.05, n=6; Table II). The glomerular filtration rate (GFR) was increased by 1.84-fold in CLDN14 KO animals (P<0.01, n=6; Table II) compared with WT; whereas the urinary volume (UV) was not significantly different between CLDN14 KO and WT. A plausible explanation for GFR increases in CLDN14 KO mice would be stimulation of the tubuloglomerular feedback (TGF) owing to higher Na+ absorption through the CLDN16–CLDN19 channel in the TAL. The paracellular Na+ absorption accounts for one half of total Na+ absorption in the TAL (Hebert and Andreoli, 1986). Together, these data suggest that CLDN14 regulates renal Ca++ excretion to counterbalance dietary changes.
Table 2. Analyses of plasma and urine electrolytes in WT and CLDN14 KO mice under high Ca++ dietary condition.
| WT | CLDN14 KO | Significance | |
|---|---|---|---|
| Weight, g | 19.04±0.58 | 19.36±2.56 | n.s. |
| PCa, mM | 2.74±0.02 | 2.75±0.05 | n.s. |
| PMg, mM | 0.93±0.03 | 1.07±0.03 | P<0.05 |
| UV, μl/24 h/g | 45.58±7.09 | 40.82±13.32 | n.s. |
| GFR, ml/24 h/g | 3.91±0.21 | 7.20±0.56 | P<0.01 |
| FECa, % | 1.65±0.08 | 0.53±0.15 | P<0.01 |
| FEMg, % | 7.03±1.00 | 3.14±0.44 | P<0.05 |
| FECa, FEMg, fractional excretion of Ca++ and Mg++; GFR, glomerular filtration rate; n.s., not significant; PCa, PMg, plasma Ca++ and Mg++ concentrations; UV, urine volume. | |||
| Values are expressed as means±s.e.m.; n=6, the number of animals; sex, male; age, 9–10 weeks. | |||
Regulation of miR-9 and miR-374 gene expression by extracellular Ca++ in the kidney
Knowing that miR-9 and miR-374 directly suppressed CLDN14 gene expression in the kidney, we asked whether microRNAs themselves were regulated by extracellular Ca++, which may suggest a physiological role for microRNAs in renal handling of Ca++. Because CLDN14 gene expression was exclusively localized in the TAL, we first asked where miR-9 and miR-374 were expressed in the kidney. Quantitative PCR measurements (normalized to U6 snRNA transcript) from microdissected nephron segments (Figure 1B) showed that miR-9 had the highest expression level in the TAL (P<0.05, n=3; relative to other segments; Figure 6A); while miR-374 expression levels were glomerulus>PCT≈PST≈TAL>DCT>CNT/CD (Figure 6B). If observed Ca++ regulation of CLDN14 was mediated through microRNAs, then the experimental conditions used to elicit changes in CLDN14 gene expression would cause reciprocal changes in microRNA expression. In the TAL of mouse kidneys receiving dietary Ca++ variations, low Ca++ diet (II) significantly upregulated miR-9 and miR-374 transcript levels by 1.76-fold and 1.29-fold, respectively (P<0.05, n=5; relative to basal diet I; Figure 6C and D); while high Ca++ diet (III) significantly downregulated miR-9 and miR-374 by 28% and 15%, respectively (P<0.05, n=5; relative to basal diet I; Figure 6C and D). The inverse correlation between microRNA and CLDN14 expression was also evident in cultured MKTAL cells receiving direct extracellular Ca++ variations. Increasing extracellular Ca++ levels progressively repressed the transcript levels of both miR-9 (Figure 6E) and miR-374 (Figure 6F), with statistical significance first reached at 0.5 mM Ca++ (P<0.05, n=3). Maximal repression for both microRNAs was found with the concentration of 3 mM Ca++ (by 62% for miR-9 and by 44% for miR-374; Figure 6E and F), which coincided with maximal induction of CLDN14. Together, these results suggest that extracellular Ca++ regulation of CLDN14 gene expression in the kidney is mediated through changes in miR-9 and miR-374 gene expression.
Figure 6.

Extracellular Ca++ regulation of microRNAs in the kidney. (A) miR-9 and (B) miR-374 transcript levels relative to U6 snRNA transcript levels in microdissected tubular segments. *P<0.05, n=3. (C) miR-9 and (D) miR-374 transcript levels in mouse kidney TALs receiving dietary Ca++ variations. (E) miR-9 and (F) miR-374 transcript levels in MKTAL cells cultured in 0–3 mM Ca++.
CaSR is required for extracellular Ca++ regulation of CLDN14 and microRNAs
CaSR is the principal molecule in the TAL that senses circulating Ca++ changes and regulates its urinary excretion. To provide direct evidence that CaSR was required for Ca++ regulation of CLDN14 and microRNAs in the TAL, we knocked down endogenous CaSR expression in MKTAL cells by RNA interference and sought for deregulation of CLDN14 and microRNAs. A pre-validated siRNA reagent, containing a pool of three target-specific 21 nt siRNA duplexes designed against the mouse CaSR gene (Materials and methods), was transfected into MKTAL cells prior to Ca++ activation. A scrambled siRNA duplex was transfected as negative control. While extracellular Ca++ (3 mM) increased CLDN14 mRNA levels (Figure 7A) and protein levels (Figure 7B) by 2.61-fold and 2.20-fold, respectively (versus 0.1 mM Ca++; P<0.01, n=3) in scrbl-siRNA cells, CaSR-siRNA completely abolished the Ca++ inducing effect on CLDN14 expression (Figure 7A and B). The transcript levels of miR-9 and miR-374 were significantly decreased by Ca++ treatments in scrbl-siRNA cells (miR-9: by 36%, Figure 7C; miR-374: by 22%, Figure 7D; P<0.05, n=3), consistent with their role of silencing CLDN14. CaSR KD decreased the basal levels of both microRNAs. In CaSR-siRNA cells, neither microRNA was further downregulated by Ca++ treatments (Figure 7C and D). While extracellular Ca++ failed to induce any significant effect on miR-374, miR-9 was unexplainably upregulated by Ca++ in the absence of CaSR. The fold of upregulation was small (1.58-fold) but significant (P<0.05, n=3; Figure 7C) for miR-9. It was not known what caused the aberrant miR-9 regulation in the absence of CaSR. Extracellular Ca++ induced cell membrane depolarization devoid of intracellular Ca++ increase normally accompanied by CaSR activation may trigger additional signalling pathways to miR-9. MiR-9 is known to be regulated by several messengers: myc (Ma et al, 2010), alcohol (Pietrzykowski et al, 2008), and aldosterone (Wang et al, 2010). Together, these results indicate that CaSR is required for extracellular Ca++ signalling to gene regulation of the microRNA-CLDN14 axis.
Figure 7.

Role of CaSR in extracellular Ca++ regulation of CLDN14 and microRNAs. (A) CLDN14 mRNA, (B) CLDN14 protein, (C) miR-9 transcript, and (D) miR-374 transcript levels in MKTAL cells transfected with either CaSR siRNA or scrambled siRNA, followed by induction with 3 mM Ca++ versus 0.1 mM Ca++.
Discussion
In this study, we demonstrate that extracellular Ca++, through activation of CaSR, regulates the expression levels of two microRNAs: miR-9 and miR-374, which in turn transduce the extracellular signal to CLDN14 through microRNA-mediated gene silencing. CLDN14 relays the extracellular Ca++ signal to CLDN16–CLDN19, the final effector of Ca++ transport in the kidney, through direct functional modulation of their permeabilities.
Under normal physiological conditions, miR-9 and miR-374 tightly regulate the gene expression level of CLDN14 and protect CLDN16–CLDN19 channel function. The observed association between CLDN14 and hypercalciuric nephrolithiasis (Thorleifsson et al, 2009) can be explained by CLDN14 deregulation that escapes microRNA suppression, inhibits CLDN16–CLDN19 channel permeabilities and phenocopies FHHNC to variable degrees. FHHNC patients (Weber et al, 2001; Konrad et al, 2006) and animal models (Hou et al, 2007, 2009) with CLDN16 or CLDN19 mutations are known to have hypercalciuria, nephrocalcinosis, and nephrolithiasis. CLDN14 deregulation has two distinct origins: cis- or trans-acting. Cis-acting variants include changes in promoters, splicing sites, and microRNA target sites. The miR-9 and miR-374 target sites in the CLDN14 gene are surrounded by four synonymous SNPs that associate with hypercalciuric nephrolithiasis (Thorleifsson et al, 2009; Supplementary Figure S6), suggesting that the linkage disequilibrium (LD) block may contain susceptible genetic variations related to microRNA regulation. Allelic variation in mRNA levels presents another explanation for association of exonic SNPs. Two of the four identified SNPs are located in the last exon of CLDN14 gene (Supplementary Figure S6), which may be associated with abnormally higher levels of CLDN14 mRNA in the kidney (Yan et al, 2002). Trans-acting variants are located in distant genes that alter the transcript levels of a target gene. MiR-9 and miR-374 are trans-acting effectors of the CLDN14 gene. The gene transcription level of miR-9 itself is regulated by the myc and ras oncoproteins (Ma et al, 2010), implicating a potential tumourigenic role for CLDN14 as reported for CLDN2 (Buchert et al, 2010) and CLDN7 (Nübel et al, 2009).
The principal role of CaSR in the kidney is the regulation of Ca++ reabsorption in the TAL. While mostly found in the luminal membrane elsewhere of the nephron, CaSR is located in the basolateral membrane of the TAL, where it senses peritubular Ca++ changes and regulates both transcellular and paracellular electrolyte transports (Riccardi and Brown, 2010). An extensive literature testifies to the suppression of paracellular Ca++ reabsorption by CaSR activation during hypercalcaemia (Desfleurs et al, 1998; Motoyama and Friedman, 2002). CaSR activation also inhibits ROMK channels (Wang et al, 1996, 1997), diminishes transcellular NaCl reabsorption, and produces a ‘Bartter-like’ phenotype (Vargas-Poussou et al, 2002). Several signalling pathways have been revealed underpinning CaSR regulation of transcellular channels, including P-450 metabolites and prostaglandins (Hebert et al, 2007). The microRNAs identified in this study are of critical importance. Owing to the short seed sequence (nucleotides: 2–7) of microRNA, a cognate microRNA regulates multiple target genes. Although this study reported miR-9 and miR-374 convergence onto CLDN14, they could extend CaSR signalling to cellular functions beyond the paracellular channel and organ functions beyond the kidney. The regulation of microRNA by CaSR signalling may occur on several layers: microRNA transcription, processing, or degradation (Krol et al, 2010). The promoters of both miR-9 (miR-9-3 locus) and miR-374 genes contain a canonical myc-binding site (E-box: CACGTG). The transcription of miR-9-3 is upregulated by myc in human breast cancer cells (Ma et al, 2010); miR-421/-374 cluster is upregulated by myc in HeLa cells although miR-374 itself has not been measured (Hu et al, 2010). Genetic ablation of Dicer, a nuclease required for microRNA processing, in the proximal tubule (Wei et al, 2010) and the glomerular podocyte (Harvey et al, 2008) has demonstrated a role for microRNA processing in renal pathophysiology. It is not known whether myc or Dicer is directly involved in CaSR signalling.
CLDN14 physically interacts with CLDN16 and directly blocks its cation permeability. Our data are consistent with a previous finding of CLDN14 as a non-selective cation blocker in kidney MDCK cells (Ben-Yosef et al, 2003). The paracellular barrier function of CLDN14 also underlies its physiological role in the inner ear (Ben-Yosef et al, 2003). CLDN14 showed strong homomeric interaction on our yeast 2-hybrid reporter assays (Figure 3A). Freeze-fracture replicas revealed well-developed networks of TJ strands in CLDN14-expressing fibroblast cells (Van Itallie et al, 2005), suggesting that CLDN14 is capable of self-assembly into TJ. Although CLDN14 does not physically interact with CLDN19, our biochemical data suggest that CLDN14 integrates into CLDN16–CLDN19 channel to form a higher oligomeric complex with novel physiological signature. Using Brownian dynamics simulations, a single-pore model has been suggested for claudin channel structure (Yu et al, 2009). The channel pore is formed by two haemichannels located in the TJ of adjacent cells, which has a 6.5-Å diameter cylindrical shape and charged side chain on the conserved residue-65. The channel conductance varies with the effective charge valence on the side chain of residue-65 (Yu et al, 2009). CLDN14 has a non-charged residue-glutamine at position-65 (Supplementary Figure S7), which will reduce the effective charge density of CLDN16 channel pore (D65: −1e → 0) once CLDN14 cis associates with CLDN16, leading to decreases in cation permeation.
Materials and methods
Reagents, antibodies, cell lines, and animals
The following antibodies were used in this study: rabbit polyclonal anti-THP (Biomedical Technologies); rabbit polyclonal anti-Thiazide-sensitive NaCl cotransporter (NCC) (Chemicon); rabbit polyclonal anti-CLDN1 (Zymed Laboratories); rabbit polyclonal anti-CLDN14 (from Dr Tamar Ben-Yosef); rabbit polyclonal anti-CLDN16 (against SYSAPRTETAKMYAVDTRV); rabbit polyclonal anti-CLDN19 (against NSIPQPYRSGPSTAAREYV); goat polyclonal anti-aquaporin-2 (AQP2) (Santa Cruz Biotech); mouse monoclonal anti-occludin antibodies (from Zymed Laboratories). Mouse MKTAL cells (from Soline Bourgeois) and human HEK293 cells (from Joan Brugge) were cultured in DMEM (Invitrogen) supplemented with 10% FBS, penicillin/streptomycin, and 1 mM sodium pyruvate. All mice were bred and maintained according to the Washington University animal research requirements, and all procedures were approved by the Institutional Animal Research and Care committee. Wild-type C57BL/6 mice were from Charles River Laboratory. The CLDN14+/lacZ reporter/KO mice were from Dr Tamar Ben-Yosef and backcrossed to C57BL/6 background for seven generations.
Dietary manipulation of Ca++ in experimental animals
In all, 7–8-week-old female mice (strain: C57BL/6) from the experimental groups I–III were given the following three dietary treatments for six consecutive days:
Basal diet: 0.61%. Ca++ (TestDiet #5755);
Low Ca++ diet: 0 Ca++ (TestDiet #5855);
High Ca++ diet: 5% Ca++ (TestDiet #5AVB).
All animals had free access to water and were housed under a 12-h light cycle. Blood samples were taken by cardiac puncture rapidly after initiation of terminal anaesthesia and centrifuged at 4°C for 10 min. Kidney tissues were dissected out and immediately frozen at −80°C.
Animal metabolic studies
Age (9–10 weeks old) and sex (male) matched wild-type and CLDN14 KO mice were housed individually in metabolic cages (Harvard Apparatus) with free access to water and food for 24 h. Urine was collected under mineral oil. The plasma (P) and urine (U) electrolyte levels were determined with the Roche Cobas clinical analyzer (Roche Diagnostics). The creatinine levels were measured with an enzymatic method that was independent of plasma chromogens (Himmerkus et al, 2008). The fractional excretion of electrolytes was calculated using the following equation FEion=V × Uion/(GFR × Pion), where GFR was calculated according to the clearance rate of creatinine (GFR=V × Ucreatinine/Pcreatinine).
Establishing primary cultures of mouse TAL cells
We used an immunomagnetic separation method to isolate the TAL cells from the mouse kidney (Hou et al, 2009). Antibodies against the TAL cell-specific surface antigen, THP, were coated onto the paramagnetic polystyrene beads (Dynabeads M-280; Dynal), allowing immunoprecipitation of the TAL cells from collagenase-digested mouse kidneys. The isolated cells were plated in DMEM supplemented with 10% FBS, penicillin/streptomycin, and 1 mM sodium pyruvate for 16 h, followed by immediate transfection with antagomirs.
Preparation of low Ca++ cell culture medium
The Earle's Balanced Salt Solution (EBSS; Invitrogen) containing (117.24 mM NaCl, 5.33 mM KCl, 26.19 mM NaHCO3, 1.01 mM NaH2PO4, 0.70 mM MgCl2, and 5.56 mM glucose) was supplemented with the MEM amino acids solution, the MEM non-essential amino acids solution, the MEM vitamin solution, L-glutamine, 1 mM sodium pyruvate, penicillin/streptomycin, and 1% FBS. For determining Ca++ effects on gene expression, MKTAL cells were cultured in EBSS supplemented with the indicated concentrations of Ca++ for 16 h. For examining PTH effects, MKTAL cells were cultured in EBSS supplemented with the indicated concentrations of human recombinant PTH (1–84; Sigma) for 16 h.
Bioinformatical analyses of mRNA and miRNA
The transcripts of CLDN14 gene are alternatively spliced, generating five mRNA variants in human: (1) NM_144492, (2) NM_012130, (3) NM_001146077, (4) NM_001146078, and (5) NM_001146079; three variants in mouse: (1) NM_019500, (2) NM_001165925, and (3) NM_001165926; and one variant in rat: NM_001013429. For predictions of miRNAs targeting CLDN14:3′-UTR (mouse: 171 bp (AF314089); human: 183 bp (AF314090)) based on sequence complementarities and cross-species conservation, four algorithms were used: TargetScan, miRanda, Diana microT, and MirTarget2.
MicroRNA and mRNA quantification
Total RNA including microRNA was extracted using Trizol (Invitrogen). Reverse transcription was performed on 1 μg of total RNA using miRNA-specific RT primer and TaqMan miRNA reverse transcription kit (Invitrogen). Real-time PCR amplification was performed on reverse-transcribed miRNA using TaqMan Universal PCR Master Mix, No AmpErase UNG (Invitrogen) and Eppendorf Realplex 2S real-time PCR system. Results were expressed as 2−ΔCt values with ΔCT=CtmiRNA−CtU6snRNA. Cellular mRNA was reverse transcribed using the Superscript-III kit (Invitrogen), followed by real-time PCR amplification using SYBR Green PCR Master Mix (Bio-Rad) with the primer pairs: CLDN14, ACCCTGCTCTGCTTATCC and GCACGGTTGTCCTTGTAG; CLDN16, CAAACGCTTTTGATGGGATTC and TTTGTGGGTCATCAGGTAGG; β-actin, CGTTGACATCCGTAAAGAC and TGGAAGGTGGACAGTGAG. Results were expressed as 2−ΔCt values with ΔCT=CtCLDN−Ctβ-actin.
Luciferase reporter assay
The pMir-Reporter construct was generated by inserting the entire mouse CLDN14:3′-UTR sequence (AF314089: 171 bp from the stop codon to the first polyA site) or human CLDN14:3′-UTR sequence (AF314090: 183 bp from the stop codon to the first polyA site) into the pMIR-REPORT-Luciferase vector (Clontech) downstream of the luciferase gene using Spe1 and Sac1. Deletions of miR-9 (CCAAAG) and miR-374 (AUUAUA) binding sites in human CLDN14:3′-UTR were generated using site-directed mutagenesis (Stratagene). The pMir-Reporter (500 ng), the pGL4.74 Renilla luciferase control vector (500 ng; Promega), and 30 pmol of scrambled miRNA, miR-9, or miR-374 precursor (Invitrogen) were co-transfected to HEK293 cells in 12-well culture dishes using Lipofectamine 2000 (Invitrogen). Twenty-four hours after transfection, firefly and Renilla luciferase activities were measured with a chemiluminescence reporter assay system—Dual Glo (Promega) in a GLOMAX Luminometer (Promega).
Antagomir assay
Antagomirs for miR-9, miR-374, and scrambled control miRNA were designed and synthesized by Exiqon using locked nucleic acids (LNAs). In all, 60 pmol of each antagomir (or 30 pmol anti-miR-9+30 pmol anti-miR-374 in synergistic assays) was transfected to MKTAL cells in 12-well culture dishes using Lipofectamine 2000 (Invitrogen). Twenty-four hours after transfection, total cellular RNAs or membrane proteins were collected.
CaSR knockdown by siRNA
Pre-validated Silencer Select siRNAs were designed and synthesized by Ambion. A pool of three target-specific 21 nt siRNA duplexes were designed against the coding region of mouse CaSR gene (AF110178). A scrambled siRNA duplex was used as negative control. Twenty-four hours prior to Ca++ activation, 50 pmol of either CaSR siRNA or scrambled siRNA was transfected to MKTAL cells in 12-well culture dishes with Lipofectmine 2000. To improve transfection efficiency, DMEM was used during transfection. At the end of transfection, cells were washed for three times in PBS and switched to the low Ca++ medium (EBSS) followed by Ca++ activation.
Coimmunoprecipitation
HEK293 cells expressing CLDN14 with CLDN16 or CLDN19 were lysed in 50 mM Tris (pH 8.0) by 25–30 repeated passages through a 25-gauge needle, followed by centrifugation at 5000 g. The membranes of lysed cells were extracted using CSK buffer (150 mM NaCl; 1% Triton X-100; 50 mM Tris, pH 8.0; and protease inhibitors). The membrane extract was precleared by incubation with protein A/G-sepharose (Sigma-Aldrich) prior to coimmunoprecipitation. The precleared membrane extract was incubated for 16 h at 4°C with anti-CLDN14, anti-CLDN16, anti-CLDN19, anti-CLDN1, and anti-occludin antibodies. Antibody-bound material was pelleted with protein A/G-sepharose, washed three times with CSK buffer, and detected by immunoblotting.
LacZ reporter assay in mouse kidney
CLDN14+/lacZ mouse kidneys were fixed with 4% paraformaldehyde at 4°C overnight, washed three times in PBS, cryoprotected for 24 h in 30% sucrose in PBS, and embedded in OCT prior to cryostat sectioning. Cryostat sections (10 μm) were stained for β-galactosidase activity using the β-Gal staining kit (Invitrogen), followed by incubation with anti-THP antibody (diluted 1:200) and FITC-labelled secondary antibody (diluted 1:200). Epifluorescence images were taken with a Nikon 80i photomicroscope equipped with a DS-Qi1Mc digital camera. All images were converted to JPEG format and arranged using Photoshop CS4 (Adobe).
Y2H membrane protein interaction assay
The Y2H membrane protein interaction assay (MoBiTec Molecular Biotechnology) for analysing the specific claudin interactions (mouse CLDN14 (AF314089), human CLDN16 (AF152101), and human CLDN19 (BC030524)) has been described by Hou et al (2008). The assay was performed by transforming the yeast strain NMY51 with 1.5 μg of bait and prey vectors. Transformed yeast cells were plated on dropout media lacking leucine and tryptophan (SD-LW) and incubated for growth of positive transformants. Three to six independent positive transformants were then selected and resuspended in 50 ml of 0.9% NaCl buffer; 5 μl of each suspension was spotted onto SD-LWHA media. Growth of colonies on the selective medium was scored as positive for interaction. To further verify the positive interactions, β-galactosidase activity was performed using a filter lift assay (MoBiTec GmbH).
Retroviral expression of claudins
The following full-length mammalian claudins were cloned into the retroviral vector pQCXIN (Clontech): mouse CLDN14 (AF314089), human CLDN16 (AF152101), and human CLDN19 (BC030524). VSV-G pseudotyped retroviruses were produced in HEK293 cells and used to infect LLC-PK1 cells at a fixed titre of 1 × 10⁶ CFU/ml, as described previously (Hou et al, 2008). Cells co-expressing CLDN14, 16, and 19 were generated with sequential viral infections. Infected LLC-PK1 cells were seeded onto Transwell plates to allow polarization. On day 9 post polarization, cell monolayers were subjected to electrophysiological measurements and immunostained to visualize claudin localization.
Electrophysiological measurements
Electrophysiological recordings were performed on epithelial monolayers in an Ussing chamber (Harvard Apparatus #U9926/T) that had been modified to adapt Transwells (Hou et al, 2005, 2008). Voltage and current clamps were performed using the EC-800 epithelial amplifier (Warner Instruments) with Ag/AgCl electrodes and an Agarose bridge containing 3 M KCl. The TER was measured under the ‘Resistance’ mode by passing a constant bipolar current pulse (Io) of 10 μA (<2 kΩ) or 1 μA (>2 kΩ) through the epithelium and recording voltage deflection (Vo). Ohm's law was used to calculate TER from Vo and Io. The series resistance (Rs) was measured in absence of the epithelium and subtracted from TER. Dilution potentials (PD) were measured under the ‘Current Clamp’ mode by clamping the transepithelial current to zero and recording the equilibrium voltage generated by NaCl diffusion. All experiments were conducted at 37°C. Electrical potentials obtained from blank inserts were subtracted from those obtained from inserts with epithelial monolayers. 1 mM ouabain was included in the basolateral perfusant to inhibit transcellular ion conductance. The ion permeability ratio (η) for the monolayer was calculated from the dilution potential using the Goldman-Hodgkin-Katz equation. The absolute permeabilities of Na+ (PNa) and Cl− (PCl) were calculated by using the Kimizuka–Koketsu equation. The relative permeability of other cations (M+) to Na+ (γ=PM/PNa) was then calculated from the bi-ionic potential, according to the following equation:
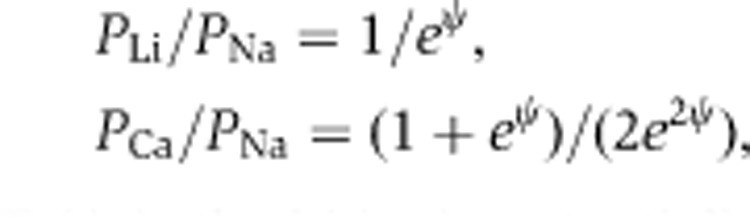
where ψ=eψ/kT (ψ is the bi-ionic potential).
Statistical analyses
The significance of differences between groups was tested by ANOVA (Statistica 6.0; Statsoft). When the all-effect F-value was significant (P<0.05), post hoc analysis of differences between individual groups was made with the Newman–Keuls test. Values were expressed as mean±s.e.m., unless otherwise stated.
Supplementary Material
Acknowledgments
We thank Drs Tamar Ben-Yosef (Technion Israel Institute of Technology, Haifa, Israel), Soline Bourgeois (Université Paris VI, France), and Joan Brugge (Harvard Medical School, Cambridge, MA) for kindly sharing reagents, cell, and animal models. This work was supported by National Institutes of Health Grants RO1DK084059 and P30 DK079333 (to JH), American Heart Association Grant 0930050N (to JH), PE Kempkes stiftung 2008 (to VR), Deutsche Forschungs Gemeinschaft SFB-593, and PE Kempkes Foundation Grant 10/08 (to AR).
Author contributions: YG, VR, NH, JZ, and JH performed experiments; YG, VR, AR, MB, and JH analysed data; JH designed experiments and wrote the paper.
Footnotes
The authors declare they have no conflict of interest.
References
- Ben-Yosef T, Belyantseva IA, Saunders TL, Hughes ED, Kawamoto K, Van Itallie CM, Beyer LA, Halsey K, Gardner DJ, Wilcox ER, Rasmussen J, Anderson JM, Dolan DF, Forge A, Raphael Y, Camper SA, Friedman TB (2003) Claudin 14 knockout mice, a model for autosomal recessive deafness DFNB29, are deaf due to cochlear hair cell degeneration. Hum Mol Genet 12: 2049–2061 [DOI] [PubMed] [Google Scholar]
- Bourgeois S, Rossignol P, Grelac F, Chalumeau C, Klein C, Laghmani K, Chambrey R, Bruneval P, Duong JP, Poggioli J, Houillier P, Paillard M, Kellermann O, Froissart M (2003) Differentiated thick ascending limb (TAL) cultured cells derived from SV40 transgenic mice express functional apical NHE2 isoform: effect of nitric oxide. Pflugers Arch 446: 672–683 [DOI] [PubMed] [Google Scholar]
- Buchert M, Papin M, Bonnans C, Darido C, Raye WS, Garambois V, Pélegrin A, Bourgaux JF, Pannequin J, Joubert D, Hollande F (2010) Symplekin promotes tumorigenicity by up-regulating claudin-2 expression. Proc Natl Acad Sci USA 107: 2628–2633 [DOI] [PMC free article] [PubMed] [Google Scholar]
- Desfleurs E, Wittner M, Simeone S, Pajaud S, Moine G, Rajerison R, Di Stefano A (1998) CaSR: regulation of electrolyte transport in the thick ascending limb of Henle’s loop. Kidney Blood Press Res 21: 401–412 [DOI] [PubMed] [Google Scholar]
- Elkouby-Naor L, Abassi Z, Lagziel A, Gow A, Ben-Yosef T (2008) Double gene deletion reveals lack of cooperation between claudin 11 and claudin 14 tight junction proteins. Cell Tissue Res 333: 427–438 [DOI] [PMC free article] [PubMed] [Google Scholar]
- Furuse M, Sasaki H, Tsukita S (1999) Manner of interaction of heterogeneous claudin species within and between tight junction strands. J Cell Biol 147: 891–903 [DOI] [PMC free article] [PubMed] [Google Scholar]
- Gamba G, Friedman PA (2009) Thick ascending limb: the Na(+):K (+):2Cl (−) co-transporter, NKCC2, and the calcium-sensing receptor, CaSR. Pflugers Arch 458: 61–76 [DOI] [PMC free article] [PubMed] [Google Scholar]
- Greger R (1985) Ion transport mechanisms in thick ascending limb of Henle's loop of mammalian nephron. Physiol Rev 65: 760–797 [DOI] [PubMed] [Google Scholar]
- Gregory PA, Bert AG, Paterson EL, Barry SC, Tsykin A, Farshid G, Vadas MA, Khew-Goodall Y, Goodall GJ (2008) The miR-200 family and miR-205 regulate epithelial to mesenchymal transition by targeting ZEB1 and SIP1. Nat Cell Biol 10: 593–601 [DOI] [PubMed] [Google Scholar]
- Harvey SJ, Jarad G, Cunningham J, Goldberg S, Schermer B, Harfe BD, McManus MT, Benzing T, Miner JH (2008) Podocyte-specific deletion of dicer alters cytoskeletal dynamics and causes glomerular disease. J Am Soc Nephrol 19: 2150–2158 [DOI] [PMC free article] [PubMed] [Google Scholar]
- Hebert SC, Andreoli TE (1986) Ionic conductance pathways in the mouse medullary thick ascending limb of Henle. The paracellular pathway and electrogenic Cl− absorption. J Gen Physiol 87: 567–590 [DOI] [PMC free article] [PubMed] [Google Scholar]
- Hebert SC, Riccardi D, Geibel J (2007) The calcium-sensing receptor. In The Kidney: Physiology and Pathophysiology, Alpern RJ, Hebert SC (eds), 4th edn, pp 1785–1882. Amsterdam: Elsevier [Google Scholar]
- Himmerkus N, Shan Q, Goerke B, Hou J, Goodenough DA, Bleich M (2008) Salt and acid-base metabolism in claudin-16 knockdown mice: impact for the pathophysiology of FHHNC patients. Am J Physiol Renal Physiol 295: F1641–F1647 [DOI] [PMC free article] [PubMed] [Google Scholar]
- Hou J, Paul DL, Goodenough DA (2005) Paracellin-1 and the modulation of ion selectivity of tight junctions. J Cell Sci 118: 5109–5118 [DOI] [PubMed] [Google Scholar]
- Hou J, Renigunta A, Gomes AS, Hou M, Paul DL, Waldegger S, Goodenough DA (2009) Claudin-16 and claudin-19 interaction is required for their assembly into tight junctions and for renal reabsorption of magnesium. Proc Natl Acad Sci USA 106: 15350–15355 [DOI] [PMC free article] [PubMed] [Google Scholar]
- Hou J, Renigunta A, Konrad M, Gomes AS, Schneeberger EE, Paul DL, Waldegger S, Goodenough DA (2008) Claudin-16 and claudin-19 interact and form a cation-selective tight junction complex. J Clin Invest 118: 619–628 [DOI] [PMC free article] [PubMed] [Google Scholar]
- Hou J, Shan Q, Wang T, Gomes AS, Yan Q, Paul DL, Bleich M, Goodenough DA (2007) Transgenic RNAi depletion of claudin-16 and the renal handling of magnesium. J Biol Chem 282: 17114–17122 [DOI] [PubMed] [Google Scholar]
- Hu H, Du L, Nagabayashi G, Seeger RC, Gatti RA (2010) ATM is down-regulated by N-Myc-regulated microRNA-421. Proc Natl Acad Sci USA 107: 1506–1511 [DOI] [PMC free article] [PubMed] [Google Scholar]
- Huntzinger E, Izaurralde E (2011) Gene silencing by microRNAs: contributions of translational repression and mRNA decay. Nat Rev Genet 12: 99–110 [DOI] [PubMed] [Google Scholar]
- Kiuchi-Saishin Y, Gotoh S, Furuse M, Takasuga A, Tano Y, Tsukita S (2002) Differential expression patterns of claudins, tight junction membrane proteins, in mouse nephron segments. J Am Soc Nephrol 13: 875–886 [DOI] [PubMed] [Google Scholar]
- Konrad M, Schaller A, Seelow D, Pandey AV, Waldegger S, Lesslauer A, Vitzthum H, Suzuki Y, Luk JM, Becker C, Schlingmann KP, Schmid M, Rodriguez-Soriano J, Ariceta G, Cano F, Enriquez R, Juppner H, Bakkaloglu SA, Hediger MA, Gallati S et al. (2006) Mutations in the tight junction gene claudin 19 (CLDN19) are associated with renal magnesium wasting, renal failure, and severe ocular involvement. Am J Hum Genet 79: 949–957 [DOI] [PMC free article] [PubMed] [Google Scholar]
- Krol J, Loedige I, Filipowicz W (2010) The widespread regulation of microRNA biogenesis, function and decay. Nat Rev Genet 11: 597–610 [DOI] [PubMed] [Google Scholar]
- Krutzfeldt J, Rajewsky N, Braich R, Rajeev KG, Tuschl T, Manoharan M, Stoffel M (2005) Silencing of microRNAs in vivo with ‘antagomirs’. Nature 438: 685–689 [DOI] [PubMed] [Google Scholar]
- Ma L, Young J, Prabhala H, Pan E, Mestdagh P, Muth D, Teruya-Feldstein J, Reinhardt F, Onder TT, Valastyan S, Westermann F, Speleman F, Vandesompele J, Weinberg RA (2010) miR-9, a MYC/MYCN-activated microRNA, regulates E-cadherin and cancer metastasis. Nat Cell Biol 12: 247–256 [DOI] [PMC free article] [PubMed] [Google Scholar]
- Mineta K, Yamamoto Y, Yamazaki Y, Tanaka H, Tada Y, Saito K, Tamura A, Igarashi M, Endo T, Takeuchi K, Tsukita S (2011) Predicted expansion of the claudin multigene family. FEBS Lett 585: 606–612 [DOI] [PubMed] [Google Scholar]
- Motoyama HI, Friedman PA (2002) CaSR regulation of PTH dependent calcium absorption by mouse cortical ascending limbs. Am J Physiol Renal Physiol 283: F399–F406 [DOI] [PubMed] [Google Scholar]
- Nübel T, Preobraschenski J, Tuncay H, Weiss T, Kuhn S, Ladwein M, Langbein L, Zöller M (2009) Claudin-7 regulates EpCAM-mediated functions in tumor progression. Mol Cancer Res 7: 285–299 [DOI] [PubMed] [Google Scholar]
- Pietrzykowski AZ, Friesen RM, Martin GE, Puig SI, Nowak CL, Wynne PM, Siegelmann HT, Treistman SN (2008) Posttranscriptional regulation of BK channel splice variant stability by miR-9 underlies neuroadaptation to alcohol. Neuron 59: 274–287 [DOI] [PMC free article] [PubMed] [Google Scholar]
- Riccardi D, Brown EM (2010) Physiology and pathophysiology of the calcium-sensing receptor in the kidney. Am J Physiol Renal Physiol 298: F485–F499 [DOI] [PMC free article] [PubMed] [Google Scholar]
- Simon DB, Lu Y, Choate KA, Velazquez H, Al-Sabban E, Praga M, Casari G, Bettinelli A, Colussi G, Rodriguez-Soriano J, McCredie D, Milford D, Sanjad S, Lifton RP (1999) Paracellin-1, a renal tight junction protein required for paracellular Mg2+ resorption. Science 285: 103–106 [DOI] [PubMed] [Google Scholar]
- Stevenson BR, Goodenough DA (1984) Zonulae occludentes in junctional complex enriched fractions from mouse liver: preliminary morphological and biochemical characterization. J Cell Biol 98: 1209–1221 [DOI] [PMC free article] [PubMed] [Google Scholar]
- Thorleifsson G, Holm H, Edvardsson V, Walters GB, Styrkarsdottir U, Gudbjartsson DF, Sulem P, Halldorsson BV, de Vegt F, d’Ancona FC, den Heijer M, Franzson L, Christiansen C, Alexandersen P, Rafnar T, Kristjansson K, Sigurdsson G, Kiemeney LA, Bodvarsson M, Indridason OS et al. (2009) Sequence variants in the CLDN14 gene associate with kidney stones and bone mineral density. Nat Genet 41: 926–930 [DOI] [PubMed] [Google Scholar]
- Tsukita S, Furuse M, Itoh M (2001) Multifunctional strands in tight junctions. Nat Rev Mol Cell Biol 2: 285–293 [DOI] [PubMed] [Google Scholar]
- Van Itallie CM, Gambling TM, Carson JL, Anderson JM (2005) Palmitoylation of claudins is required for efficient tight-junction localization. J Cell Sci 118: 1427–1436 [DOI] [PubMed] [Google Scholar]
- Vargas-Poussou R, Huang C, Hulin P, Houillier P, Jeunemaître X, Paillard M, Planelles G, Déchaux M, Miller RT, Antignac C (2002) Functional characterization of a calcium-sensing receptor mutation in severe autosomal dominant hypocalcemia with a Bartter-like syndrome. J Am Soc Nephrol 13: 2259–2266 [DOI] [PubMed] [Google Scholar]
- Wang K, Long B, Zhou J, Li PF (2010) miR-9 and NFATc3 regulate myocardin in cardiac hypertrophy. J Biol Chem 285: 11903–11912 [DOI] [PMC free article] [PubMed] [Google Scholar]
- Wang WH, Lu M, Balazy M, Hebert SC (1997) Phospholipase A2 is involved in mediating the effect of extracellular Ca2+ on apical K+ channels in rat TAL. Am J Physiol Renal Physiol 273: F421–F429 [DOI] [PubMed] [Google Scholar]
- Wang WH, Lu M, Hebert SC (1996) Cytochrome P-450 metabolites mediate extracellular Ca2+-induced inhibition of apical K+ channels in the TAL. Am J Physiol Cell Physiol 271: C103–C111 [DOI] [PubMed] [Google Scholar]
- Weber S, Schneider L, Peters M, Misselwitz J, Rönnefarth G, Böswald M, Bonzel KE, Seeman T, Suláková T, Kuwertz-Bröking E, Gregoric A, Palcoux JB, Tasic V, Manz F, Schärer K, Seyberth HW, Konrad M (2001) Novel paracellin-1 mutations in 25 families with familial hypomagnesemia with hypercalciuria and nephrocalcinosis. J Am Soc Nephrol 12: 1872–1881 [DOI] [PubMed] [Google Scholar]
- Wei Q, Bhatt K, He HZ, Mi QS, Haase VH, Dong Z (2010) Targeted deletion of Dicer from proximal tubules protects against renal ischemia-reperfusion injury. J Am Soc Nephrol 21: 756–761 [DOI] [PMC free article] [PubMed] [Google Scholar]
- Wilcox ER, Burton QL, Naz S, Riazuddin S, Smith TN, Ploplis B, Belyantseva I, Ben-Yosef T, Liburd NA, Morell RJ, Kachar B, Wu DK, Griffith AJ, Riazuddin S, Friedman TB (2001) Mutations in the gene encoding tight junction claudin-14 cause autosomal recessive deafness DFNB29. Cell 104: 165–172 [DOI] [PubMed] [Google Scholar]
- Wong V (1997) Phosphorylation of occludin correlates with occludin localization and function at the tight junction. Am J Physiol 273: C1859–C1867 [DOI] [PubMed] [Google Scholar]
- Yan H, Yuan W, Velculescu VE, Vogelstein B, Kinzler KW (2002) Allelic variation in human gene expression. Science 297: 1143. [DOI] [PubMed] [Google Scholar]
- Yoo AS, Staahl BT, Chen L, Crabtree GR (2009) MicroRNA-mediated switching of chromatin-remodelling complexes in neural development. Nature 460: 642–646 [DOI] [PMC free article] [PubMed] [Google Scholar]
- Yu AS, Cheng MH, Angelow S, Günzel D, Kanzawa SA, Schneeberger EE, Fromm M, Coalson RD (2009) Molecular basis for cation selectivity in claudin-2-based paracellular pores: identification of an electrostatic interaction site. J Gen Physiol 133: 111–127 [DOI] [PMC free article] [PubMed] [Google Scholar]
- Zheng B, Cantley LC (2007) Regulation of epithelial tight junction assembly and disassembly by AMP-activated protein kinase. Proc Natl Acad Sci USA 104: 819–822 [DOI] [PMC free article] [PubMed] [Google Scholar]
Associated Data
This section collects any data citations, data availability statements, or supplementary materials included in this article.