

Abstract
The simultaneous presentation of a stimulus in one sensory modality often enhances target detection in another sensory modality, but the neural mechanisms that govern these effects are still under investigation. Here, we test a hypothesis proposed in the neurophysiological literature: that auditory facilitation of visual-target detection operates through cross-sensory phase reset of ongoing neural oscillations (Lakatos et al., 2009). To date, measurement limitations have prevented this potentially powerful neural mechanism from being directly linked with its predicted behavioral consequences. The present experiment uses a psychophysical approach in humans to demonstrate, for the first time, stimulus-locked periodicity in visual-target detection, following a temporally informative sound. Our data further demonstrate that periodicity in behavioral performance is strongly influenced by the probability of audiovisual co-occurrence. We argue that fluctuations in visual-target detection result from cross-sensory phase reset, both at the moment it occurs and persisting for seconds thereafter. The precise frequency at which this periodicity operates remains to be determined through a method that allows for a higher sampling rate.
Introduction
Sounds have been repeatedly shown to improve the detection of co-occurring visual targets (Odgaard et al., 2003; Lippert et al., 2007; Van der Burg et al., 2008b; Fiebelkorn et al., 2011). Some researchers have suggested that this multisensory enhancement of visual-target detection operates through a cognitive, attention-related mechanism (Odgaard et al., 2003; Lippert et al., 2007), whereas others have suggested that it operates through low-level, multisensory connections between early sensory cortices (Stein et al., 1996; Van der Burg et al., 2008b). Here, we tested the hypothesis that auditory facilitation of visual-target detection results from an interaction between top-down attention and ongoing neural oscillations.
Moment-to-moment cortical excitability fluctuates with the phase of ongoing oscillations (Monto et al., 2008; Busch et al., 2009; Mathewson et al., 2009). Several studies have now demonstrated that cortical spike timing aligns with the phase of low-frequency oscillations (1–4 Hz), with action potentials most likely to occur during high-excitability phases (Montemurro et al., 2008; Kayser et al., 2009; Whittingstall and Logothetis, 2009). As a consequence, stimuli that align with high-excitability phases—when neurons are closer to their firing threshold—are more likely to be detected than stimuli that align with low-excitability phases. The response of the brain to external stimuli is therefore not only a function of stimulus properties but also a function of the internal dynamics of the brain.
Recent data from nonhuman primates reveal that the influence of ongoing oscillations on perception in not merely passive, but that attention can modulate the phase of ongoing oscillations (Lakatos et al., 2008, 2009; Besle et al., 2011). In particular, Lakatos et al. (2009) described a mechanism, referred to as cross-sensory phase reset, in which attending to a single stimulus synchronizes ongoing oscillations across functionally interconnected cortical regions, including multiple sensory cortices. Attending to a sound, for example, can reset the phase of ongoing oscillations in visual cortex, thus potentially increasing subthreshold depolarization. This type of mechanism, through which the presentation of a stimulus in one modality influences baseline cortical excitability in another modality, might underlie the auditory facilitation of visual-target detection in humans. To date, however, the neurophysiological literature has been unable to directly link cross-sensory phase reset with its behavioral consequences (see Materials and Methods).
Here, we present the results of an experiment designed to bridge the gap between cross-sensory phase reset and behavioral performance. If attending to a temporally informative sound consistently resets the phase of ongoing oscillations, visual-target detection at subsequent time points should reflect this underlying, stimulus-locked oscillatory activity. We therefore predicted that there would be periodicity in behavioral performance that would persist for seconds following the presentation of a sound. To test the dependence of our results on endogenous factors such as top-down attentional control (Lippert et al., 2007; Lakatos et al., 2009), we also manipulated the probability that a low-contrast visual target would co-occur with the sound. We predicted that changing the probabilistic context would affect how attention was deployed, and therefore influence whether ongoing oscillations were reset such that co-occurring visual targets aligned with high-excitability phases.
Materials and Methods
Participants
Eight neurologically normal volunteers participated in each condition of the experiment (mean age, 30.3 ± 6.1 years; five females; three left-handed), and data from all subjects were included in the analyses. Two participants completed both conditions, and the remaining 12 subjects completed one condition each. The Institutional Review Boards of The City College of New York and Albert Einstein College of Medicine approved the experimental procedures. Written informed consent was obtained from all subjects before data collection, in line with the Declaration of Helsinki.
Stimuli and task
Measurement limitations have prevented cross-sensory phase reset from being linked with its behavioral consequences. Simply put, phase alignment across trials might result from either (1) phase reset of ongoing oscillations or (2) a transient sensory response, which is superimposed on ongoing oscillatory activity (Makeig et al., 2004; Shah et al., 2004; Sauseng et al., 2007; Martínez-Montes et al., 2008). In a unisensory context, in which, for example, a sound is presented and cross-sensory phase reset is measured in early visual cortices (Lakatos et al., 2009), there is no measurement limitation because there is no transient sensory response evoked in visual cortex (i.e., there is no visual stimulus). In a multisensory context, however, in which transient sensory responses are evoked in both auditory and visual cortices (i.e., when a sound and a visual stimulus are simultaneously presented), it becomes difficult to establish whether cross-sensory phase reset occurred in either cortical region. It has thus yet to be proven that cross-sensory phase reset resulting from a stimulus presented in one sensory modality (e.g., a sound) has behavioral consequences for a task in which potential targets are presented in a second sensory modality (e.g., near-threshold visual targets). To bypass these measurement issues that complicate the detection of phase reset in neurophysiological data, we devised a task for which the behavioral results themselves could be used to probe for cross-sensory phase reset.
Figure 1a provides a schematic of the experimental design. A sound was presented at the beginning of each trial, and a near-threshold visual target was presented either with the sound or at 1 of 12 time points at 500 ms intervals up to 6000 ms after the sound. If the sound presented at the beginning of each trial consistently reset the phase of ongoing oscillations in visual cortex, then phases should have aligned across trials. It follows that the timing of visual-target presentation relative to the sound should influence the likelihood of visual-target detection, leading to a periodic pattern of behavioral performance (Fig. 1a). We thus used hit rates to probe for underlying oscillatory activity, time-locked to a temporally informative sound.
Figure 1.

A schematic of the experimental design. a, On each trial, a 1–3 s SOA was followed by a 1000 Hz tone. A visual stimulus was presented either simultaneously with the tone, or at 1 of 12 other evenly spaced time points after the tone (0.5, 1, 1.5, up to 6 s). Catch trials (CT) were also included to estimate false alarm rates. Participants were told to respond whenever they saw a visual stimulus. It was hypothesized that consistent phase reset of underlying neural activity (relative to the tone) would be revealed through periodicity in behavioral performance. b, For the equiprobable condition, the visual stimulus was equally likely to occur with the tone as it was to occur at each of the other 12 time points. For the AV-dominant condition, the visual stimulus was four times more likely to occur with the tone as it was to occur at each of the other 12 time points.
We chose a 2 Hz sampling rate to test for the existence of periodicity in behavioral performance based on several factors, including pilot data, previous literature, and our a priori goal, which was to demonstrate a behavioral correlate of cross-sensory phase reset. Pilot data, collected using different combinations of sampling rates and trial durations, suggested that the most apparent and consistent oscillation to emerge in observed hit rates was a low-delta frequency around ∼1 Hz. This is consistent with previous research, which has demonstrated that sensory selection can occur through temporal modulation of low-delta frequencies (Lakatos et al., 2007, 2008; Schroeder and Lakatos, 2009; Besle et al., 2011). Higher frequencies, particularly those in the theta range (4–7 Hz), have also been shown to influence behavioral performance (Busch et al., 2009; Mathewson et al., 2009), but no oscillations in that range were observed in the pilot data. The absence of these higher-frequency oscillations likely reflects limitations of our psychophysical approach, rather than cross-sensory phase reset being truly limited to low-delta oscillations. Lower frequencies (such as those in the low-delta range) generally have greater power than higher frequencies (such as those in the theta range), and their influence on visual-target detection is therefore more likely to emerge from noise in behavioral data (Bak et al., 1987; Van Orden et al., 2003; Buzsáki and Draguhn, 2004).
Based on these considerations and our desire to minimize the substantial time commitment of our participants, we adopted a sufficient sampling rate to measure the low-delta oscillations observed in the pilot data (i.e., the most apparent and consistent oscillation). Although the pilot data suggested that cross-sensory phase reset might be occurring at a frequency near 1 Hz, it is entirely possible that what appears to be a 1 Hz oscillation reflects phase reset of higher frequencies. The important point here is that the possibility of such aliasing, while preventing us from making strong statements about frequency, does not prevent us from providing evidence of periodicity in visual-target detection.
To test the hypothesis that top-down attentional control is instrumental in the process of phase resetting [in light of the studies by Lippert et al. (2007) and Lakatos et al. (2009)], the experiment included two conditions (Fig. 1b). For the first condition (the “equiprobable” condition), the simultaneous audiovisual stimulus (i.e., visual targets at 0 ms) and visual targets at each of the other 12 time points were equiprobable. For the second condition [the “audiovisual (AV)-dominant” condition], the probability of simultaneous audiovisual targets was increased to 20%, while the probability of visual targets at each of the other time points was set at 5% (i.e., 5% multiplied by 12 time points). For both conditions, participants were informed of these probabilities before the experiment under the assumption that this knowledge would affect their strategic approach to the task (Lippert et al., 2007).
Participants, who were positioned 70 cm in front of a 21 inch CRT computer monitor, were asked to maintain central fixation and report the occurrence of visual stimuli: sine-wave gratings with 16 ms duration, subtending 2.5 degrees of the visual angle in both the vertical and horizontal planes. The visual stimuli were presented 2° below central fixation, and sounds (1000 Hz tone, 16 ms) were presented from a Bose (Companion 2) speaker positioned directly below the computer monitor. After a participant clicked the right mouse button to begin a trial, there was a 1–3 s prestimulus interval, followed by a clearly audible sound (∼75 dB SPL). A visual stimulus sometimes co-occurred with the sound (at 0 ms), or at one of the 12 evenly spaced time points following the sound (Fig. 1a). Catch trials (∼20%), in which there was a sound at the beginning of the trial but no visual stimulus throughout the duration of the trial, were included to estimate false alarms. Participants were directed to click the left mouse button whenever they detected a visual stimulus, regardless of when it occurred. Trials ended either when the participant responded or 7200 ms after the sound was presented (giving participants enough time to respond to a visual stimulus that occurred at 6000 ms). Following each trial, participants were presented with a pause screen and had to click the right mouse button to begin the next trial. An SR Research EyeLink eye tracker was used to discard all trials with blinks or eye movements. After every 20 trials, participants were updated on their behavioral performance.
For six participants from the equiprobable condition, complete datasets were collected for three different contrast levels (3 × 80 trials for each time point); however, this approach proved to be overly intensive. The remaining participants completed a total of 80 trials for each time point, with contrast being adjusted such that average visual-target detection across all 13 time points was held at <50%. For the AV-dominant condition, participants completed 320 multisensory trials and 80 trials for every other time point. To maintain vigilance, participants rarely completed more than three blocks of the experiment on a given day (each block took ∼12 min to complete), and all participants were advised to stop the experiment if they were unable to focus on the task at hand. Overall, each participant completed 12 blocks.
Statistical bootstrapping procedures
Our first aim was to determine whether the observed data included a periodic component that would be indicative of cross-sensory phase reset. To do this, we looked at the data in two general ways: (1) least-squares fitting of sinusoidal models to the data, and (2) spectral analysis of the data using the fast Fourier transform (FFT). Our second aim was to determine whether cross-sensory phase reset was influenced by the probability of audiovisual co-occurrence. Here, we compared the phase of our model fits across the equiprobable and AV-dominant conditions (for a description of the probabilities in each condition, see Fig. 1).
For all of our analyses, we chose to use a nonparametric bootstrapping procedure to quantify statistical confidence. Nonparametric statistics are robust to violations of assumptions for parametric statistical tests, such as normally distributed sampling distributions and homogeneity of variance (a more traditional, parametric approach, such as grand averaging would not be appropriate in the context of the present experiment, because such an approach would assume that the frequency and phase of oscillatory activity was the same across participants). For the bootstrapping procedure, each observed test statistic of interest is compared with a reference distribution of statistics that is derived by iteratively randomizing the original data. We used a one-tailed threshold of p < 0.05 to define significance. The p value for a bootstrap test is the proportion of values in the reference distribution that exceed the test statistic (i.e., the observed value from our collected data). Since we wanted to evaluate the significance of the temporal pattern of performance, we randomized performance values (i.e., hit rates) across the 13 time points to create our reference distributions. We performed this randomization differently depending on which test statistic was being evaluated. In each case, we chose the more conservative randomization procedure. In the following sections, the applicable test statistics and randomization procedures are described.
Data modeling
Using an iterative MATLAB algorithm (lsqcurvefit), we fit the following model equation to the observed data in a linear least-squares sense:
 |
Where x is a vector of sample time points in seconds, ω is a frequency in Hertz, ϕ is a phase angle in radians, A is an amplitude in performance units (i.e., percentage), c is a constant in performance units, and ŷ is a vector of modeled values in performance units. The subscripts lf and hf designate lower-frequency and higher-frequency sinusoidal components of the model, respectively. The lower-frequency component was included to model performance variability that could be attributed to consistent within-trial fluctuations in a participant's sustained attention or vigilance, whereas the higher-frequency component was included to model the aftereffects of cross-sensory phase reset. This higher-frequency component was therefore the component of interest, given our a priori goal to test for a behavioral correlate of cross-sensory phase reset. A change of notation can make the sinusoidal nature of Equation 1 explicit by substitution by Euler's formula. That is, Equation 1 is equivalent to the following:
 |
Note that phase from Equation 1 is now carried by the ratio of the amplitudes of the sine and cosine components of Equation 2 by the identity ϕ = tan−1(a/b) for ϕ ∈ (−π, π]. We should also mention that negative frequencies, which are equivalent to their positive-valued counterparts with a phase shift of π radians, and frequencies exceeding the Nyquist limit (i.e., ±1 Hz) were valid potential output parameters for the model fitting procedure (i.e., our model fits were not constrained to positive frequencies or frequencies less than or equal to ±1 Hz). All free parameters of the model were fit in parallel. The iterative curve-fitting algorithm is dependent on initial conditions and can potentially return a solution that is locally optimized despite the existence of a better solution far from the local minimum. To avoid such suboptimal local solutions, we repeated the fitting algorithm 10 times, with randomly selected initial values for each parameter. We tested several quantities of such repetitions and found that 10 repetitions were sufficient to consistently identify the best-fitting model. This procedure had the additional advantage of removing initial condition bias from the fitting procedure.
After determining the best-fitting model parameters, we calculated the proportion of variance-accounted-for (R2) for both the full model [ŷfull (Eq. 1)] as well as a model characterized by just the constant term and the low-frequency sinusoidal component as follows:
Note that we independently fit Equation 3 to the observed data. The proportions of variance-accounted-for were calculated as follows:
 |
 |
where y is the vector of observed performance values, and ȳ is the scalar mean of this vector. We took the difference of these R2 values to describe the increase in the proportion of variance-accounted-for by including the higher-frequency sinusoidal component (ΔRhf2) as follows:
Not only were we interested in quantifying the quality of the fit of the higher-frequency sinusoid to the data (i.e., ΔRhf2) but moreover we wanted to know the absolute quantity of variance described by this term of the model. To assess this, we multiplied the R2 of each model by the variance of that model. More specifically, we multiplied the R2 of each model by the variance of the predicted values at each sample point, meaning that we did not include the model variance between the sample points in our calculation, as follows:
 |
 |
where ŷ̄ is the mean of model values and N is the number of sample points. We termed this product the relevance of the model. We examined the change in relevance due to the inclusion of the higher frequency sinusoidal component to the model (ΔRelhf) as follows:
Statistical bootstrapping of model fit statistics
The test statistics for this analysis were the R2 values (Eqs. 4–6) and relevance values (Eqs. 7–9). Reference distributions were created by randomly assigning hits and misses to the 13 time points. The total quantity of hits and misses used for each dataset equaled the quantity of hits and misses for the corresponding participant. For the AV-dominant condition, the 0 ms stimulus onset asynchrony (SOA) time point contained four times as many targets as each of the other time points, and was therefore assigned the concomitant number of scores for the bootstrapped datasets.
Individual participant statistics.
We generated 103 bootstrapped datasets by randomly assigning hits and misses to the sampled time points. For each of the bootstrapped datasets, we determined the best-fitting model parameters using the method described above (see Data modeling). The procedure used to fit models to the bootstrapped data was identical in every way with those used to fit models to the observed data. After fitting the models to the bootstrapped data, we calculated relevance and R2 values for the model terms to create reference distributions.
Group-level statistics.
The reference distribution for the group-level analysis was created by drawing 103 eight-member samples from the individual bootstrap distributions of R2 and relevance values to create a distribution of randomized “group-level” averages. The test statistics were the actual observed group averages for R2 and relevance values.
Statistical bootstrapping of frequency spectra
We tested for frequencies with significantly large amplitudes. The test statistics were thus the amplitudes of each frequency. For the randomization procedure, we shuffled the time points at which performance was measured for each subject while keeping the performance values themselves unchanged. This shuffling procedure preserves the total integrated amplitude of the Fourier-transformed data, which aids in the interpretation of the statistical outcome. That is, we were less interested in testing the total variability of the data than in testing the importance of the temporal order of the data.
Individual participant statistics.
For each participant we created 5 × 10³ bootstrapped datasets by randomly shuffling the temporal order of observed performance values. Each bootstrapped dataset was Fourier-transformed to yield a reference distribution of amplitude spectra. Resultant frequencies ranged from 0 to 1 Hz with 0.16 Hz resolution. We ignored the 0 Hz component, which was always identical with that of the observed data due to the nature of the shuffling procedure.
Group-level statistics.
The participant-level bootstrapping procedure identifies significant spectral peaks. We were particularly interested whether there was group-level commonality regarding peak frequencies. For this analysis, the reference distribution was created by drawing 5 × 10³ eight-member samples from the individual bootstrap distributions to create a distribution of randomized group-level averages.
Statistical bootstrapping of phase concentrations across conditions
To test whether the phase of the high-frequency component of our best-fitting models (i.e., ϕhf from Eq. 1) differed significantly between the equiprobable and AV-dominant conditions, we again used a nonparametric bootstrap test. The test statistic in this case was the magnitude of the difference of the mean phases for each group. To derive this value, the observed phase for each participant's model fit (n) was first projected onto the complex unit circle as follows:
Note that ẑn can be conceived as a two-element vector of unit magnitude and argument ϕn. These complex values were averaged for each condition to yield and , where eq and av represent the equiprobable and AV-dominant conditions, respectively. An important property of the vector is that it reflects both the central tendency and dispersion of the sample of phases: the argument of is the mean phase and the magnitude of reflects the distribution of the sample. The magnitude is large when the sampled phases are concentrated around a common value (attaining a maximum of 1 when all the phases in the sample are identical), and the magnitude is small when the phases are broadly distributed (attaining a minimum of 0 when the phase distribution is uniform or antipodal). The distance between the two samples is the following:
where ∥ ∥ represents the scalar norm or magnitude of the resultant vector. In theory, d can range from 0 (no phase difference) to 2 (opposite phases with no within-sample variance). Figure 7 includes a geometrical illustration of the quantity d.
Figure 7.
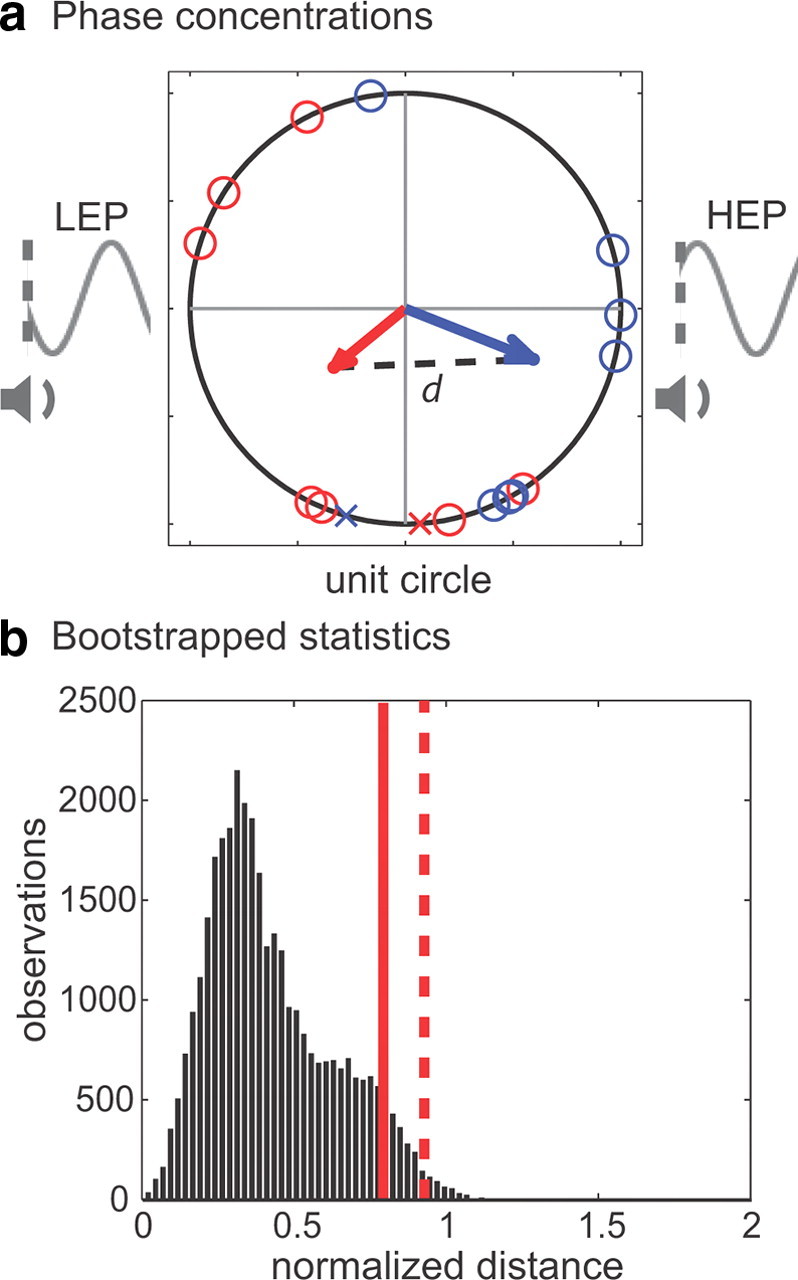
A comparison across conditions of the phase concentrations fit by the higher-frequency component of our two-part sinusoidal model. a, Each participant's phase value is plotted on the unit circle, with participants in the AV-dominant condition represented by blue circles and participants in the equiprobable condition represented by red circles. The Xs represent the phase values for the two participants who were removed from the analysis because their observed hit rate at 0 ms (i.e., the audiovisual time point) violated the general pattern of results for their respective conditions. The value of d represents our measure of the difference between the phase concentrations, with phases in the equiprobable condition clustered closer to a low-excitability phase (LEP) and phases in the AV-dominant condition clustered closer to a high-excitability phase (HEP). b, The bootstrap distribution of phase concentrations generated by randomly reassigning phase measurements across the two groups. The solid red line represents the length of d when all participants were included in the statistical analysis (p = 0.08), and the dashed red line represents the length of d when two participants were excluded from the statistical analysis (p = 0.01).
To derive the reference distribution for this test, it was tractable to resample the original 16 phases into all 12,870 possible combinations of the two eight-member sets of participants. Because of the relatively small sample for this test, we used a smoothed bootstrapping procedure in which each resampled phase was jittered by a small random value drawn from a normal distribution with zero mean and a SD of 1∕, where N = 16, the sample size (Hall et al., 1989). This smoothing procedure improves the bootstrapped estimate of the sampling error for small sample sizes. To further improve the estimate, we repeated the entire permutation procedure 10 times with different jitters, resulting in a total of 128,700 permutations. For each such permutation, we computed the distance d between the two groups by Equations 10 and 11. The p value for this test is the proportion of distances in the reference distribution that exceed the observed distance between the phases of the equiprobable and AV-dominant condition.
Results
Multisensory enhancement of visual-target detection
It is well established that a simultaneously presented sound can enhance visual-target detection (Stein et al., 1996; McDonald et al., 2000; Frassinetti et al., 2002; Odgaard et al., 2003; Teder-Sälejärvi et al., 2005; Lippert et al., 2007; Van der Burg et al., 2008a,b). Some debate remains, however, regarding the extent to which these multisensory effects are stimulus-driven (Van der Burg et al., 2008b) or instead operate under top-down attentional control (Lippert et al., 2007). As a first step in our analysis, we assessed whether (1) our behavioral setup led to auditory facilitation of co-occurring visual targets and (2) whether auditory facilitation was dependent on the probability of simultaneity (i.e., audiovisual co-occurrence). If the multisensory enhancement of visual-target detection is a bottom-up process that is independent of attentional influences, it should be evident in both experimental conditions. That is, if auditory facilitation is entirely based on the instantaneous properties of the stimulus, it should be observed whenever a visual target is presented with a sound, regardless of the probabilistic context.
To test whether the sound presented at the beginning of each trial enhanced the detection of co-occurring visual targets, we compared hit rates in response to audiovisual targets (i.e., visual targets presented at 0 ms) with those in response to visual-alone targets that were presented 500 ms after the sound. These visual-alone targets are well outside the temporal window for integration and thus a good approximation of the visual-alone targets typically used in multisensory studies (Slutsky and Recanzone, 2001). For the equiprobable condition, a two-tailed, paired t test revealed that hit rates in response to audiovisual targets were actually lower than those in response to visual-alone targets at a nearly significant level (p = 0.06). Rather than facilitating visual-target detection, these data suggest that the sound at the beginning of each trial in the equiprobable condition acted as a distractor. For the AV-dominant condition, however, a two-tailed, paired t test revealed a significant multisensory enhancement of visual-target detection (p = 0.03).
To summarize, auditory facilitation of co-occurring visual targets was evident in our second condition, in which there was a higher probability of simultaneity (Fig. 2), but not in our first condition. These data therefore support earlier findings that the predictive power of a sound determines whether or not there is a multisensory enhancement of visual-target detection (Lippert et al., 2007). Because participants were informed of the probabilities before the experiment, we propose that their strategic approach to the task, or rather how they deployed their attention, determined how the sound at the beginning of each trial influenced visual-target detection. We discuss this proposal in greater detail in the Discussion.
Figure 2.

Significant auditory facilitation of visual-target detection was observed in the AV-dominant condition (p = 0.03). For the equiprobable condition, however, there was a nearly significant (p = 0.06) decrease in the detection of visual targets that co-occurred with the sound, relative to visual targets that occurred 0.5 s after the sound. Error bars indicate SEM.
Although the sound had less predictive power in the equiprobable condition relative to the AV-dominant condition, it still provided temporal information about when participants could begin to expect the occurrence of visual targets. Given that the sound did not provide competing or contradictory information, lower detection of audiovisual targets relative to visual-alone targets (at 500 ms) might seem somewhat surprising. But the present analysis was limited to the first two time points and therefore does not reveal the whole story. The antipodal results observed here might be better explained in the broader context of phase reset of ongoing oscillations. It is possible, for example, that phase reset occurred in both conditions but that the exact nature of this phase reset (e.g., the timing of phase reset relative to the sound, or the phase to which oscillations were reset) differed based on the probabilistic context of the task. In the next section, we examine visual-target detection across the entire trial duration (i.e., 6 s) to test for stimulus-locked periodicity in behavioral performance.
Stimulus-locked periodicity in visual-target detection
Attention is known to increase the apparent contrast of visual stimuli (Carrasco et al., 2004), and thus it is reasonable to suppose that an attentional mechanism might be involved in the multisensory enhancement of visual-target detection. Furthermore, insofar as periodicity has been hypothesized to be particularly relevant to timekeeping (Matell and Meck, 2000), if attention is indeed being deployed based on temporal information—as we propose—then cross-sensory phase reset of ongoing oscillations seems an excellent candidate mechanism (Lakatos et al., 2007, 2009). Here, we probed for evidence of periodicity in visual-target detection at consecutive time points, time-locked to a temporally informative sound.
To test for the presence of periodicity, a bootstrap statistical approach was combined with a two-part sinusoidal model (for the equations, see Materials and Methods), in which the model fit of the observed hit rates for each time point was compared with the model fit of randomly resampled data (i.e., hits and misses were randomly redistributed across the 13 time points). This procedure was tailored to address the following hypotheses: (1) that the observed data included a lower-frequency component that resulted from consistent changes in a participant's sustained attention (or vigilance) across the duration of a trial, and (2) that the periodic nature of the observed data was attributable to stimulus-locked oscillatory activity. The first sinusoid of the model was constrained to be ≤0.25 Hz (i.e., 1.5 cycles per 6 s). This lower-frequency sinusoid was expected to explain variability associated with consistent changes in sustained attention that occurred within a trial. For example, if a participant's focus consistently waned, such that her performance generally decreased from the first (0 ms) to the last time point (6000 ms). The lower-frequency component of our two-part model had the flexibility to also conform to strategies based on probabilities; for example, if probability summation improved a participant's performance in response to visual targets that were presented near the end of a trial, such that her performance generally improved from the first to the last time point. The second sinusoid of the model was constrained to be >0.25 Hz. This higher-frequency sinusoid was expected to explain variability associated with a physiological rhythm (i.e., ongoing oscillatory activity), in which the phase but not the frequency was influenced by a participant's strategic approach to the task.
The results of this analysis for the equiprobable condition are shown in Table 1(columns 1–3) and Figure 3, and for the AV-dominant condition, in Table 2(columns 1–3) and Figure 4. For the equiprobable condition, at the group level, the full model (i.e., the model with both sinusoids) explained ∼73% of the variability in visual-target detection across the 13 time points. The lower-frequency component of the model, when fit by itself, explained ∼33% of the variability in visual-target detection, and the addition of the higher-frequency component to the model explained another 40% of the variability in visual-target detection. Whereas the full model (p < 0.002) explained a significantly higher proportion of variance in the observed data relative to the randomly redistributed data, the proportion of variance explained by the lower-frequency component was only nearly significant (p = 0.07) and the proportion of variance explained by the higher-frequency component (p = 0.23) was not statistically significant.
Table 1.
Model fit results for the equiprobable condition
| Participant | R2 (full) (1) | R2 (lf) (2) | R2 (hf) (3) | Rel (full) (4) | Rel (lf) (5) | Rel (hf) (6) |
|---|---|---|---|---|---|---|
| P1 | 0.72 (0.24) | 0.54 (0.06) | 0.17 (0.86) | 0.038 (0.03) | 0.022 (0.03) | 0.016 (0.20) |
| P2 | 0.77 (0.15) | 0.20 (0.59) | 0.58 (0.10) | 0.089 (0.000) | 0.006 (0.23) | 0.084 (0.000) |
| P3 | 0.62 (0.49) | 0.17 (0.65) | 0.45 (0.28) | 0.027 (0.09) | 0.002 (0.49) | 0.025 (0.05) |
| P4 | 0.89 (0.01) | 0.20 (0.55) | 0.68 (0.03) | 0.095 (0.000) | 0.005 (0.24) | 0.090 (0.000) |
| P5 | 0.69 (0.33) | 0.39 (0.19) | 0.30 (0.64) | 0.027 (0.10) | 0.009 (0.12) | 0.018 (0.17) |
| P6 | 0.68 (0.34) | 0.40 (0.19) | 0.28 (0.65) | 0.055 (0.003) | 0.019 (0.04) | 0.036 (0.008) |
| P7 | 0.74 (0.19) | 0.24 (0.48) | 0.50 (0.18) | 0.039 (0.03) | 0.004 (0.33) | 0.035 (0.02) |
| P8 | 0.71 (0.27) | 0.50 (0.07) | 0.21 (0.79) | 0.079 (0.000) | 0.038 (0.009) | 0.041 (0.01) |
| All | 0.73 (0.002) | 0.33 (0.07) | 0.40 (0.23) | 0.055 (0.000) | 0.011 (0.005) | 0.044 (0.000) |
Notes: Values of p are in parentheses. Full, Full model (i.e., it includes both sinusoids); lf, lower frequency (i.e., <0.25 Hz); hf, higher frequency (i.e., >0.25 Hz).
Figure 3.

Modeling results for the equiprobable condition. a, Each participant's data were fit with a two-part sinusoidal model. The gray dots represent the observed data, and the black lines represent the model predictions. The frequencies of the two sinusoids that the model fit to the observed data are shown above each participant's plot. Average false alarm rates across four time windows show that participants were not biased to respond more at the beginning of each trial. b, The proportion of variance (R2) explained by the two-part sinusoidal model for the observed data was compared with that explained for randomly redistributed data (Table 1). The gray lines represent where the model fit for our observed data falls relative to the bootstrap distributions. c, An additional measure of model fit that incorporated the total amount of variance explained by the model (i.e., the model relevance) was used to further compare the observed data to randomly redistributed data (Table 1, Fig. 5).
Table 2.
Model fit results for the AV-dominant condition
| Participant | R2 (full) (1) | R2 (lf) (2) | R2 (hf) (3) | Rel (full) (4) | Rel (lf) (5) | Rel (hf) (6) |
|---|---|---|---|---|---|---|
| P1 | 0.68 (0.27) | 0.14 (0.71) | 0.55 (0.11) | 0.035 (0.03) | 0.001 (0.62) | 0.034 (0.02) |
| P2 | 0.89 (0.02) | 0.55 (0.05) | 0.33 (0.55) | 0.071 (0.000) | 0.028 (0.001) | (0.043) (0.003) |
| P3 | 0.66 (0.35) | 0.17 (0.62) | 0.49 (0.20) | 0.073 (0.000) | 0.005 (0.19) | 0.068 (0.000) |
| P4 | 0.85 (0.06) | 0.25 (0.45) | 0.60 (0.08) | 0.058 (0.000) | 0.005 (0.22) | 0.053 (0.000) |
| P5 | 0.69 (0.32) | 0.23 (0.47) | 0.46 (0.27) | 0.050 (0.001) | 0.005 (0.20) | 0.045 (0.000) |
| P6 | 0.81 (0.08) | 0.36 (0.22) | 0.45 (0.28) | 0.053 (0.002) | 0.010 (0.07) | 0.042 (0.004) |
| P7 | 0.78 (0.17) | 0.41 (0.18) | 0.37 (0.46) | 0.032 (0.04) | 0.009 (0.09) | 0.023 (0.07) |
| P8 | 0.66 (0.37) | 0.15 (0.69) | 0.51 (0.17) | 0.038 (0.02) | 0.002 (0.44) | 0.036 (0.009) |
| All | 0.75 (0.000) | 0.28 (0.27) | 0.47 (0.02) | 0.051 (0.000) | 0.008 (0.007) | 0.043 (0.000) |
Notes: Values of p are in parentheses. Full, Full model (i.e., it includes both sinusoids); lf, lower frequency (i.e., <0.25 Hz); hf, higher frequency (i.e., >0.25 Hz).
Figure 4.

Modeling results for the AV-dominant condition. a, Each participant's data were fit with a two-part sinusoidal model. The gray dots represent the observed data and the black lines represent the model predictions. The frequencies of the two sinusoids that the model fit to the observed data are shown above each participant's plot. Average false alarm rates across four time windows show that participants were not biased to respond more at the beginning of each trial. b, The proportion of variance (R2) explained by the two-part sinusoidal model for the observed data was compared with that explained for randomly redistributed data (Table 2). The gray lines represent where the model fit for our observed data falls relative to the bootstrap distributions. c, An additional measure of model fit that incorporated the total amount of variance explained by the model (i.e., the model relevance) was used to further compare the observed data to randomly redistributed data (Table 2, Fig. 5).
The pattern of results for the AV-dominant condition, in which the probability of simultaneity was higher than the probability of a visual target at each of the other 12 time points, differed from those for the equiprobable condition. At the group level, the full model explained ∼75% of the variability in visual-target detection across the 13 time points. The lower-frequency component of the model explained ∼28% of the variability in visual-target detection, and the addition of the higher-frequency component to the model explained another 47% of the variability in visual-target detection. Here, both the proportion of variance explained by the full model (p < 0.001) and its higher-frequency component (p = 0.02) were significantly greater for the observed data than for the randomly redistributed data, while the proportion of variance explained by the lower-frequency component (p = 0.27) was not statistically significant.
In addition to the proportion of variance explained (i.e., R2), a second measure of model fit was devised to also consider the total amount of variance explained. This second measure was termed the “relevance” of the model. Figure 5 provides an illustration of why this relevance measure provides important information about the model fit. As the amplitude of a sinusoid decreases, it begins to approximate a line. Although such a low-amplitude sinusoid might explain a large proportion of variance, it cannot be taken as evidence of periodicity. To calculate the relevance of the model fit, the proportion of variance explained was weighted by the absolute value of the average deviation of the predicted values of the model from the predicted mean (for the equations, see Materials and Methods). As shown in Tables 1 and 2, columns 4–6, once the total amount of variance was incorporated into the dependent measure, statistical significance was achieved not only at the group level for both conditions but also at the participant level. On average, the randomly redistributed data had significantly less variability than the observed data, further supporting the assertion that the observed data included a periodic component.
Figure 5.

An illustration of the additional information that the relevance term provides about the model fit. The relevance of the model fit incorporates both the proportion of variance explained and the total amount of variance explained. Here, we show observed subject data (a) and randomly redistributed data (b) in which the model explains a similar amount of variance, but the observed subject data have much greater total variance. The total amount of variance is indicated by the size of the pie chart. Given the low amplitude of the sinusoids that were fit to the randomly redistributed data, it should not be described as periodic. That is, a low-amplitude sinusoid begins to approximate a line, and therefore a periodic model, although it might provide a good fit in terms of the proportion of variance explained, does not provide a meaningful description of the data beyond what would be provided by a linear model.
To further probe for the absence or presence of periodicity, the observed data were also transformed into their frequency-domain representation. The FFT was used to compare the frequency content of the observed data to that of random-order data. Here, the bootstrap statistical approach involved randomly shuffling the observed hit rates across the 13 time points. Since the frequency spectrum of white noise is flat, any significant spectral peaks in the observed data would provide evidence for a consistent periodic component. Figure 6 shows the group-level results of this analysis for both experimental conditions. For the equiprobable condition, there were peaks at both 0.17 Hz (1 cycle per 6 s) and 1 Hz, but the amplitudes of these peaks were not significantly greater than those of the randomly shuffled data (p = 0.08 and p = 0.14, respectively). In comparison, for the AV-dominant condition, there was a single peak at 1 Hz that was indeed significantly greater than the amplitude of the randomly shuffled data (p = 0.008).
Figure 6.

FFT results for both experimental conditions. a, Averaged FFT-amplitude measurements of the observed group-level data (gray dots) are compared with distributions of FFT-amplitude measurements taken from randomly reshuffled data (black dots). Amplitude is measured in performance units (based on hit rates). b, Bootstrap distributions of FFT-amplitude measurements at 0.17 and 1 Hz. The gray lines represent where the FFT-amplitude measurements of our observed data fall relative to the bootstrap distributions.
Because of potential aliasing, it is not possible to definitively conclude based on the FFT results that the observed periodic component reflects oscillatory activity at 1 Hz. Oscillations at 4 and 8 Hz, for example, would also be expected to show peaks (i.e., alias) at 1 Hz with a sampling rate of 2 Hz. It can be concluded, however, that the modeling and FFT results for the AV-dominant condition both provide evidence for stimulus-locked periodicity in the observed hit rates. The modeling results for the equiprobable condition, once the total variance explained is taken into account, also provide evidence for stimulus-locked periodicity. We propose that the emergence of a periodic component in behavioral performance across trials, regardless of potential aliasing, demonstrates a behavioral correlate of cross-sensory phase reset in response to a temporally informative sound.
A comparison of phases across conditions
For the AV-dominant condition, there is strong evidence for cross-sensory phase reset, and ongoing neural oscillations seem to be reset to a high-excitability phase (and auditory facilitation of visual-target detection was therefore observed). For the equiprobable condition, there is also evidence for cross-sensory phase reset, but if anything, ongoing neural oscillations are being reset to a low-excitability phase. To formally test whether phase was being reset differently across the two conditions, we measured whether the phase concentrations of our best-fit models for the higher-frequency component were statistically different.
An examination of the observed hit rates in Figures 3 and 4 reveals that the audiovisual time point (0 ms) was a relative low point in visual-target detection for seven of the eight participants in the equiprobable condition, whereas the same time point was a relative high point in visual-target detection for seven of the eight participants in the AV-dominant condition. We therefore measured the difference in phase concentrations across the two conditions both with all 16 participants and without the two outliers. These outliers were selected based on the observed data, rather than the model fits. With the entire sample (N = 16), the difference between phase concentrations across the conditions was nearly significant (p = 0.08). With the smaller sample (N = 14), this difference between phased concentrations was significant (p = 0.01). Figure 7 shows the results obtained both with and without the two outliers, whose data are represented by Xs on the unit circle. A comparison of the modeled phase concentrations across the two conditions suggests that the exact nature of cross-sensory phase reset—perhaps whether phase is reset to a high- or low-excitability state—is influenced by the probabilistic context (i.e., the probability of audiovisual co-occurrence).
Discussion
The present data strongly support the hypothesis that one of the primary mechanisms driving auditory facilitation of visual-target detection is cross-sensory phase reset of ongoing neural oscillations. Because of measurement limitations, neurophysiological research in nonhuman primates has been limited to describing cross-sensory phase reset in response to unisensory stimulation (Lakatos et al., 2009). Using a purely behavioral approach, we circumvent these limitations and provide compelling evidence for cross-sensory phase reset in response to multisensory stimulation. Importantly, these data provide a highly plausible link between this attentional mechanism that has been observed with neurophysiological recordings and its perceptual consequences. Consistent with the notion that cross-sensory phase reset underlies behavioral facilitation, we found that performance on a visual-target detection task waxed and waned in a periodic fashion, time-locked to a temporally informative sound. These periodic fluctuations in behavior extended beyond 5 s, indicating—at least when attention must be sustained—that cross-sensory phase reset influences perception not only at the moment it occurs but also for seconds thereafter. We attribute this periodicity in behavior to ongoing oscillations continuing to ring at their new phase. Unlike some previous studies that used rhythmic stimulation (Lakatos et al., 2009; Besle et al., 2011), our results demonstrate that cross-sensory phase reset can occur even when there is no apparent rhythm embedded in the behavioral task.
It should be noted that, although we adopt cross-sensory phase reset of ongoing oscillations as the most parsimonious explanation for our results, the behavioral approach provides no measure of prestimulus phase. The stimulus-locked periodicity that we observe might therefore result from an additional oscillatory process superimposed on ongoing oscillations rather than from phase reset of preexisting oscillations.
The role of endogenous factors
Our data are consistent with the viewpoint that multisensory enhancement of visual-target detection operates through strategic top-down processes (Lippert et al., 2007). In the present experiment, auditory facilitation was observed only when participants knew that the visual target was more likely to co-occur with the sound than at any of the other time points (i.e., during the AV-dominant condition). Given that participants were informed of the probabilistic context before each experimental session, and that the difficult task required highly focused attention, we believe that explicit knowledge may have played a role in how participants deployed their attentional resources. For example, in the AV-dominant condition, the optimal approach to the task was to deploy attentional resources immediately following the button press that initiated each trial. Such anticipatory attention was useful because visual targets were most likely to co-occur with the sound, but the exact timing of the sound following the button press was unpredictable (i.e., the sound occurred 1–3 s after the button press). For the equiprobable condition, however, there was no such optimal approach. As a result, attentional deployment in time relative to the sound was probably less consistent, both across participants and across trials. Because visual targets were just as likely to co-occur with the sound as they were to occur at any of the other 12 time points, participants in the equiprobable condition had far less impetus to deploy their attention in anticipation of the sound than did participants in the AV-dominant condition. Instead, participants in the equiprobable condition might have more often used the sound like a temporal cue to begin attending for the possible occurrence of a visual target, which would make anticipatory attentional deployment weaker in the equiprobable condition than it was in the AV-dominant condition. We propose that it was such differences in attentional deployment across the conditions that led to differences in the observed results. First, a more consistent behavioral approach might explain why evidence of periodicity in visual-target detection was stronger for the AV-dominant condition than for the equiprobable condition. That is, the proportion of variance explained by the higher-frequency component of the two-part sinusoidal model was significant for the AV-dominant condition, even before it was weighted by the total variance explained (Fig. 3), whereas the model fit of the higher-frequency component for the equiprobable condition was only significant when both the proportion and the total variance explained were considered together (i.e., as the model relevance) (Fig. 4). Second, because auditory facilitation of visual-target detection was only observed for the AV-dominant condition, it might be that anticipatory attentional deployment is a prerequisite for cross-sensory phase reset to a high-excitability phase.
Possible support for our proposal that attentional resources were deployed differently across the two conditions arises from the FFT results (Fig. 6). The frequency spectrum for the equiprobable condition includes a nearly significant peak at 0.17 Hz (p = 0.08) that is entirely absent in the AV-dominant condition. This peak might reflect the ramping up of sustained attention (or vigilance) following the sound that occurs near the beginning of each trial. In other words, the typical strategic approach for the equiprobable condition might best be described by a Gaussian resembling a 0.17 Hz sinusoid, with a crest that occurs either at the beginning, middle, or end of the trial (i.e., a sinusoid with one complete cycle over the 6 s period of a trial). In comparison, in the AV-dominant condition, in which we suspect that anticipatory attentional deployment was stronger, changes in sustained attention across the duration of a trial might be best described by an even lower-frequency sinusoid, time-locked to the button press that initiated each trial. However, here a frequency <0.17 Hz would not be apparent in our FFT results, as 0.17 Hz is the lower limit of our frequency resolution.
If multisensory enhancement of visual-target detection indeed operates through strategic top-down processes, then its underlying neural mechanism should be similarly susceptible to endogenous factors. In support of this prediction, Lakatos et al. (2009) observed phase reset in visual cortex in response to an auditory-alone stimulus during an attend-auditory condition, but no such phase reset was observed in response to the same auditory-alone stimulus during an attend-visual condition. These results demonstrated that, in a unisensory context, cross-sensory phase reset only occurs in response to stimuli presented in the to-be-attended modality. In the present experiment, we provide evidence that manipulating the probability of simultaneity—and presumably how participants' deployed their attentional resources—determined whether a co-occurring visual target aligned with a high-excitability phase. As shown in Figures 3 and 4, the hit rate in response to co-occurring visual targets (at 0 ms) was at a peak of visual-target detection for just one participant in the equiprobable condition, but seven (of eight) participants in the AV-dominant condition. After removing one outlying participant's data from each condition, phase concentrations of the higher-frequency component of the model (i.e., the model component thought to reflect the aftereffects of cross-sensory phase reset) were shown to be significantly different. On average, modeled phase in the equiprobable condition was clustered closer to a low-excitability phase, while modeled phase in the AV-dominant condition was clustered closer to a high-excitability phase (Fig. 7). Thus, the specifics of when and how cross-sensory phase reset occurred may have hinged not only on whether the sound at the beginning of each trial was attended or ignored (Lakatos et al., 2009) but also on a participant's strategic approach to the task. The length of the vectors in Figure 7 represents the dispersion of phase values around the means for the two conditions. The longer (blue) vector in the AV-dominant condition suggests greater consistency in phase reset (relative to the equiprobable condition), perhaps reflecting a more consistent strategy with a stronger deployment of anticipatory attention.
We framed the preceding discussion of potential strategies in terms of anticipatory attention, which we assume (and the data suggest) was deployed based on the predictive power of the sound that occurred at the beginning of each trial. Following this first time point (i.e., the potential audiovisual time point), the probability of visual-target presentation had a fixed temporal distribution that also might have influenced behavioral performance (Fig. 1). Several previous studies have shown that a temporal distribution of visual-target onsets (i.e., a probability distribution) can modulate behavioral performance through temporal expectancy (Coull and Nobre, 1998; Miniussi et al., 1999; Janssen and Shadlen, 2005), whereby peaks in performance align with the time periods in which a visual target is most likely to occur. What is critical to the interpretation of our results is whether periodicity in observed hit rates can be explained by such temporal expectancy effects rather than cross-sensory phase reset. For both the equiprobable and AV-dominant conditions, the probability of visual-target presentation following the first time point (i.e., the potential audiovisual time point) had a comb-like distribution, with a peak every 500 ms (Fig. 1). If participants had been able to infer the nonuniform nature of this temporal distribution and use that information either implicitly or explicitly to their advantage, then the pattern of observed hit rates would have been flat, not periodic. That is, if the comb-like distribution of visual-target onsets had induced periodicity of temporal expectancy, then peaks in performance would have optimally matched the sampling rate (i.e., the frequency of our temporal distribution). Instead, the presence of both peaks and troughs in the observed hit rates demonstrates that periodicity did not conform to the sampling rate, meaning that periodicity in visual-target detection cannot be explained by the temporal distribution of visual-target onsets. We argue that the most parsimonious explanation for periodicity in visual-target detection following a temporally informative sound is thus cross-sensory phase reset of ongoing neural oscillations.
A possible anatomical substrate
The dependence of auditory facilitation of visual-target detection (and cross-sensory phase reset) on endogenous factors indicates a role for the so-called frontoparietal attentional network, which has been repeatedly associated with goal-oriented behavior and top-down attention (for review, see Corbetta et al., 2008). Activation of the frontoparietal network during sustained attention might alter the neurophysiological properties of neurons in sensory cortices, such that incoming information from the sensory periphery resets the phase of ongoing oscillations. Given the supramodal nature of cross-sensory phase reset, however, the influence of frontoparietal regions on sensory cortices might be mediated indirectly via the thalamus—the sensory hub of the brain. Anatomical data suggest that thalamocortical projections are well situated to synchronize subthreshold oscillatory activity across multiple cortical regions. In addition to the frequently described “core” projections from the sensory nuclei of the thalamus to layer IV of sensory cortices, the thalamus is known to have less-specific, more-diffuse cortical projections (Jones, 1998). These “matrix” neurons from the thalamus project to superficial layers of the sensory cortices and are thus thought to modulate ongoing processing. The thalamic reticular nucleus receives projections from many cortical regions, including the prefrontal cortex (Zikopoulos and Barbas, 2007), and is therefore particularly likely to have a role in widespread cortical modulations. The reticular nucleus itself sends inhibitory projections to various thalamic nuclei, including the primary sensory nuclei (e.g., the lateral geniculate nucleus). Perhaps in this way, processing in prefrontal cortex associated with sustained attention (Coull et al., 1996; Manly and Robertson, 1997) disinhibits diffuse thalamocortical projections. When a stimulus occurs, these disinhibited thalamocortical projections might then reset the phase of ongoing oscillations across multiple sensory cortices (Lakatos et al., 2007, 2009).
Concluding remarks
Ongoing oscillations shape our perception (Foxe et al., 1998; Worden et al., 2000; VanRullen et al., 2006, 2007; Monto et al., 2008; Busch et al., 2009; Lakatos et al., 2009; Mathewson et al., 2009; Busch and VanRullen, 2010; Snyder and Foxe, 2010), and attentional modulation of phase prevents this influence on perception from being random (Lakatos et al., 2009). Here, we probed for evidence of cross-sensory phase reset in the context of a visual-target detection task, in which phase reset in response to a temporally informative sound was hypothesized to increase the likelihood of detecting low-contrast visual stimuli; however, we suspect that the influence of cross-sensory phase reset on perception extends far beyond this context. For example, by synchronizing subthreshold neural activity across cortical regions, cross-sensory phase reset in response to a single attended stimulus might serve to select the co-occurring multisensory features of an object for further processing (Fiebelkorn et al., 2010a,b). In a complex environment, cross-sensory phase reset might also aid in attentional capture when a sound co-occurs with a sudden change in the visual scene (Van der Burg et al., 2008b). In both of these cases, the stimuli might be easily seen or heard—unlike the present experiment, in which we used near-threshold visual stimuli—but cross-sensory phase reset still serves as a tool for attentional selection.
The present data point to several remaining questions that will need to be investigated by future studies. First, the exact relationship between behavioral periodicity and the specific frequencies of underlying neural oscillations needs to be established. (i.e., periodicity in behavioral performance might reflect phase reset of higher-frequency oscillations). Second, here we investigated phase reset in a multisensory context; it remains to be shown whether temporal cueing can lead to behavioral periodicity in a unisensory context. For example, does a temporally informative visual stimulus lead to periodicity in visual-target detection? Finally, reaction times in the present study did not seem to reflect an underlying oscillatory process in the same way that hit rates did (data not shown); however, the present study was also not optimally designed to investigate the relationship between phase reset and reaction times. For example, participants were asked to emphasize accuracy over speed when responding to near-threshold visual stimuli. A couple of recently published studies, however, have shown evidence that the phase of oscillations modulates reaction times (Drewes and VanRullen, 2011; Thorne et al., 2011), with Thorne et al. (2011) relating the relationship between oscillations and reaction time to cross-sensory phase reset in auditory cortex. Future studies will be needed to further establish the degree to which reaction times are influenced by oscillations in both sensory and motor cortices (Gross et al., 2002), as well as how oscillations in these anatomically separated cortical regions interact.
Footnotes
This work was supported by National Institute of Mental Health Grant MH-085322 (S.M., J.J.F.) and National Science Foundation Grant BCS0642584 (J.J.F.). M.R.M. received additional support from Swiss National Science Foundation Grant PBELP3-123067. A.C.S. was also supported by National Institute of Mental Health Grant F31 MH-087077. We thank Dr. Simon Kelly for his input during various stages of this project, as well as Dr. Charles Schroeder and Dr. Peter Lakatos for providing insightful comments on an earlier version of this manuscript.
References
- Bak P, Tang C, Wiesenfeld K. Self-organized criticality: an explanation of 1/f noise. Phys Rev Lett. 1987;59:381–384. doi: 10.1103/PhysRevLett.59.381. [DOI] [PubMed] [Google Scholar]
- Besle J, Schevon CA, Mehta AD, Lakatos P, Goodman RR, McKhann GM, Emerson RG, Schroeder CE. Tuning of the human neocortex to the temporal dynamics of attended events. J Neurosci. 2011;31:3176–3185. doi: 10.1523/JNEUROSCI.4518-10.2011. [DOI] [PMC free article] [PubMed] [Google Scholar]
- Busch NA, VanRullen R. Spontaneous EEG oscillations reveal periodic sampling of visual attention. Proc Natl Acad Sci U S A. 2010;107:16048–16053. doi: 10.1073/pnas.1004801107. [DOI] [PMC free article] [PubMed] [Google Scholar]
- Busch NA, Dubois J, VanRullen R. The phase of ongoing EEG oscillations predicts visual perception. J Neurosci. 2009;29:7869–7876. doi: 10.1523/JNEUROSCI.0113-09.2009. [DOI] [PMC free article] [PubMed] [Google Scholar]
- Buzsáki G, Draguhn A. Neuronal oscillations in cortical networks. Science. 2004;304:1926–1929. doi: 10.1126/science.1099745. [DOI] [PubMed] [Google Scholar]
- Carrasco M, Ling S, Read S. Attention alters appearance. Nat Neurosci. 2004;7:308–313. doi: 10.1038/nn1194. [DOI] [PMC free article] [PubMed] [Google Scholar]
- Corbetta M, Patel G, Shulman GL. The reorienting system of the human brain: from environment to theory of mind. Neuron. 2008;58:306–324. doi: 10.1016/j.neuron.2008.04.017. [DOI] [PMC free article] [PubMed] [Google Scholar]
- Coull JT, Nobre AC. Where and when to pay attention: the neural systems for directing attention to spatial locations and to time intervals as revealed by both PET and fMRI. J Neurosci. 1998;18:7426–7435. doi: 10.1523/JNEUROSCI.18-18-07426.1998. [DOI] [PMC free article] [PubMed] [Google Scholar]
- Coull JT, Frith CD, Frackowiak RS, Grasby PM. A fronto-parietal network for rapid visual information processing: a PET study of sustained attention and working memory. Neuropsychologia. 1996;34:1085–1095. doi: 10.1016/0028-3932(96)00029-2. [DOI] [PubMed] [Google Scholar]
- Drewes J, VanRullen R. This is the rhythm of your eyes: the phase of ongoing electroencephalogram oscillations modulates saccadic reaction time. J Neurosci. 2011;31:4698–4708. doi: 10.1523/JNEUROSCI.4795-10.2011. [DOI] [PMC free article] [PubMed] [Google Scholar]
- Fiebelkorn IC, Foxe JJ, Molholm S. Dual mechanisms for the cross-sensory spread of attention: how much do learned associations matter? Cereb Cortex. 2010a;20:109–120. doi: 10.1093/cercor/bhp083. [DOI] [PMC free article] [PubMed] [Google Scholar]
- Fiebelkorn IC, Foxe JJ, Schwartz TH, Molholm S. Staying within the lines: the formation of visuospatial boundaries influences multisensory feature integration. Eur J Neurosci. 2010b;31:1737–1743. doi: 10.1111/j.1460-9568.2010.07196.x. [DOI] [PubMed] [Google Scholar]
- Fiebelkorn IC, Foxe JJ, Butler JS, Molholm S. Auditory facilitation of visual-target detection persists regardless of retinal eccentricity and despite wide audiovisual misalignments. Exp Brain Res. 2011 doi: 10.1007/s00221-011-2670-7. [DOI] [PubMed] [Google Scholar]
- Foxe JJ, Simpson GV, Ahlfors SP. Parieto-occipital ∼10 Hz activity reflects anticipatory state of visual attention mechanisms. Neuroreport. 1998;9:3929–3933. doi: 10.1097/00001756-199812010-00030. [DOI] [PubMed] [Google Scholar]
- Frassinetti F, Bolognini N, Làdavas E. Enhancement of visual perception by crossmodal visuo-auditory interaction. Exp Brain Res. 2002;147:332–343. doi: 10.1007/s00221-002-1262-y. [DOI] [PubMed] [Google Scholar]
- Gross J, Timmermann L, Kujala J, Dirks M, Schmitz F, Salmelin R, Schnitzler A. The neural basis of intermittent motor control in humans. Proc Natl Acad Sci U S A. 2002;99:2299–2302. doi: 10.1073/pnas.032682099. [DOI] [PMC free article] [PubMed] [Google Scholar]
- Hall P, DiCiccio TJ, Romano JP. On smoothing and the bootstrap. Ann Stat. 1989;17:692–704. [Google Scholar]
- Janssen P, Shadlen MN. A representation of the hazard rate of elapsed time in macaque area LIP. Nat Neurosci. 2005;8:234–241. doi: 10.1038/nn1386. [DOI] [PubMed] [Google Scholar]
- Jones EG. Viewpoint: the core and matrix of thalamic organization. Neuroscience. 1998;85:331–345. doi: 10.1016/s0306-4522(97)00581-2. [DOI] [PubMed] [Google Scholar]
- Kayser C, Montemurro MA, Logothetis NK, Panzeri S. Spike-phase coding boosts and stabilizes information carried by spatial and temporal spike patterns. Neuron. 2009;61:597–608. doi: 10.1016/j.neuron.2009.01.008. [DOI] [PubMed] [Google Scholar]
- Lakatos P, Chen CM, O'Connell MN, Mills A, Schroeder CE. Neuronal oscillations and multisensory interaction in primary auditory cortex. Neuron. 2007;53:279–292. doi: 10.1016/j.neuron.2006.12.011. [DOI] [PMC free article] [PubMed] [Google Scholar]
- Lakatos P, Karmos G, Mehta AD, Ulbert I, Schroeder CE. Entrainment of neuronal oscillations as a mechanism of attentional selection. Science. 2008;320:110–113. doi: 10.1126/science.1154735. [DOI] [PubMed] [Google Scholar]
- Lakatos P, O'Connell MN, Barczak A, Mills A, Javitt DC, Schroeder CE. The leading sense: supramodal control of neurophysiological context by attention. Neuron. 2009;64:419–430. doi: 10.1016/j.neuron.2009.10.014. [DOI] [PMC free article] [PubMed] [Google Scholar]
- Lippert M, Logothetis NK, Kayser C. Improvement of visual contrast detection by a simultaneous sound. Brain Res. 2007;1173:102–109. doi: 10.1016/j.brainres.2007.07.050. [DOI] [PubMed] [Google Scholar]
- Makeig S, Debener S, Onton J, Delorme A. Mining event-related brain dynamics. Trends Cogn Sci. 2004;8:204–210. doi: 10.1016/j.tics.2004.03.008. [DOI] [PubMed] [Google Scholar]
- Manly T, Robertson IH. Sustained attention and the frontal lobes. In: Rabbitt P, editor. Methodology of frontal and executive function. Hove, UK: Psychology Press; 1997. pp. 135–150. [Google Scholar]
- Martínez-Montes E, Cuspineda-Bravo ER, El-Deredy W, Sánchez-Bornot JM, Lage-Castellanos A, Valdés-Sosa PA. Exploring event-related brain dynamics with tests on complex valued time-frequency representations. Stat Med. 2008;27:2922–2947. doi: 10.1002/sim.3132. [DOI] [PubMed] [Google Scholar]
- Matell MS, Meck WH. Neuropsychological mechanisms of interval timing behavior. Bioessays. 2000;22:94–103. doi: 10.1002/(SICI)1521-1878(200001)22:1<94::AID-BIES14>3.0.CO;2-E. [DOI] [PubMed] [Google Scholar]
- Mathewson KE, Gratton G, Fabiani M, Beck DM, Ro T. To see or not to see: prestimulus alpha phase predicts visual awareness. J Neurosci. 2009;29:2725–2732. doi: 10.1523/JNEUROSCI.3963-08.2009. [DOI] [PMC free article] [PubMed] [Google Scholar]
- McDonald JJ, Teder-Sälejärvi WA, Hillyard SA. Involuntary orienting to sound improves visual perception. Nature. 2000;407:906–908. doi: 10.1038/35038085. [DOI] [PubMed] [Google Scholar]
- Miniussi C, Wilding EL, Coull JT, Nobre AC. Orienting attention in time: modulation of brain potentials. Brain. 1999;122:1507–1518. doi: 10.1093/brain/122.8.1507. [DOI] [PubMed] [Google Scholar]
- Montemurro MA, Rasch MJ, Murayama Y, Logothetis NK, Panzeri S. Phase-of-firing coding of natural stimuli in primary visual cortex. Curr Biol. 2008;18:375–380. doi: 10.1016/j.cub.2008.02.023. [DOI] [PubMed] [Google Scholar]
- Monto S, Palva S, Voipio J, Palva JM. Very slow EEG fluctuations predict the dynamics of stimulus detection and oscillation amplitudes in humans. J Neurosci. 2008;28:8268–8272. doi: 10.1523/JNEUROSCI.1910-08.2008. [DOI] [PMC free article] [PubMed] [Google Scholar]
- Odgaard EC, Arieh Y, Marks LE. Cross-modal enhancement of perceived brightness: sensory interaction versus response bias. Percept Psychophys. 2003;65:123–132. doi: 10.3758/bf03194789. [DOI] [PubMed] [Google Scholar]
- Sauseng P, Klimesch W, Gruber WR, Hanslmayr S, Freunberger R, Doppelmayr M. Are event-related potential components generated by phase resetting of brain oscillations? A critical discussion. Neuroscience. 2007;146:1435–1444. doi: 10.1016/j.neuroscience.2007.03.014. [DOI] [PubMed] [Google Scholar]
- Schroeder CE, Lakatos P. Low-frequency neuronal oscillations as instruments of sensory selection. Trends Neurosci. 2009;32:9–18. doi: 10.1016/j.tins.2008.09.012. [DOI] [PMC free article] [PubMed] [Google Scholar]
- Shah AS, Bressler SL, Knuth KH, Ding M, Mehta AD, Ulbert I, Schroeder CE. Neural dynamics and the fundamental mechanisms of event-related brain potentials. Cereb Cortex. 2004;14:476–483. doi: 10.1093/cercor/bhh009. [DOI] [PubMed] [Google Scholar]
- Slutsky DA, Recanzone GH. Temporal and spatial dependency of the ventriloquism effect. Neuroreport. 2001;12:7–10. doi: 10.1097/00001756-200101220-00009. [DOI] [PubMed] [Google Scholar]
- Snyder AC, Foxe JJ. Anticipatory attentional suppression of visual features indexed by oscillatory alpha-band power increases: a high-density electrical mapping study. J Neurosci. 2010;30:4024–4032. doi: 10.1523/JNEUROSCI.5684-09.2010. [DOI] [PMC free article] [PubMed] [Google Scholar]
- Stein BE, London N, Wilkonson LK, Price DD. Enhancement of perceived visual intensity by auditory stimuli: a psychophysical analysis. J Cogn Neurosci. 1996;8:497–506. doi: 10.1162/jocn.1996.8.6.497. [DOI] [PubMed] [Google Scholar]
- Teder-Sälejärvi WA, Di Russo F, McDonald JJ, Hillyard SA. Effects of spatial congruity on audio-visual multimodal integration. J Cogn Neurosci. 2005;17:1396–1409. doi: 10.1162/0898929054985383. [DOI] [PubMed] [Google Scholar]
- Thorne JD, De Vos M, Viola FC, Debener S. Cross-modal phase reset predicts auditory task performance in humans. J Neurosci. 2011;31:3853–3861. doi: 10.1523/JNEUROSCI.6176-10.2011. [DOI] [PMC free article] [PubMed] [Google Scholar]
- Van der Burg E, Olivers CNL, Bronkhorst AW, Theeuwes J. Audiovisual events capture attention: evidence from temporal order judgments. J Vis. 2008a;8:1–10. doi: 10.1167/8.5.2. [DOI] [PubMed] [Google Scholar]
- Van der Burg E, Olivers CN, Bronkhorst AW, Theeuwes J. Pip and pop: auditory signals improve spatial visual search. J Exp Psychol Hum Percept Perform. 2008b;34:1053–1065. doi: 10.1037/0096-1523.34.5.1053. [DOI] [PubMed] [Google Scholar]
- Van Orden GC, Holden JG, Turvey MT. Self-organization of cognitive performance. J Exp Psychol Gen. 2003;132:331–350. doi: 10.1037/0096-3445.132.3.331. [DOI] [PubMed] [Google Scholar]
- VanRullen R, Reddy L, Koch C. The continuous wagon wheel illusion is associated with changes in EEG power around 13 Hz. J Neurosci. 2006;26:502–507. doi: 10.1523/JNEUROSCI.4654-05.2006. [DOI] [PMC free article] [PubMed] [Google Scholar]
- VanRullen R, Carlson T, Cavanagh P. The blinking spotlight of attention. Proc Natl Acad Sci U S A. 2007;104:19204–19209. doi: 10.1073/pnas.0707316104. [DOI] [PMC free article] [PubMed] [Google Scholar]
- Whittingstall K, Logothetis NK. Frequency-band coupling in surface EEG reflects spiking activity in monkey visual cortex. Neuron. 2009;64:281–289. doi: 10.1016/j.neuron.2009.08.016. [DOI] [PubMed] [Google Scholar]
- Worden MS, Foxe JJ, Wang N, Simpson GV. Anticipatory biasing of visuospatial attention indexed by retinotopically specific alpha-band electroencephalography increases over occipital cortex. J Neurosci. 2000;20(RC63):1–6. doi: 10.1523/JNEUROSCI.20-06-j0002.2000. [DOI] [PMC free article] [PubMed] [Google Scholar]
- Zikopoulos B, Barbas H. Circuits for multisensory integration and attentional modulation through the prefrontal cortex and the thalamic reticular nucleus in primates. Rev Neurosci. 2007;18:417–438. doi: 10.1515/revneuro.2007.18.6.417. [DOI] [PMC free article] [PubMed] [Google Scholar]