Abstract
Non-symmetric substitution of salen (1R1,R2) and reduced salen (2R1,R2) CuII-phenoxyl complexes with a combination of -tBu, -SiPr, and -OMe substituents leads to dramatic differences in their redox and spectroscopic properties, providing insight into the influence of the cysteine-modified tyrosine cofactor in the enzyme galactose oxidase (GO). Using a modified Marcus-Hush analysis, the oxidized copper complexes are characterized as Class II mixed-valent due to the electronic differentiation between the two substituted phenolates. Sulfur K-edge X-ray absorption spectroscopy (XAS) assesses the degree of radical delocalization onto the single sulfur atom of non-symmetric [1tBu,SMe]+ at 7%, consistent with other spectroscopic and electrochemical results that suggest preferential oxidation of the -SMe bearing phenolate. Estimates of the thermodynamic free-energy difference between the two localized states (ΔG∘) and reorganizational energies (λR1R2) of [1R1,R2]+ and [2R1,R2]+ leads to accurate predictions of the spectroscopically observed IVCT transition energies. Application of the modified Marcus-Hush analysis to GO using parameters determined for [2R1,R2]+ predicts a νmax of ~ 13600 cm−1, well within the energy range of the broad Vis-NIR band displayed by the enzyme.
Introduction
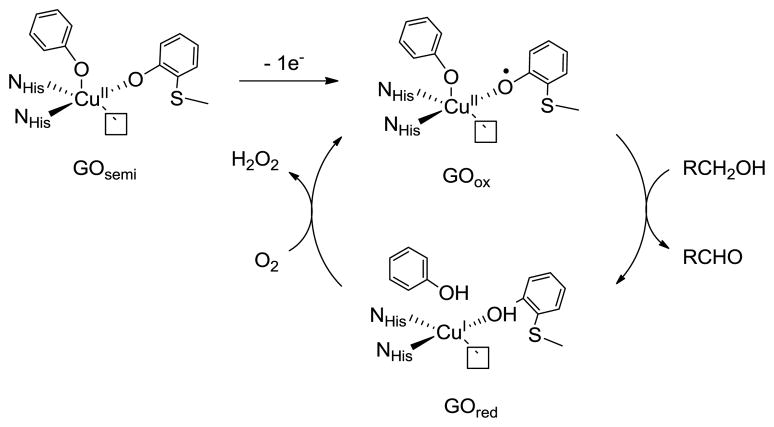
The enzyme galactose oxidase (GO) catalyzes the two-electron, two-proton oxidation of primary alcohols to aldehydes with concomitant two-electron, two-proton reduction of dioxygen to hydrogen peroxide.1,2 The active site contains a mononuclear copper center ligated by two equatorial histidines, one axial unmodified tyrosine, and an equatorial tyrosine that is covalently cross-linked to a neighboring cysteine residue in an oxidative post-translational modification (Scheme 1).3–5 The two catalytically relevant forms, reduced (GOred) and oxidized (GOox), contain a CuI-tyrosine unit and a CuII-cysteine modified tyrosyl radical, respectively, while the inactive semi-reduced form (GOsemi) exists as a CuII-tyrosine species.
Scheme 1.
Active site and consensus mechanism of GO
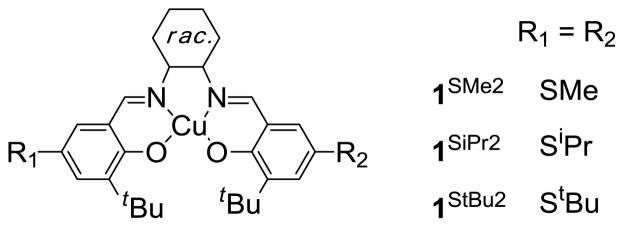
Delocalization of the tyrosyl radical onto the thioether bridge, which is predicted by density functional theory (DFT) computations6,7 and EPR studies of copper-free GO,8 is postulated to contribute to the energetic stabilization of GOox (t1/2 = 7.2 days).1 We have recently reported a detailed analysis of the electrochemical and spectroscopic properties of a series of symmetric para-alkylsulfanyl substituted CuII-bis-imine, bis-phenolate model complexes (1SR2, Scheme 2) and have quantified the degree of radical delocalization onto the sulfur atoms using sulfur K-edge X-ray absorption spectroscopy (XAS).9
Scheme 2.
Structure of 1SR2
Several examples of GO model complexes of tripodal ligands containing two different phenolates exist in the literature.10–12 Access to non-symmetric salen-like ligands was problematic until a two-step procedure was reported by Campbell and Nguyen.13 Such ligands allow for exploration of the impact of the electronic asymmetry of non-symmetric salen metal complexes in catalysts and materials,14–17 and provide access to model complexes possessing greater structural and electronic fidelity to GO.
Wen and coworkers have used titanium-salen complexes, non-symmetrically substituted with Lewis basic substituents for the cyanosilation of aldehydes.18 Herrero and coworkers have reported the decoration of a Mn(III)-salen complex with a Ru photosesitizer, which results in light induced oxidation to a Mn(IV) high-spin intermediate.19 Nakano and coworkers have shown the use of non-symmetric Cr-salen complexes containing either reduced or substituted imine bonds as epoxide-CO2 copolymerization catalysts.20 Kochem and coworkers have investigated the effect of substituent protonation on the locus of oxidation in non-symmetric Ni-salen complexs.21 Recently, Kurahashi and Fujii reported the study of one-electron oxidized non-symmetric Mn- and Ni-salen complexes using a similar approach to the one presented here.22
The thioether modification within GO model complexes generally focuses on ortho-alkylsulfanyl substituted phenolates. In this work, complexes purposefully bearing a single alkylsulfanyl substituent in the para position are examined (Scheme 3); the para positioning assures minimal copper coordination changes within the series of complexes with sterically abutting ortho-t-butyl substituents on the phenolates. To generalize the results, the scope of this study was expanded in two ways: first, in addition to tert-butyl (-tBu) and isopropylsulfanyl (-SiPr) substituents, phenolates with methoxy (-OMe) substituents are included in this study.23,24 Second, the 2R1,R2 analogs of 1R1,R2 wherein the two carbon-nitrogen imine bonds in the ligand backbone are reduced have been characterized in parallel. The 2R1,R2 complexes display electrochemical and spectroscopic features similar to those observed for 1R1,R2, and reduction of the imines helps to clarify the near-UV optical transitions by eliminating transitions within the imine functional groups.25 The set of testable systems is therefore greatly expanded. Complexes with identical phenolates will be referred to as “symmetric” complexes, while complexes with combinations of -tBu, -SiPr, and -OMe substituents will be referred to as “non-symmetric” complexes.
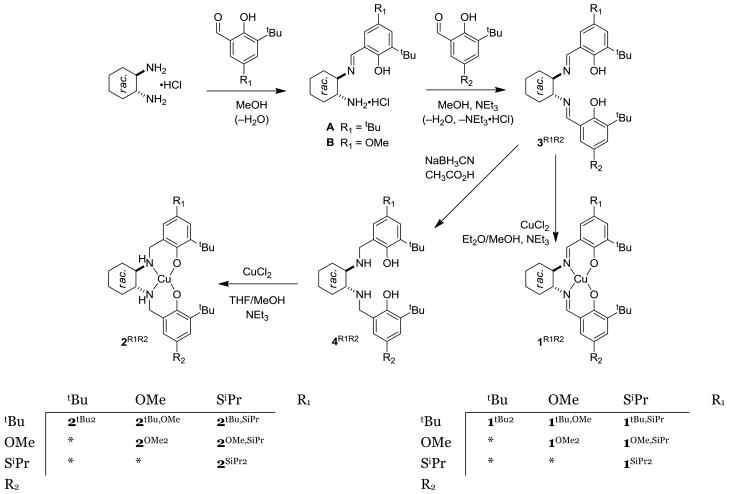
Scheme 3.
Synthetic scheme for CuII-phenolate complexes
*duplicate
GOox and [1SR2]+ (Scheme 2) are mixed-valent species in which the π-orbitals of the phenolate and phenoxyl radical rings comprise redox-active centers that are bridged by d-orbitals of the CuII center. In [1SR2]+, the π-orbitals of the parent phenolate rings are iso-energetic and the radical hole could fully localize on one ring (Class I), partially localize (Class II), or fully delocalize over both rings (Class III), following the Robin-Day classification scheme.26–28 We have shown previously that subtle ligand perturbations can lead to radical localization on electron rich phenolate moieties in salen-metal complexes.29 Extending this idea to phenolates bearing para substituents, we expect the radical to localize on the phenolate bearing the most electron-donating substituent (i.e. -OMe > -SiPr > -tBu). A Marcus-Hush analysis of the NIR absorptions of [1SR2]+, attributed to inter-valence charge transfer (IVCT) transitions, suggests that these complexes are best described as Class II mixed-valent.9 This transition between two ligands in distinct oxidation states may also be described as ligand-to-ligand charge transfer.30 A similar conclusion results for the non-symmetric complexes with a free-energy driving force for partial radical localization on the phenolate bearing the more electron-donating substituent.9 Sulfur K-edge X-ray absorption spectroscopy (XAS) probes the amount of hole delocalization onto the sulfur atom of a complex most structurally relevant to GOox, verifying the locus of oxidation on the sulfanyl substituted phenolate moiety.
Experimental Details
Materials and Methods
Reagents and solvents were commercially available and used as received unless noted otherwise. Triethylamine was distilled from CaH2 and methanol was dried using activated 3 Å molecular sieves prior to use. 3-tert-Butyl-5-methoxysalicylaldehdye,31 3-tert-butyl-5-isopropylsulfanylsalicylaldehyde, 3-tert-butyl-5-methylsulfanylsalicylaldehyde, 3SiPr2, and 1SiPr2 were synthesized by reported procedures.25 1H-NMR spectra were obtained on a Varian XL-400 spectrometer operating at 400 MHz; all samples were dissolved in CDCl3. Cyclic voltammetry was performed using a BAS CV-40 potentiometer, a AgCl/Ag wire reference electrode, a graphite disk working electrode, and a Pt wire counter electrode with 0.1 M Bu4NClO4 solutions in CH2Cl2; ferrocene or decamethylferrocene (E1/2∘ = −530 mV vs. Fc+/Fc) was added as an internal standard. Electronic (UV-Vis-NIR) spectra were collected using a Cary 50 split beam spectrophotometer (190–1100 nm), or a Cary 500 dual beam spectrophotometer (300–3300 nm). X-band EPR spectra were obtained using a Bruker EMX spectrometer, a ER041XG microwave bridge and ER4102ST cavity, with samples held in a liquid nitrogen-filled finger dewar; EPR intensities refer to values obtained by double-integration of the first harmonic spectrum. Mass spectral services were provided by the Mass Spectrometry Facility of the University of California, San Francisco (MALDI-TOF and ESI) or by Stanford University Mass Spectrometry (ESI).
3OMe2
To a solution of 3-tert-butyl-5-methoxysalicylaldehyde (416 mg, 2.0 mmol) in 7.5 mL methanol was added racemic trans-1,2-diaminocyclohexane (120 μL, 114 mg, 1.0 mmol). The solution was heated to reflux for 10 minutes, then cooled and left to stand at −20°C for 2 hrs. The resulting precipitate was isolated by filtration and washed with cold methanol. Yield: 440 mg (91%) of a yellow solid. 1H-NMR: δ 13.50 (s, 2H, OH), 8.24 (s, 2H, CH=N), 6.89 (d, J=3.0 Hz, 2H, ArH), 6.47 (d, J=3.0 Hz, 2H, ArH), 3.68 (s, 6H, OCH3), 3.31 (m, 2H, N-CyH), 2.0-1.2 (br m, 6H, CyH), 1.39 (s, 18H, C(CH3)3). ESI-MS: m/z 495 (M+1).
N-(3,5-di-tert-butyl-2-hydroxybenzylidene)-trans-1,2-diaminocyclohexane hydrochloride (A). The following procedure is adapted from that of Campbell and Nguyen.13 To a solution of NH4Cl (161 mg, 3.0 mmol) in dry methanol (10 mL) was added racemic trans-1,2-diaminocyclohexane (360 μL, 342 mg, 3.0 mmol). The solvent was removed under reduced pressure to give racemic trans-1,2-diaminocyclohexane monohydrochloride in quantitative yield (452 mg, corresponding to loss of 1 eq of NH3). The hydrochloride salt was then redissolved in dry methanol (10 mL) and a solution of 3,5-di-tert-butylsalicylaldehyde (702 mg, 3.0 mmol) in dry methanol (15 mL) was added. After stirring for 5 minutes, the solvent was removed under reduced pressure to give a yellow syrup. Ether (5 mL) was added to induce precipitation of a white solid. After addition of another 20 mL of ether, the solid was isolated by filtration, washed with ether, washed with water, and then washed again with ether to give A as a white solid. Yield: 820 mg (75%).
N-(3-tert-butyl-2-hydroxy-5-methoxybenzylidene)-trans-1,2-diaminocyclohexane hydrochloride (B). This compound was synthesized by the same procedure used for A, using instead 3-tert-butyl-5-methoxysalicylaldehyde (208 mg, 1 mmol scale). Yield: 200 mg (59%) of a light orange solid.
3tBu,OMe
To a solution of A (183 mg, 0.50 mmol) in dry methanol (5 mL) was added a solution of 3-tert-butyl-5-methoxysalicylaldehyde (104 mg, 0.50 mmol) and tri-ethylamine (140 μL, 101 mg, 1.0 mmol) in 5 mL methanol at room temperature (RT). The solvent was then removed under reduced pressure. The resulting yellow solid was purified by column chromatography (5% ethyl acetate/hexanes on silica) to obtain the desired product. Yield: 130 mg (50%) of a yellow solid. 1H-NMR: δ 13.71 (s, 1H, ArOH), 13.48 (s, 1H, ArOH), 8.27 (s, 1H, ArCH=N), 8.24 (s, 1H, ArCH=N), 7.30 (d, J=2.3 Hz, 1H, ArH), 6.95 (d, J=2.4 Hz, 1H, ArH), 6.88 (d, J=3.0 Hz, 1H, ArH), 6.46 (d, J=3.0 Hz, 1H, ArH), 3.67 (s, 3H, ArOCH3), 3.30 (m, 2H, N–CCyH), 2.0-1.2 (br m, 6H, CyH), 1.41 (s, 9H, C(CH3)3), 1.39 (s, 9H, C(CH3)3), 1.23 (s, 9H, C(CH3)3). MALDI-TOF-MS: m/z 521 (M+1).
3tBu,SiPr
This compound was synthesized and purified by the same procedure used for 3tBu,OMe, using instead 3-tert-butyl-5-isopropylsulfanylsalicylaldehyde (126 mg, 0.50 mmol). Yield: 140 mg (49%) of a yellow solid. 1H-NMR: δ 14.09 (s, 1H, ArOH), 13.65 (s, 1H, ArOH), 8.29 (s, 1H, ArCH=N), 8.24 (s, 1H, ArCH=N), 7.34 (d, J=2.2 Hz, 1H, ArH), 7.31 (d, J=2.3 Hz, 1H, ArH), 7.13 (d, J=2.2 Hz, 1H, ArH), 6.97 (d, J=2.4 Hz, 1H, ArH), 3.33 (m, 2H, N–CCyH), 3.06 (septet, J=6.6 Hz, 1H, SCHMe2), 2.0-1.2 (br m, 6H, CyH), 1.41 (s, 9H, C(CH3)3), 1.39 (s, 9H, C(CH3)3), 1.23 (s, 9H, C(CH3)3), 1.17 (d, J=6.6 Hz, 6H, CH(CH3)2). ESI-MS: m/z 565 (M+1).
3OMe,SiPr
This compound was synthesized and purified by the same procedure used for 3tBu,OMe, using instead B (170 mg, 0.50 mmol) and 3-tert-butyl-5-isopropylsulfanyl-salicylaldehyde (126 mg, 0.50 mmol). Yield: 167 mg (62%) of a yellow solid. 1H-NMR: δ 14.07 (s, 1H, ArOH), 13.41 (s, 1H, ArOH), 8.23 (s, 1H, ArCH=N), 8.22 (s, 1H, ArCH=N), 7.34 (d, J=2.1 Hz, 1H, ArH), 7.11 (d, J=2.2 Hz, 1H, ArH), 6.89 (d, J=3.0 Hz, 1H, ArH), 6.46 (d, J=3.0 Hz, 1H, ArH), 3.68 (s, 3H, ArOCH3), 3.32 (m, 2H, N–CCyH), 3.04 (septet, J=6.6 Hz, 1H, SCHMe2), 2.0-1.2 (br m, 6H, CyH), 1.39 (s, 18H, overlapping C(CH3)3), 1.16 (d, J=6.7 Hz, 6H, CH(CH3)2). MALDI-TOF-MS: m/z 543 (M+1).
4OMe2
3OMe2 (90 mg, 0.18 mmol) and sodium cyanoborohydride (29 mg, 0.45 mmol) were placed in a test tube and acetic acid (0.75 mL) was added. The resulting suspension was stirred for 5 min, after which 0.75 mL of methanol were added and stirring was continued for another 30 min. The solution was then diluted with 10 mL of water, neutralized with 1 M potassium hydroxide (~15 mL) and extracted with ether (2 × 5 mL). The ether solution was washed with saturated aqueous sodium bicarbonate (5 mL), then dried over anhydrous K2CO3, filtered and evaporated to give an off-white solid. Yield: 90 mg (98%). 1H-NMR: δ 6.79 (d, J=2.9 Hz, 2H, ArH), 6.43 (d, J=2.7 Hz, 2H, ArH), 4.03 (d, J=13.2 Hz, 2H, Ar-CHaHb-N), 3.90 (d, J=13.5 Hz, 2H, Ar-CHaHb-N), 3.75 (s, 6H, ArOCH3), 2.4-1.2 (br m, 8H, CyH), 1.36 (s, 18H, C(CH3)3). ESI-MS: m/z 499 (M+1).
4SiPr2
This compound was synthesized by the same procedure used for 4OMe2 using 3SiPr2 (100 mg, 0.17 mmol) as the starting material. Yield: 90 mg (88%) of a white solid. 1H-NMR: δ 7.28 (d, J=2.0 Hz, 2H, ArH), 6.99 (d, J=2.0 Hz, 2H, ArH), 4.04 (d, J=13.7 Hz, 2H, ArCHaHb-N), 3.90 (d, J=13.5 Hz, 2H, Ar-CHaHb-N), 3.13 (septet, J=6.5 Hz, 2H, SCHMe2), 2.4-1.2 (br m, 8H, CyH), 1.34 (s, 18H, C(CH3)3), 1.23 (d, J=6.5, 12H, CH(CH3)2). MALDI-TOF-MS: m/z 648 (M+1).
4tBu,OMe
This compound was synthesized by the same procedure used for 4OMe2 using 3tBu,OMe (65 mg, 0.13 mmol) as the starting material. Yield: 62 mg (95%) of an off-white solid. 1H-NMR: δ 7.22 (d, J=2.4 Hz, 1H, ArH), 6.87 (d, J=2.3 Hz, 1H, ArH), 6.79 (d, J=3.0 Hz, 1H, ArH), 6.44 (d, J=3.0 Hz, 1H, ArH), 4.06 (d, J=13.4 Hz, 1H, ArCHaHb-N), 4.01 (d, 13.6 Hz, 1H, Ar-CHaHb-N), 3.92 (d, J=13.5 Hz, 1H, Ar-CHaHb-N), 3.90 (d, J=13.2 Hz, 1H, ArCHaHb-N), 3.75 (s, 3H, ArOCH3), 2.4-1.2 (br m, 8H, CyH), 1.38 (s, 9H, C(CH3)3), 1.36 (s, 9H, C(CH3)3), 1.29 (s, 9H, C(CH3)3). ESI-MS: 525 (M+1).
4tBu,SiPr
This compound was synthesized by the same procedure used for 4OMe2 using 3tBu,SiPr (70 mg, 0.13 mmol) as the starting material. Yield: 67 mg (96%) of a white solid. 1H-NMR: δ 7.28 (d, J=2.1 Hz, 1H, ArH), 7.22 (d, J=2.4 Hz, 1H, ArH), 6.99 (d, J=2.0 Hz, 1H, ArH), 6.87 (d, J=2.3 Hz, 1H, ArH), 4.07 (d, J=13.4 Hz, 1H, ArCHaHb-N), 4.01 (d, J=13.4 Hz, 1H, Ar-CHaHb-N), 3.91 (d, J=13.6 Hz, 1H, Ar-CHaHb-N), 3.89 (d, J=13.4 Hz, 1H, ArCHaHb-N), 3.13 (septet, J=6.7 Hz, 1H, SCHMe2), 2.4-1.2 (br m, 8H, CyH), 1.36 (s, 9H, C(CH3)3), 1.35 (s, 9H, C(CH3)3), 1.28 (s, 9H, C(CH3)3), 1.23 (d, J=6.6 Hz, 6H, CH(CH3)2). MALDI-TOF-MS: m/z 569 (M+1).
4OMe,SiPr
This compound was synthesized by the same procedure used for 4OMe2 using 3OMe,SiPr (67 mg, 0.13 mmol) as the starting material. Yield: 61 mg (91%) of a white solid. 1H-NMR: δ 7.28 (d, J=2.2 Hz, 1H, ArH), 6.99 (d, J=2.0 Hz, 1H, ArH), 6.79 (d, J=3.0 Hz, 1H, ArH), 6.43 (d, J=2.9 Hz, 1H, ArH), 4.05 (d, J=13.5 Hz, 1H, ArCHaHb-N), 4.02 (d, J=13.4 Hz, 1H, Ar-CHaHb-N), 3.90 (d, J=13.6 Hz, 1H, Ar-CHaHb-N), 3.89 (d, J=13.6 Hz, ArCHaHb-N), 3.74 (s, 3H, ArOCH3) 3.13 (septet, J=6.6 Hz, 1H, SCHMe2), 2.4-1.2 (br m, 8H, CyH), 1.35 (s, 9H, C(CH3)3), 1.34 (s, 9H, C(CH3)3), 1.24 (d, J=6.6 Hz, 6H, CH(CH3)2).
1OMe2
To a solution of 3OMe2 (150 mg, 0.30 mmol) in ether (5 mL) was added a solution of Cu(CH3CO2)2·H2O (61 mg, 0.30 mmol) in methanol (5 mL) and NEt3 (100 μL, 70 mg, 0.70 mmol). The volume of the mixture was reduced in vacuum, and the resulting precipitate was isolated by filtration, washed with methanol and ether, and dried in vacuum. Yield: 148 mg (88%) of a brown powder. Calculated (found) for C30H40CuN2O4·H2O: C 62.75 (62.99); H 7.37 (7.35); N, 4.88 (4.63). ESI-MS: m/z 556 (M(63Cu)+1).
1tBu,OMe
To a solution of 3tBu,OMe (50 mg, 96 μmol) and NEt3 (40 μL, 30 mg, 300 μmol) in dry ether (2 mL) was added a solution of anhydrous CuCl2 (13 mg, 100 μmol) in dry methanol (1 mL). After stirring briefly, a precipitate formed, which was removed by filtration, washed with methanol and ether, and dried in vacuum. Yield: 37 mg (66%) of a brown solid. ESI-MS: m/z 582 (M(63Cu)+1).
1tBu,SiPr
To a solution of 3tBu,SiPr (50 mg, 89 μmol) and NEt3 (40 μL, 30 mg, 300 μmol) in dry ether (2 mL) was added a solution of anhydrous CuCl2 (13 mg, 100 μmol) in dry methanol (1 mL). After a brief stirring, the ether was removed under reduced pressure, and the resulting precipitate was isolated by filtration, washed with methanol, and dried in vacuum. Yield: 46 mg (83%) of fine brown needles. MALDI-TOF-MS: m/z 626 (M(63Cu)+1).
1OMe,SiPr
This compound was prepared by the same procedure used for 1tBu,OMe using instead the precursor 3OMe,SiPr (50 mg, 93 μmol). Yield: 48 mg (86%) of a green solid. ESI-MS: m/z 599 (M(63Cu)).
2OMe2
To a solution of 4OMe2 (50 mg, 0.10 mmol) and NEt3 (40 μL, 30 mg, 0.3 mmol) in ether (1 mL) was added a solution of anhydrous CuCl2 (13 mg, 0.10 mmol) in dry methanol (2 mL). The solvent was promptly removed under reduced pressure. The solid residue that resulted was washed with ethyl acetate (5 mL), and the washings were filtered and evaporated. This residue was suspended in ether (1 mL), and hexanes (5 mL) were added to aid precipitation of a green solid that was isolated by filtration, washed with hexanes, and dried in vacuo. Yield: 38 mg (68%). Calculated (found) for C30H44CuN2O4: C 64.32 (64.07); H 7.92 (7.69); N, 5.00 (4.76). ESI-MS: m/z 560 (M(63Cu)+1).
2SiPr2
The method used to synthesize 2OMe2 was used to synthesize this compound, using instead 4SiPr2 (50 mg, 0.09 mmol) as the ligand precursor. Yield: 46 mg (84%) of a green solid. Calculated (found) for C34H52CuN2O2S2: C 62.97 (63.09); H 8.08 (7.89); N 4.32 (4.55). MALDI-TOF-MS: m/z 648 (M(63Cu)+1).
2tBu,OMe
The method used to synthesize 2OMe2 was used to synthesize this compound, using instead 4tBu,OMe (50 mg, 0.09 mmol) as the ligand precursor. Yield: 37 mg (66%) of a green solid. ESI-MS: m/z 586 (M(63Cu)+1).
2tBu,SiPr
The method used to synthesize 2OMe2 was used to synthesize this compound, using instead 4tBu,SiPr (50 mg, 0.09 mmol) as the ligand precursor. Yield: 32 mg (58%) of a green solid. MALDI-TOF-MS: m/z 630 (M(63Cu)+1).
2OMe,SiPr
The method used to synthesize 2OMe2 was used to synthesize this compound, using instead 4OMe,SiPr (50 mg, 0.09 mmol) as the ligand precursor. Yield: 17 mg (31%) of a green solid. ESI-MS: m/z 604 (M(63Cu)+1).
Spectrophotometric titrations
A saturated solution of thianthrenyl hexafluoroantimonate (Th•+ SbF6−; ca. 0.4 mM) was freshly generated by stirring ~20 mg Th•+ SbF6− in 10 mL CH2Cl2 for 30 min at RT under N2. Concentration of Th•+ in solution was determined by spectrophotometric titration of cobaltocene (ε30300 = 7600 M−1 cm−1). Spectra (3050 – 35000 cm−1) were obtained for 0.1 mM CH2Cl2 solutions of 1R1,R2 and 2R1,R2. Aliquots (100 μL) of the Th•+ solution were then added and spectra were acquired after each addition until no further spectral changes occurred or excess Th•+ (ε18200 = 8500 M−1 cm−1) became apparent. Spectra were corrected for dilution. Spectra with the maximal NIR absorption was taken to best represent spectra of [1R1R1]+ and [2R1R1]+, and spectra with maximal visable absorptions (ca. 16000 cm−1) were taken to best represent spectra of [1R1R1]2+ and [2R1R1]2+.
EPR sample preparation
Solutions of 1SR2 (0.1 mM in CH2Cl2) were titrated spectrophotometrically (at RT or 200 K) with freshly prepared saturated solutions of Th•+ while being monitored in the visible region to determine end point for formation of the oxidized species. Aliquots of the titrated solutions were then transferred to quartz tubes and frozen in LN2. Samples of 1R1,R2 and 2R1,R2 were measured under the same conditions for spin-quantitation.
S K-edge XAS sample preparation
For [1tBu,SMe]+ solid samples, CH2Cl2 solutions of 1tBu,SMe oxidized using 1 eq Ac2Fc+SbF6− 9 at RT under N2 were evaporated and used without further purification. Samples were ground into a fine powder and spread on sulfur-free Kapton tape as thinly as possible to minimize the possibility of self-absorption. The tape was mounted across the window of an aluminum plate, which was affixed inside the sample chamber. For air sensitive compounds, the sample preparation and mounting was performed in an inert atmosphere glovebox (less than 0.5 ppm O2), sealed in a vial and brought to the beamline where it was inserted into a helium purged glove bag attached to the sample chamber. The aluminum plate was then affixed into the sample chamber with less than 1.0 ppm O2.
XAS data were collected at the Stanford Synchrotron Radiation Lightsource using beam line 4-3 with a fully tuned Si(111) double crystal monochromator and a Rh-coated harmonic rejection mirror under ring conditions of 180–200 mA and 3.0 GeV. All S K-edge measurements were taken at RT and measured in fluorescence mode with a Lytle detector. All data were externally calibrated assigning the first feature in the S K-edge spectrum of Na2S2O3 to 2472.02 eV. Calibration scans were collected before and after every sample to ensure beamline calibration accuracy. In all cases the shift in calibration was less than 0.1 eV. Typically three scans were collected of each sample and averaged to provide reproducibility and to decrease the noise level of the data. A smooth linear background was fit to the pre-edge region and removed from the entire spectrum of the averaged data. The data were normalized to an edge jump of 1.0 at 2470 eV. The pre-edge and whiteline features of the data (2469–2477 eV) were fit using Edg_Fit, part of the EXAFSPAK program suite.32 The data were fit using features comprised of a 1:1 mixture of Lorentzian to Gaussian lineshapes. For each feature in each fit, the energy, amplitude and half-width were allowed to vary. In all cases, a minimum number of features were used that successfully fit both the data and the second derivative of the data. Values reported for peak areas are calculated as peak amplitude times full-width at half-max. The %S hole values were evaluated in accordance with previous reported procedures.9,33,34
Results and Analysis
1. Synthesis
Two equivalents of 3-tert-butyl-5-methoxysalicylaldehyde31 or 3-tert-butyl-5-isopropylsulfanylsalicylaldehyde were condensed with racemic trans-1,2-diaminocyclohexane to prepare 3OMe2 or 3SiPr2, respectively (Scheme 3). Reduction of either diimine with sodium cyanoborohydride in acetic acid gave ligands 4OMe2 and 4SiPr2 in high yields.35 Metallation of these ligands using anhydrous CuCl2 and NEt3 proceeded with high yields of the corresponding symmetric copper complexes: 1SiPr2, 1OMe2, 2SiPr2, and 2OMe2. For the latter two complexes, there is a concern of possibly auto-oxidizing the ArCH2-NHCy bonds. In nickel(II) and cobalt(II) complexes of similar ligands, aerobic oxidation of these bonds is facile.36 This was avoided by using a rapid metallation procedure, and no undesirable oxidation was apparent in characterization of the products. 1tBu2 and 2tBu were synthesized as previously reported.9,25
Construction of non-symmetric ligands was achieved by condensing the first equivalent of salicylaldehyde with the monohydrochloride salt of racemic trans-1,2-diaminocyclohexane.13 The second condensation is slowed considerably and the mono-imine products (A or B, Scheme 3) can be isolated in good yield. Addition of triethylamine with the second equivalent of salicylaldehyde deprotonates the hydrochloride salt and allows six non-symmetric ligands 3R1,R2 (R1, R2 = tBu, SiPr, OMe) to be formed. Reduction of 3R1,R2 with sodium cyanoborohydride in acetic acid gave 4R1,R2 in high yields. The methods used for introduction of copper into the symmetric ligands were also used for the non-symmetric ligands. To forestall salicylaldehyde exchange, metallation of 3R1,R2 was performed under anhydrous conditions (ether/methanol) that rapidly precipitate 1R1,R2.
2. UV-Vis spectroscopy of neutral complexes
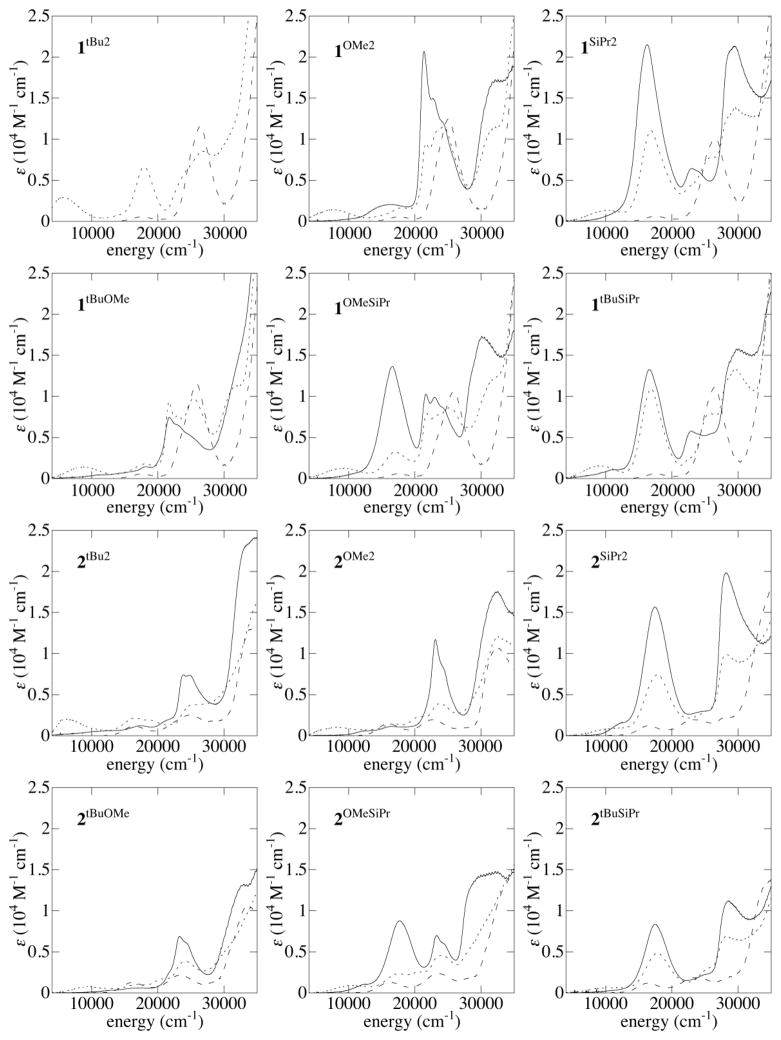
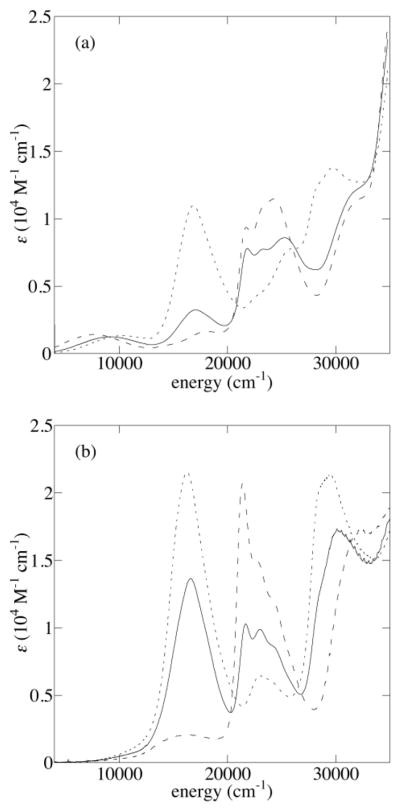
The neutral complexes 1R1,R2 have nearly identical absorption spectra containing an envelope of d-d transitions near 17500 cm−1 (570 nm), an intense near-UV band near 26000 cm−1 arising from a combination of phenolate-copper(II) ligand-to-metal charge transfer (LMCT) and/or Schiff base π - π * transitions, and UV absorptions arising from the aromatic moieties (Figure 2). The neutral forms of 2R1,R2 also have similar UV-Vis spectra, the main features being the d–d envelope near 16500 cm−1 and phenolate-copper(II) LMCT bands near 23000 cm−1; both absorptions are red-shifted in the bis-methoxy complex, 2OMe2.
Figure 2.
UV-Vis-NIR spectra of 1R1,R2 and 2R1,R2 (dashed), [1R1,R2]+ and [2R1,R2]+ (dotted), and [1R1,R2]2+ and [2R1,R2]2+ (solid) in CH2Cl2
3. EPR spectroscopy of neutral complexes
Frozen solution EPR spectra (Figure S1) of these complexes (CH2Cl2, 77 K) are very similar among the 1R1,R2 and 2R1,R2 series and can be simulated with the same set of g values and hyperfine coupling constants (1R1,R2: g|| = 2.19, g⊥ = 2.04, A|| = 205 G, A⊥ ≈ 30 G, A⊥N ≈ 15 G; 2R1,R2: g|| = 2.21, g⊥ = 2.04, A|| = 190 G, A⊥ ≈ 40 G, A⊥N ≈ 8 G; A⊥ is not resolved in all cases due to broadening). These spectroscopic results indicate that all 1R1,R2 and 2R1,R2 exist as monomeric, nearly planar complexes with the intended homology of coordination around the copper center.
4. Electrochemistry
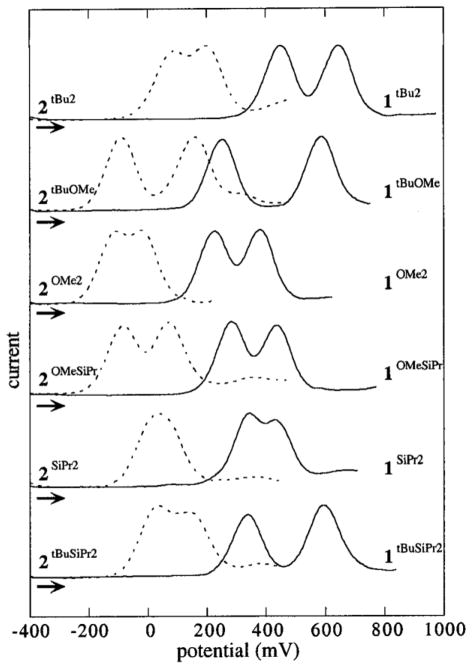
Results from differential pulse voltammetry (DPV, Figure 1) indicate that all of the complexes display two phenolate-based oxidation processes at potentials near or greater than the Fc∘/+ redox couple (0 mV) to form copper(II)-phenoxyl monocations ([1R1,R2]+, [2R1,R2]+) and copper(II)-bis(phenoxyl) dications ([1R1,R2]2+, [2R1,R2]2+).37
Figure 1.
Differential pulse voltammograms of copper complexes 1R1,R2 (solid lines) and 2R1,R2 (dotted lines). Conditions: CH2Cl2 with 0.1 M Bu4NClO4, 1 mM Cu. mV vs Fc∘/+
In general, the oxidation potentials for complexes 1R1,R2 are higher than those of 2R1,R2 by ca. 350 mV (Table 1). The reduction of the electron-withdrawing imines in 1R1,R2 to amines in 2R1,R2 makes the phenolates easier to oxidize. Among the symmetric complexes (R1 = R2), those bearing -OMe groups are oxidized at lower potentials than those bearing -SiPr groups. This order matches the electron-donating properties expected from Hammett σ+ constants of these substituents.38
Table 1.
Electrochemical data for copper complexes 1R1,R2 and 2R1,R2
| complex | E1 (mV) | E2 (mV) | Eave (mV) | ΔE (mV) | Kc |
|---|---|---|---|---|---|
| 1tBu2 | 450 | 650 | 550 | 200 | 2500 |
| 1tBu,OMe | 250 | 590 | – | 340 | 6 × 10⁵ |
| 1OMe2 | 240 | 400 | 320 | 160 | 500 |
| 1OMe,SiPr | 280 | 435 | – | 155 | 400 |
| 1SiPr2 | 340 | 440 | 385 | 110 | 70 |
| 1tBu,SiPr | 340 | 595 | – | 255 | 2 × 10⁴ |
| 2tBu2 | 80 | 210 | 145 | 130 | 160 |
| 2tBu,OMe | −90 | 160 | – | 250 | 2 × 10⁴ |
| 2OMe2 | −120 | −10 | −65 | 110 | 70 |
| 2OMe,SiPr | −90 | 70 | – | 160 | 500 |
| 2SiPr2 | 10 | 80 | 45 | 70 | 15 |
| 2tBu,SiPr | 25 | 150 | – | 125 | 130 |
For the non-symmetric complexes (R1 ≠ R2), the two redox couples observed can be correlated to the sequential oxidation of the two phenolates: the more electron-rich phenolate at the lower potential and the less electron-rich phenolate at the higher potential.
5. UV-Vis-NIR spectroscopy of phenoxyl complexes
Spectrophotometric titrations of 1R1,R2 and 2R1,R2 with Th•+SbF6− (E∘ = +890 mV vs. Fc+/Fc) in CH2Cl2 result in the formation of one- and two-electron oxidized complexes: [1R1,R2]+/2+ and [2R1,R2]+/2+ (Figure 2).39–41 The use of low dielectric solvent (CH2Cl2) precludes complex dissociation as evidenced by the reversibility of the oxidations by titrations with ferrocene.
Spectra of [1R1,R2]+/2+ and [2R1,R2]+/2+ are particularly useful for identifying UV-Vis spectroscopic signatures of -OMe and -SiPr substituted phenoxyls. The spectrum of [1OMe2]+ contains a pair of intense, narrow transitions near 21400 and 22700 cm−1, which resemble those seen previously for para-OMe complexes;42 upon double oxidation to [1OMe2]2+, these absorptions roughly double in intensity, corresponding to formation of two coordinated phenoxyls.42
A similar pair of absorptions is seen in the spectra of [2OMe2]+ and [2OMe2]2+ near 23400 and 24400 cm−1, respectively. These transitions appear near 16500 and 17500 cm−1 in the spectra of [1SiPr2]+/2+ and [2SiPr2]+/2+, respectively, leading to deep blue and purple colors in solution. The intensity of these absorptions in the spectra of [1SiPr2]2+ and [2SiPr2]2+ is ca. double that observed in the spectra of [1SiPr2]+ and [2SiPr2]+, supporting their assignment as intra-ring sulfur-aryl π - π * transitions. Complexes with ortho-methylsulfanylphenoxyl groups give rise to similar transitions, albeit at lower energies and with lesser intensity.43,44 Intense absorptions in the UV region (ca. 29000 cm−1) also appear to be characteristic of the -SiPr substituted phenoxyls.
The absorption spectra of the non-symmetric complexes contain similar aryl π - π * transitions as the symmetric complexes, and the energy of these transitions indicate the sequence in which the different phenolates are oxidized. For example, the spectrum of [1OMe,SiPr]+ shows intense features associated with a -OMe substituted phenoxyl near 21800 cm−1 and 23000 cm−1 and little intensity near 16000 cm−1, the region expected for an -SiPr substituted phenoxyl; the -OMe substituted phenolate is oxidized preferentially (Figure 3a). Upon two-electron oxidation to [1OMe,SiPr]2+, the aryl π - π * transitions associated with both -OMe and -SiPr substituted phenoxyls are observed near 22000 and 16000 cm−1, respectively; the spectrum of [1OMe,SiPr]2+ is intermediate between those of [1SiPr2]2+ and [1OMe2]2+ (Figure 3b).
Figure 3.
(a) UV-Vis-NIR spectra of [1OMe2]+ (dashed line), [1SiPr2]+ (dotted line), and [1OMe,SiPr]+ (solid line). (b) UV-Vis-NIR spectra of [1OMe2]2+ (dashed line), [1SiPr2]2+ (dotted line), and [1OMe,SiPr]2+ (solid line)
One-electron oxidation of 1tBu,SiPr gives rise to a sulfur-aryl π - π * absorption near 16800 cm−1 (Figure 2); after a second oxidation to form [1tBu,SiPr]2+, the -tBu substituted phenoxyl contributes significant intensity to the UV phenoxyl absorption near 22900 cm−1 and a lesser amount to the feature near 16800 cm−1.
In complexes 2R1,R2, a lesser distinction exists in the two sequential phenolate oxidations, and the spectra of [2R1,R2]+ are generally intermediate between those of 2R1,R2 and [2R1,R2]2+ in the UV-Visible region. The spectra of the [2R1,R2]2+ dications do contain absorptions from both phenoxyl moieties: that of [2OMe,SiPr]2+ has both near-UV π - π * absorption of the -OMe substituted phenoxyl and the visible sulfur-aryl CT absorption of the -SiPr substituted phenoxyl (Figure 2).
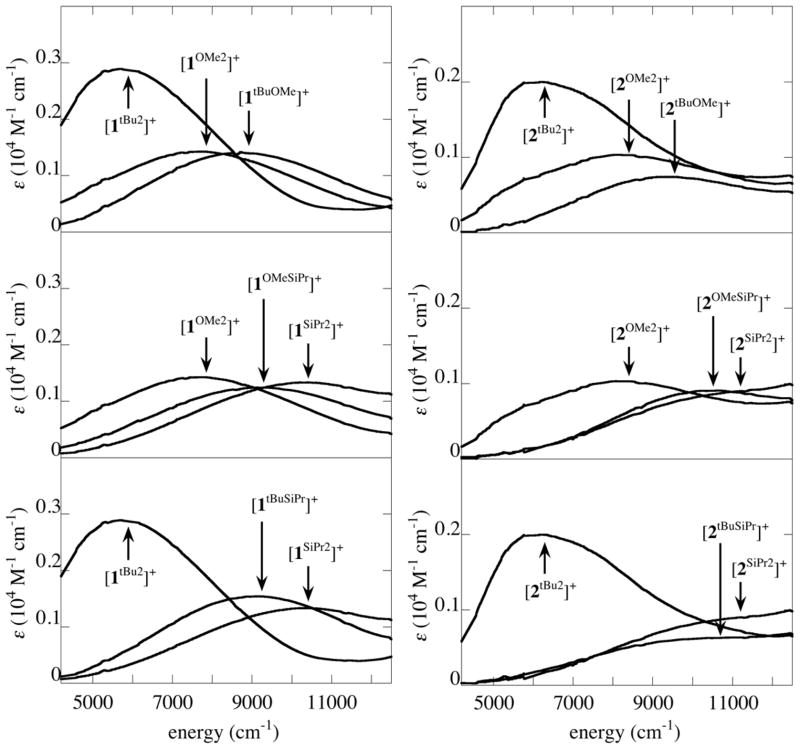
NIR absorption (5000–11000 cm−1) are observed for the monocations, [1R1,R2]+ and [2R1,R2]+, but not the neutral or two-electron oxidized forms. Due to the energy range and intensities of these absorptions (ε = 700–2000 M−1 cm−1) and their association with the mixed-valent monocations [1R1,R2]+ and [2R1,R2]+, these absorptions are assigned to phenolate-phenoxyl IVCT bands. Among the symmetrically substituted complexes, the maximum of the IVCT absorption increases in the order -OMe < -SiPr < -tBu, and the energies of the analogous 1R1,R2 and 2R1,R2 complexes are very similar. In contrast to the substituent-characteristic behavior seen for the UV and visible absorptions, the NIR absorptions of the oxidized non-symmetric complexes show no simple relationship to those of the symmetric precursors.
Most of the NIR absorptions of the [1R1,R2]+ and [2R1,R2]+ overlap with visible absorptions, so the UV-Vis-NIR spectra were fit with multiple Gaussians to obtain the energy (νmax), intensity (εmax), and half-width (Δν1/2) of the IVCT transitions (Figure 4, Table 2).45 Comparison of Δν1/2 to the bandwidth in the high temperature limit (ΔνHTL) predicted by equation 3 shows that Δν1/2 is greater than ΔνHTL in all cases, supporting their assignment as IVCT bands.28,46
Figure 4.
Comparison of NIR absorptions for symmetric and non-symmetric [1R1,R2]+ and [2R1,R2]+.
Table 2.
IVCT analysis for [1R1,R2]+ and [2R1,R2]+.
| complex | νmax (cm−1)a | ε (M−1cm−1)a | Δν1/2 (cm−1)a | ΔνHTL (cm−1)b | HAB (cm−1)c |
|---|---|---|---|---|---|
| [1tBu2]+ | 5700 | 2900 | 5600 | 3600 | 2300 |
| [1tBu,OMe]+ | 8700 | 1400 | 5300 | 4500 | 1900 |
| [1OMe2]+ | 7800 | 1400 | 6200 | 4200 | 2000 |
| [1OMe,SiPr]+ | 9300 | 1200 | 6300 | 4600 | 2000 |
| [1SiPr2]+ | 10200 | 1300 | 6200 | 4900 | 2200 |
| [1tBu,SiPr]+ | 9300 | 1600 | 5800 | 4600 | 2200 |
| [2tBu2]+ | 6300 | 2000 | 6200 | 3800 | 2100 |
| [2tBu,OMe]+ | 9600 | 700 | 5400 | 4700 | 1500 |
| [2OMe2]+ | 8300 | 1000 | 6200 | 4400 | 1700 |
| [2OMe,SiPr]+ | 10500 | 900 | 5600 | 4900 | 1800 |
| [2SiPr2]+ | 11200 | 900 | 6400 | 5100 | 2000 |
| [2tBu,SiPr]+ | 10600 | 600 | 6900 | 4900 | 1600 |
The electronic coupling coefficients, HAB, were evaluated using the band-shape parameters and equation 4. The oxygen-oxygen distance, rOO, is the approximate electron transfer distance and values from the crystal structures of [1tBu2]+ and [1OMe2]+ were used for [1R1,R2]+ and [2R1,R2]+ (ca. 2.7 Å).24,47 Comparison of HAB for all [1R1,R2]+ shows that the values cluster around 2100 ± 200 cm−1 despite the wide range of νmax (5700–10200 cm−1). Similarly, all [2R1,R2]+ complexes have HAB values centered around 1800 ± 200 cm−1. Previous work suggests that the actual electron transfer distance will vary slightly between the different complexes, but this is not expected to influence the HAB to a large extent (ca. ± 200 cm−1).9 The similarities of HAB for all [1R1,R2]+ or [2R1,R2]+ imply that the phenolate-phenoxyl coupling is similar for all the peripheral substituents.
6. EPR spectroscopy of phenoxyl complexes
X-band EPR spectra were obtained for 0.1 mM frozen (77 K) CH2Cl2 solutions of [1R1,R2]∘/+/2+ or [2R1,R2]∘/+/2+ (Figure S1). Despite the similarities of the EPR spectra of 1R1,R2 and 2R1,R2, significant substituent-dependent differences exist between the spectra of their one- and two-electron oxidized derivatives. Among one and two-electron oxidized species, [1OMe2]+ and [2OMe2]+ best follow the literature precedent as these copper(II)-phenoxyl complexes are EPR silent relative to the neutral forms. No half-field signals associated with a triplet species were observed for the one-electron oxidized complexes. In the former case, a large zero-field splitting parameter is thought to render the one-electron oxidized species EPR silent at X-band frequencies.24
[1OMe2]2+ uniquely possesses a broad EPR signal that closely resembles an S = 3/2 spectrum reported for a tacn-bridged copper(II)-bis(phenoxyl) complex (Figure S2).42 The other two-electron oxidized complexes show low intensity isotropic signals near g = 2.0, which could be attributed to S = 1/2 species. The spectrum of [1tBu,OMe]2+ most likely represents a copper-containing decay product, as this species is unstable at room temperature, at which it was prepared.
The EPR spectra for oxidized complexes bearing at least one -SiPr substituent have markedly different behavior. One-electon oxidation does not result in a loss of EPR intensity, rather, the signals broaden considerably and the spin integration remains relatively constant to that of their parent neutral forms. 1OMe,SiPr does show a reduction in intensity when oxidized, but oxidation is centered preferentially on the -OMe substituted phenolate in this case. Double oxidation of the -SiPr containing complexes reduces the intensity of their EPR signals, but spectra are still dominated in most cases by low intensity broad isotropic signals near g = 2.0.
7. Sulfur K-edge XAS
Sulfur K-edge XAS spectra of neutral and one-electron oxidized 1tBu,SMe display intense edge features near 2472 eV (Figure 5). The edge feature of [1tBu,SMe]+ occurs at higher energy in comparison to 1tBu,SMe, consistent with an increase in sulfur effective nuclear charge upon oxidation. 48 In addition, a new pre-edge feature is apparent in the spectra of [1tBu,SMe]+ at ca. 2471 eV. Analysis of the pre-edge feature using methods published previously yields sulfur contribution to the phenoxyl hole of 7% for [1tBu,SMe]+, consistent with preferential oxidation of the -SMe substituted phenolate, and an orientation of the -SMe group in-plane with the phenolate ring.9
Figure 5.
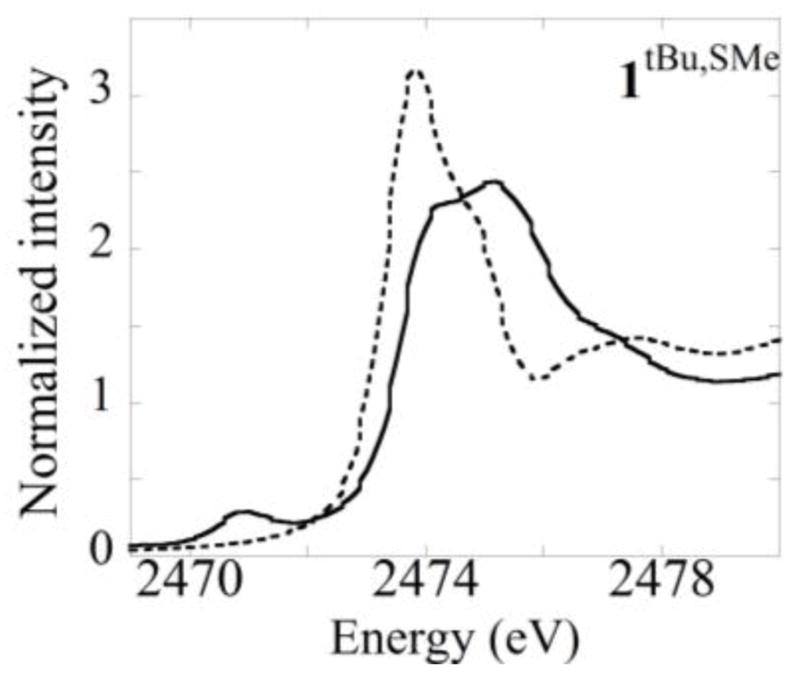
Normalized sulfur K-edge XAS spectra of (dotted) 1tBu,SMe and (solid) [1tBu,SMe]+.
Discussion
In this study of complexes 1R1R2 and 2R1R2 bearing dissimilar substituents on their periphery, the expected differentiation of the phenolate moieties is observed in both electrochemical and spectrophotometric experiments. Reversible oxidations of the phenolates are well-distinguished when an inherent thermodynamic difference exists between their redox potentials, and the sequential oxidations of the two phenolates induce characteristic absorptions associated with the methoxy substituent in the near-UV and with the sulfanyl substituent in the visible region. The para-substituents were not expected to disturb the spin distribution of the radical species generated by one- and two-electron oxidation, yet the EPR experiments suggest that a connection does exist that is particularly strong for the sulfanyl substituent, presumably due to the larger inter-spin distance afforded by significant delocalization of the hole onto the para-sulfur atoms, leading to weaker electron-electron coupling and more diradical EPR character.9,49
S K-edge XAS is a complementary technique to probe the sulfur contribution to the phenoxyl hole in [1tBu,SMe]+, the complex most structurally relevant to GOox. The edge feature at ca. 2474 eV observed for the neutral complex is consistent with other thioether compounds and a shift to higher energy for the one-electron oxidized species is consistent with an increase in sulfur Zeff. The presence of an additional pre-edge feature in the spectra of [1tBu,SMe]+ is attributed to a S1S to phenoxyl SUMO transition, the intensity of which reflects the degree of S p-orbital mixing into the SUMO.9,48 The degree of delocalization observed for [1tBu,SMe]+ (7%) is consistent with other spectroscopic and electrochemical results that indicate preferential oxidation of the -SMe bearing phenolate. This result is similar to that reported for the symmetric [1SMe2]+ (13%).9 It is curious that a halving of the number of sulfur atoms corresponds to an approximate halving of the S radical character as determined by XAS. Whether this corresponds to a true electronic effect or possible decay of [1tBu,SMe]+ has yet to be determined.
Comparison of the electrochemical potentials of the non-symmetric complexes to those of the symmetric congeners shows that sequential oxidation of the thermodynamically differentiated phenolates can be observed. For 1OMe2, 1tBu,OMe, and 1OMe,SiPr, the first oxidation potential corresponds to the oxidation of the -OMe substituted phenolate, as indicated by the growth of the 22000 cm−1 feature in the UV-Vis spectrum of the one-electron oxidized forms (Figure 2). The redox potential for the first oxidation of these complexes increases in the order 1OMe2< 1tBu,OMe<1OMe,SiPr, a trend that does not correspond directly to the electron-donating ability of the substituent on the un-oxidized phenolate (i.e. OMe > SiPr > tBu).
The mixed-valence, monocations [1R1,R2]+ and [2R1,R2]+ exist in equilibrium with a mixture of their respective neutral and dicationic forms:
The comproportionation constant Kc is determined at 298 K by log Kc = (ΔE/59 mV) (Table 1). ΔE values larger than a statistical value of 36 mV (Kc = 4)50,51 imply that a thermodynamic stabilization of the monocationic species exists. Based predominantly on results from bimetallic mixed-valence systems, the free energy of comproportionation (ΔGc = −nFΔE) can be separated into a statistical component (ΔGs = 36 mV = 290 cm−1), electrostatic repulsions (ΔGe), inductive effects (ΔGi), mixed-valence resonance stabilization (ΔGr), antiferro-magnetic exchange (ΔGex) and ion pairing (ΔGip):51,52 ΔGr, the resonance stabilization, is generally thought to dominate ΔGc.
| (1) |
In a symmetric Marcus-Hush model, if the two uncoupled states have minima at E = 0, the coupled ground state energy surface has a minimum at Emin = −HAB2/λ. This value corresponds to a per-molecule stabilization rendered by delocalization (ΔGr′ = Emin) and is therefore counted twice for the comproportionation since two mixed-valent molecules are formed per reaction (ΔGr = 2ΔGr′ = −2HAB2/λ).
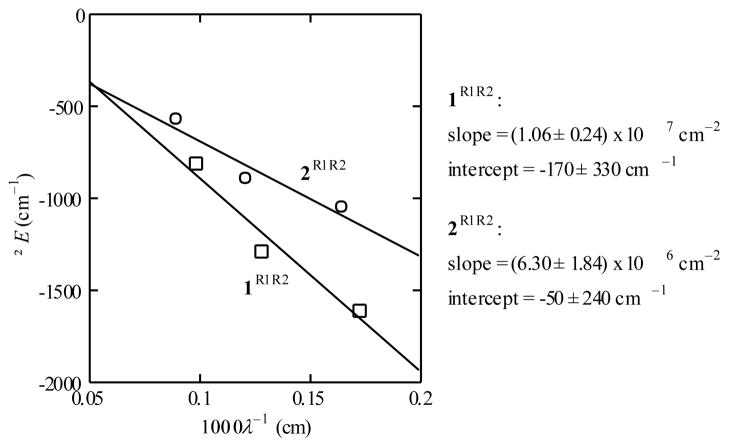
When ΔGc is plotted versus 1/λ(λ derived from NIR absorption bands) for symmetric 1R1,R2 and 2R1,R2 complexes (Figure 6), a linear correlation is indeed found. The slopes of linear fits of the data can be evaluated to give HAB = 2300 ± 300 cm−1 and 1800 ± 300 cm−1 for 1R1,R2 and 2R1,R2, respectively. Small values of the intercepts and small residuals support the assumptions that other ΔG factors are small and that ΔGc is dominated by ΔGr. Furthermore, the good correlation indicates that HAB is unchanged by peripheral substitution and independently confirms the magnitude of the coupling terms as determined by Hush analysis of the NIR transitions (Table 2).
Figure 6.
Plots of the electrochemical splitting (ΔE) versus 1/λ for 1R1,R2 (squares) and 2R1,R2 (circles), shown with linear fits.
For a symmetric two-redox center system, the two states that correspond to localization of the unpaired electron completely on one redox moiety or the other are modeled by harmonic functions representing molecular vibrations that map onto the electron transfer coordinate. These two diabatic states couple to form two adiabatic energy surfaces (Figure 7a): a ground state surface whose two minima represent a partial localization of charge on each redox center, and an excited state surface with a single minimum. The IVCT band corresponds to transition between the two adiabatic states, and νmax, εmax, and Δν1/2 of this transition are related to the reorganizational energy of the system (λ) subsequent to electron transfer and HAB. For IVCT transitions, the absorption bandwidth is expected to increase with νmax and ΔνHTL given by equation 3. Importantly HAB can be determined experimentally from the νmax, εmax, and Δν1/2 of the IVCT band and an estimate of the electron transfer distance rCT using the Hush equation (equation 4, Table 2).
Figure 7.
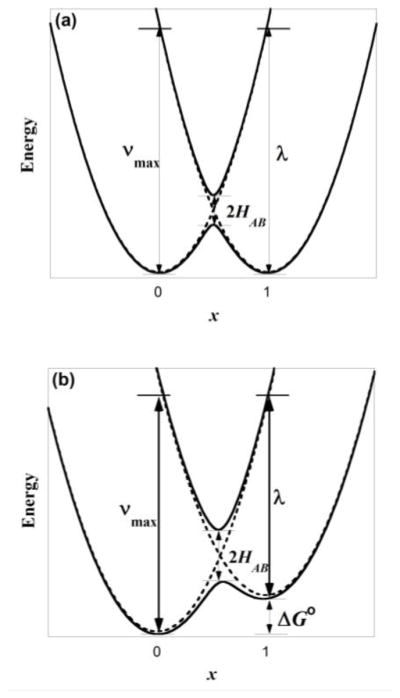
(a) Scheme of Marcus-Hush coupling in symmetric mixed-valence complexes. (b) Scheme of Marcus-Hush coupling in non-symmetric mixed-valence complexes. The energy of the IVCT absorption corresponds to λ + ΔG∘
| (2) |
| (3) |
| (4) |
To extend the Marcus-Hush model for complexes with non-symmetric phenolate moieties (i.e. 1R1,R2 and 2R1,R2), the secular equation that defines the ground and excited state surfaces is perturbed by the addition of ΔG∘, a term that represents the thermodynamic free energy difference between the two localized states (equation 2). For the non-symmetric model, the two minima of the ground state surface now lie at different energies (Figure 7b), with the unpaired electron preferentially localized on the ring with the lower binding energy. The energy of the IVCT absorption becomes the sum of the reorganizational energy λ and ΔG∘. Equations 3 and 4 for determining ΔνHTL and HAB are applicable for both the non-symmetric and symmetric models.
In non-symmetric, mixed-valence Ru dimers and bis(triarylamine) compounds, the approximation ΔE = ΔG∘ works reasonably well when applied to correlating the energies of their IVCT absorptions.53,54 However ΔE for the non-symmetric complexes [1R1,R2]+ and [2R1,R2]+ depends not only on the difference in potentials between the two phenolates (ΔG∘, estimable at 100–200 mV) but also on the splitting engendered by resonance stabilization (ΔGr, 70–200 mV). In the non-symmetric case, an expression for ΔGr will be dependent on ΔG∘. Rather than attempt a self-consistent solution for these two values, the redox potentials of the symmetric complexes should serve as references. The average of E1R and E2R (= EaveR) for symmetric 1R1,R2 and 2R1,R2 complexes (R1 = R2 = R) can be taken as an estimate of ER, the inherent redox potential of an R-substituted phenolate. The thermodynamic difference in a non-symmetric complex (R1 ≠ R2) is then ΔG∘ = EaveR1 − EaveR2.
The energy of an IVCT absorption of a non-symmetric compound “R1R2” is expected to be the sum of its reorganizational energy (λR1R2) and the separation of the ground state energies of the two charge-localized states (ΔG∘R1R2). If the reorganizational energies for self-exchange of complexes R1R1 and R2R2 are known, λR1R2 is estimated by the average of those energies ((λR1R1 + λR2R2)/2) in the classic Marcus cross-relation.55 Using the ΔG∘ expression derived above, the ultimate expression used to correlate the NIR transition energy of the non-symmetric (R1R2) mixed-valence complex to the properties of the corresponding symmetric (R1R1, R2R2) complexes is then:
| (5) |
As expected for a symmetric complex (R1 = R2 = R), this expression simplifies to νRR = λRR. The reorganizational energies (5000–10000 cm−1) are significantly larger than the differences in redox potentials (100 mV = 800 cm−1), so the λR1R2 term will tend to dominate overall. The necessary variables and results for the application of equation 5 to the six mixed-substituent complexes in this study are listed in Table 3. For [1R1,R2]+ (R1 ≠ R2), the agreement between νR1R2 and the experimental value of νmax is remarkably good, with an average difference of only 100 cm−1 for the three complexes. For [2OMe,SiPr]+, the difference between νAB and νmax is only 140 cm−1, but there are significantly larger discrepancies for [2tBu,OMe]+ and [2tBu,SiPr]+ of 600 cm−1 and 1000 cm−1, respectively. These discrepancies are comparable to the size of the |ER1 − ER2| term (Table 3), but would only be corrections to the much larger λR1R2 term; therefore, it seems more likely that there are effects on the reorganizational energy that are more subtle than anticipated.
Table 3.
Correlation of NIR transition energies of non-symmetric (R1 ≠ R2) to symmetric (R1 = R2) substituted mixed-valence complexes
| complex | λR1 (cm−1) | λR2 (cm−1) | |ER1 − ER2| (mV) | |ER1 − ER2| (cm−1) | νR1R2 (cm−1) | νmax (cm−1) |
|---|---|---|---|---|---|---|
| [1tBu,OMe]+ | 5700 | 7800 | 230 | 1850 | 8600 | 8700 |
| [1tBu,SiPr]+ | 5700 | 10200 | 165 | 1330 | 9280 | 9300 |
| [1OMe,SiPr]+ | 7800 | 10200 | 65 | 520 | 9520 | 9300 |
| [2tBu,OMe]+ | 6300 | 8300 | 210 | 1690 | 8990 | 9600 |
| [2tBu,SiPr]+ | 6300 | 11200 | 100 | 810 | 9560 | 10600 |
| [2OMe,SiPr]+ | 8300 | 11200 | 110 | 890 | 10640 | 10500 |
Given that equation 5 seems to deal with mixed-substituent complexes reasonably well, it is possible to apply it towards analysis of the IVCT band of GOox itself. The -SiPr substituted phenolates were originally intended to model the Tyr272-Cys228 conjugate and the -tBu substituted phenolates serve as models of unmodified axial Tyr495, therefore providing estimates of the reorganizational energies of the two tyrosines. The redox potential of tyrosine (i.e. Tyr495) is estimated at 1.0 V vs. NHE while the redox potential of modified Tyr272 is reported as 400 mV vs. NHE.56 The ~ 600 mV difference has been separated into contributions from the cysteine crosslink (ca. −230 mV), a π-stacking interaction with neighboring Trp290 (ca. −330 mV), and the presence of the axial tyrosine, Tyr495 (ca. −50 mV).57 Assuming a ΔG∘R1R2 term of ca. 600 mV ≈ 4800 cm−1, together with a λR1R2 term derived from λ for [2tBu2]+ and [2SiPr2]+ (8800 cm−1), predicts a νR1R2 of ca. 13600 cm−1 for GOox, well within the envelope of the broad Vis-NIR band of the enzyme. While this analysis is admittedly very approximate, it provides a first estimate from experimental data of the IVCT energy of GOox.
Conclusion
Non-symmetric substitution of a series of CuII-phenoxyl complexes results in striking differences in their redox and spectroscopic properties, providing insight into the influence of the cysteine-modified tyrosine cofactor in GO. A Marcus-Hush analysis of the oxidized copper complexes suggests they are best described as Class II mixed-valent. Sulfur K-edge XAS assesses the degree of radical delocalization onto the single sulfur atom of non-symmetric [1tBu,SMe]+, complementing other spectroscopic and electrochemical results that suggest preferential oxidation of the -SMe bearing phenolate. Estimates of the thermodynamic free-energy difference between the two localized states (ΔG∘) and reorganizational energies (λR1R2) of [1R1,R2]+ and [2R1,R2]+ leads to accurate predictions of the spectroscopically observed IVCT transition energies, and a predicted νmax of ~ 13600 cm−1 for GOox.
Supplementary Material
Acknowledgments
This work was supported by funding from the NIH (GM50730 to TDPS) and from CSU Chico (ECW). We thank Prof. E.I. Solomon for instrument use. We thank Dr. Pratik Verma for helpful discussions. Portions of this research were carried out at SSRL, a national user facility operated by Stanford University on behalf of the U.S. Department of Energy, Office of Basis Energy Sciences.
Footnotes
ASSOCIATED CONTENT
Supporting Information. EPR data.
References
- 1.Whittaker JW. Chem Rev. 2003;103:2347. doi: 10.1021/cr020425z. [DOI] [PubMed] [Google Scholar]
- 2.Rogers MS, Dooley DM. Curr Opin Chem Biol. 2003;7:189. doi: 10.1016/s1367-5931(03)00024-3. [DOI] [PubMed] [Google Scholar]
- 3.Firbank SJ, Rogers MS, Wilmot CM, Dooley DM, Halcrow MA, Knowles PF, McPherson MJ, Phillips SEV. Proc Natl Acad Sci. 2001;98:12932. doi: 10.1073/pnas.231463798. [DOI] [PMC free article] [PubMed] [Google Scholar]
- 4.Ito N, Phillips SEV, Yadav KDS, Knowles PF. J Mol Biol. 1994;238:794. doi: 10.1006/jmbi.1994.1335. [DOI] [PubMed] [Google Scholar]
- 5.Rogers MS, Tyler EM, Akyumani N, Kurtis CR, Spooner RK, Deacon SE, Tamber S, Firbank SJ, Mahmoud K, Knowles PF, Phillips SEV, McPherson MJ, Dooley DM. Biochemistry. 2007;46:4606. doi: 10.1021/bi062139d. [DOI] [PMC free article] [PubMed] [Google Scholar]
- 6.Rokhsana D, Dooley DM, Szilagyi RK. J Am Chem Soc. 2006;128:15550. doi: 10.1021/ja062702f. [DOI] [PubMed] [Google Scholar]
- 7.Rokhsana D, Dooley DM, Szilagyi RK. J Biol Inorg Chem. 2008;13:371. doi: 10.1007/s00775-007-0325-8. [DOI] [PubMed] [Google Scholar]
- 8.Lee YK, Whittaker MM, Whittaker JW. Biochemistry. 2008;47:6637. doi: 10.1021/bi800305d. [DOI] [PMC free article] [PubMed] [Google Scholar]
- 9.Verma P, Pratt R, Storr T, Wasinger EC, Stack TDP. Proc Natl Acad Sci. 2011 doi: 10.1073/pnas.1109931108. submitted. [DOI] [PMC free article] [PubMed] [Google Scholar]
- 10.Whittaker MM, Duncan WR, Whittaker JW. Inorg Chem. 1996;35:382. doi: 10.1021/ic951116c. [DOI] [PubMed] [Google Scholar]
- 11.Taki M, Kumei H, Nagatomo S, Kitagawa T, Itoh S, Fukuzumi S. Inorg Chim Acta. 2000;300:622. doi: 10.1021/ic9910211. [DOI] [PubMed] [Google Scholar]
- 12.Thomas F, Gellon G, Gautier-Luneau I, Saint-Aman E, Pierre JL. Angew Chem Int Ed. 2002;41:3047. doi: 10.1002/1521-3773(20020816)41:16<3047::AID-ANIE3047>3.0.CO;2-W. [DOI] [PubMed] [Google Scholar]
- 13.Campbell EJ, Nguyen ST. Tetrahedron Lett. 2001;42:1221. [Google Scholar]
- 14.Sawada Y, Matsumoto K, Katsuki T. Angew Chem Int Ed. 2007;46:4559. doi: 10.1002/anie.200700949. [DOI] [PubMed] [Google Scholar]
- 15.Berkessel A, Brandenburg M, Leitterstorf E, Frey J, Lex J, Schafer M. Adv Synth Catal. 2007;349:2385. [Google Scholar]
- 16.Matsumoto K, Sawada Y, Katsuki T. Pure Appl Chem. 2008;80:1071. [Google Scholar]
- 17.Kleij AW. Eur J Inorg Chem. 2009:193. [Google Scholar]
- 18.Wen YQ, Ren WM, Lu XB. Org Biomol Chem. 2011;9:6323. doi: 10.1039/c1ob05695f. [DOI] [PubMed] [Google Scholar]
- 19.Herrero C, Hughes JL, Quaranta A, Cox N, Rutherford AW, Leibl W, Aukauloo A. Chem Commun. 2010;46:7605. doi: 10.1039/c0cc01710h. [DOI] [PubMed] [Google Scholar]
- 20.Nakano K, Nakamura M, Nozaki K. Macromolecules. 2009;42:6972. [Google Scholar]
- 21.Kochem A, Orio M, Jarjayes O, Neese F, Thomas F. Chem Commun. 2010;46:6765. doi: 10.1039/c0cc01775b. [DOI] [PubMed] [Google Scholar]
- 22.Kurahashi T, Fujii H. J Am Chem Soc. 2011;133:8307. doi: 10.1021/ja2016813. [DOI] [PubMed] [Google Scholar]
- 23.Pratt R. Stanford University. 2004. [Google Scholar]
- 24.Orio M, Jarjayes O, Kanso H, Philouze C, Neese F, Thomas F. Angew Chem Int Ed. 2010;49:4989. doi: 10.1002/anie.201001040. [DOI] [PubMed] [Google Scholar]
- 25.Pratt RC, Stack TDP. J Am Chem Soc. 2003;125:8716. doi: 10.1021/ja035837j. [DOI] [PubMed] [Google Scholar]
- 26.Crutchley RJ. Adv Inorg Chem. 1994;41:273. [Google Scholar]
- 27.D’Alessandro DM, Keene FR. Chem Soc Rev. 2006;35:424. doi: 10.1039/b514590m. [DOI] [PubMed] [Google Scholar]
- 28.Brunschwig BS, Creutz C, Sutin N. Chem Soc Rev. 2002;31:168. doi: 10.1039/b008034i. [DOI] [PubMed] [Google Scholar]
- 29.Storr T, Verma P, Shimazaki Y, Wasinger EC, Stack TD. Chem Eur J. 2010;16:8980. doi: 10.1002/chem.201001401. [DOI] [PMC free article] [PubMed] [Google Scholar]
- 30.McGlashen ML, Eads DD, Spiro TG, Whittaker JW. J Phys Chem. 1995;99:4918. [Google Scholar]
- 31.Larrow JF, Jacobsen EN, Gao Y, Hong YP, Nie XY, Zepp CM. J Org Chem. 1994;59:1939. [Google Scholar]
- 32.George GN. Stanford, CA. 2000. [Google Scholar]
- 33.DeBeer S, Randall DW, Nersissian AM, Valentine JS, Hedman B, Hodgson KO, Solomon EI. J Phys Chem B. 2000;104:10814. [Google Scholar]
- 34.Sarangi R, George SD, Rudd DJ, Szilagyi RK, Ribas X, Rovira C, Almeida M, Hodgson KO, Hedman B, Solomon EI. J Am Chem Soc. 2007;129:2316. doi: 10.1021/ja0665949. [DOI] [PMC free article] [PubMed] [Google Scholar]
- 35.Böttcher A, Elias H, Jäger EG, Langfelderova H, Mazur M, Müller L, Paulus H, Pelikan P, Rudolph M, Valko M. Inorg Chem. 1993;32:4131. [Google Scholar]
- 36.Böttcher A, Elias H, Eisenmann B, Hilms E, Huber A, Kniep R, Rohr C, Zehnder M, Neuberger M, Springbord J. Z Naturforsch B. 1994;49:1089. [Google Scholar]
- 37.Lyons CT. [1R1,R2]+ exists in an equilibrium between a CuIII-phenolate and a ferromagnetic CuII-phenoxyl radical species at room temperature (RT) in solution, displaying the nearly iso-energetic nature of the two species [Google Scholar]
- 38.Hansch C, Leo A, Taft RW. Chem Rev. 1991;91:165. [Google Scholar]
- 39.Connelly NG, Geiger WE. Chem Rev. 1996;96:877. doi: 10.1021/cr940053x. [DOI] [PubMed] [Google Scholar]
- 40.Lee WK, Liu B, Park CW, Shine HJ, Guzman-Jimenez IY, Whitmire KH. J Org Chem. 1999;64:9206. doi: 10.1021/jo004042h. [DOI] [PubMed] [Google Scholar]
- 41.Halfen JA, Jazdzewski BA, Mahapatra S, Berreau LM, Wilkinson EC, Que L, Jr, Tolman WB. J Am Chem Soc. 1997;119:8217. [Google Scholar]
- 42.Bill E, Müller J, Weyhermüller T, Wieghardt K. Inorg Chem. 1999;38:5795. [Google Scholar]
- 43.Itoh S, Takayama S, Arakawa R, Furuta A, Komatsu M, Ishida A, Takamuku S, Fukuzumi S. Inorg Chem. 1997;36:1407. doi: 10.1021/ic961144a. [DOI] [PubMed] [Google Scholar]
- 44.Itoh S, Taki M, Kumei H, Takayama S, Nagatomo S, Kitagawa T, Sakurada N, Arakawa R, Fukuzumi S. Inorg Chem. 2000;39:3708. doi: 10.1021/ic9910211. [DOI] [PubMed] [Google Scholar]
- 45.Lyons CT. 2011 [Google Scholar]
- 46.Hush NS. Prog Inorg Chem. 1967;8:391. [Google Scholar]
- 47.Storr T, Verma P, Pratt RC, Wasinger EC, Shimazaki Y, Stack TDP. J Am Chem Soc. 2008;130:15448. doi: 10.1021/ja804339m. [DOI] [PMC free article] [PubMed] [Google Scholar]
- 48.Martin-Diaconescu V, Kennepohl P. J Am Chem Soc. 2007;129:3034. doi: 10.1021/ja0676760. [DOI] [PubMed] [Google Scholar]
- 49.Rajca A. Chem Rev. 1994;94:871. [Google Scholar]
- 50.Flanagan JB, Margel S, Bard AJ, Anson FC. J Am Chem Soc. 1978;100:4248. [Google Scholar]
- 51.Richardson DE, Taube H. Coord Chem Rev. 1984;60:107. [Google Scholar]
- 52.Al-Noaimi M, Yap GPA, Crutchley RJ. Inorg Chem. 2004;43:1770. doi: 10.1021/ic0349454. [DOI] [PubMed] [Google Scholar]
- 53.Chang JP, Fung EY, Curtis JC. Inorg Chem. 1986;25:4233. [Google Scholar]
- 54.Lambert C, Nöll G. Journal of the Chemical Society, Perkin Transactions. 2002;2:2039. [Google Scholar]
- 55.Marcus RA, Sutin N. Biochim Biophys Acta. 1985;811:265. [Google Scholar]
- 56.Stubbe J, van der Donk WA. Chem Rev. 1998;98:705. doi: 10.1021/cr980059c. [DOI] [PubMed] [Google Scholar]
- 57.Wright C, Sykes AG. J Inorg Biochem. 2001;85:237. doi: 10.1016/s0162-0134(01)00214-8. [DOI] [PubMed] [Google Scholar]
Associated Data
This section collects any data citations, data availability statements, or supplementary materials included in this article.


