Abstract
Purpose: To evaluate the geometric accuracy of beam targeting in external surrogate-based gated volumetric modulated arc therapy (VMAT) using kilovoltage (kV) x-ray images acquired during dose delivery.
Methods: Gated VMAT treatments were delivered using a Varian TrueBeam STx Linac for both physical phantoms and patients. Multiple gold fiducial markers were implanted near the target. The reference position was created for each implanted marker, representing its correct position at the gating threshold. The gating signal was generated from the RPM system. During the treatment, kV images were acquired immediately before MV beam-on at every breathing cycle, using the on-board imaging system. All implanted markers were detected and their 3D positions were estimated using in-house developed software. The positioning error of a marker is defined as the distance of the marker from its reference position for each frame of the images. The overall error of the system is defined as the average over all markers. For the phantom study, both sinusoidal motion (1D and 3D) and real human respiratory motion was simulated for the target and surrogate. In the baseline case, the two motions were synchronized for the first treatment fraction. To assess the effects of surrogate–target correlation on the geometric accuracy, a phase shift of 5% and 10% between the two motions was introduced. For the patient study, intrafraction kV images of five stereotactic body radiotherapy (SBRT) patients were acquired for one or two fractions.
Results: For the phantom study, a high geometric accuracy was achieved in the baseline case (average error: 0.8 mm in the superior–inferior or SI direction). However, the treatment delivery is prone to geometric errors if changes in the target–surrogate relation occur during the treatment: the average error was increased to 2.3 and 4.7 mm for the phase shift of 5% and 10%, respectively. Results obtained with real human respiratory curves show a similar trend. For a target with 3D motion, the technique is able to detect geometric errors in the left–right (LR) and anterior–posterior (AP) directions. For the patient study, the average intrafraction positioning errors are 0.8, 0.9, and 1.4 mm and 95th percentile errors are 1.7, 2.1, and 2.7 mm in the LR, AP, and SI directions, respectively.
Conclusions: The correlation between external surrogate and internal target motion is crucial to ensure the geometric accuracy of surrogate-based gating. Real-time guidance based on kV x-ray images overcomes the potential issues in surrogate-based gating and can achieve accurate beam targeting in gated VMAT.
Keywords: intrafraction, treatment verification, respiratory gating, gated VMAT, surrogate
INTRODUCTION
A major challenge in radiation therapy is the intrafraction motion of thoracic and abdominal tumors. Respiratory gating is an effective technique for managing tumor motion, by limiting the radiation exposure to certain parts of the breathing cycle.1, 2 The current standard clinical practice for respiratory gating is to establish a correlation model between the internal target motion and some external surrogate (e.g., skin surface, abdominal pressure, and tidal volume) and control the radiation beam solely based on the external surrogate signal. However, previous studies have shown that the relationship between the internal target motion and external surrogate signal can change on an interfractional and intrafractional basis.3 Therefore, it is important to make sure that the moving tumor stays inside the planning target volume (PTV) whenever the radiation beam is enabled during treatment delivery. This has become a crucial aspect of stereotactic body radiotherapy (SBRT), where even small geometric errors can cause large deviations in the delivered dose distributions.4, 5, 6
Previous studies have largely focused on pretreatment verification, using on-board imaging techniques such as kilovoltage (kV) radiograph and fluoroscopy, kV and MV cone-beam computed tomography (CBCT), 4D CBCT, etc.7, 8, 9, 10, 11 These procedures aim to adjust for the interfraction variations in the target motion. On the other hand, reports on intrafraction verification techniques, especially for gated treatment, have been rather limited. Along this line, Adamson and Wu12 recently assessed prostate intrafraction motion using kV fluoroscopy during IMRT treatment delivery. Studies on the use of electronic portal imaging device in cine mode or MV fluoroscopy for gated treatment delivery verification have also been reported.13, 14, 15 Although this technique utilizes free information (in the sense of no additional imaging dose), the inherently low contrast of cine MV images and possible blockage of anatomy or markers by the multileaf collimators during beam modulation may limit its broad applicability.16
In this study, we present a method to evaluate the geometric accuracy of gated volumetric modulated arc therapy (VMAT) treatment using intrafraction kV images. The recently developed TrueBeam system (Varian, Palo Alto, CA) is capable of external surrogate-based gated VMAT (RapidArc, Varian, Palo Alto, CA). Furthermore, kV images can be acquired at each and every breathing cycle during treatment delivery and the image acquisition can occur either immediately before MV beam-on or immediately after MV beam off. The number of kV images acquired thus equals to the number of breathing cycles in that treatment fraction. In this work, these triggered kV images were used to evaluate the intrafraction geometric accuracy of gated VMAT treatment using a physical respiratory phantom. In addition, we report some preliminary clinical results of intrafraction verification for gated VMAT treatments using the beam-level kV images.
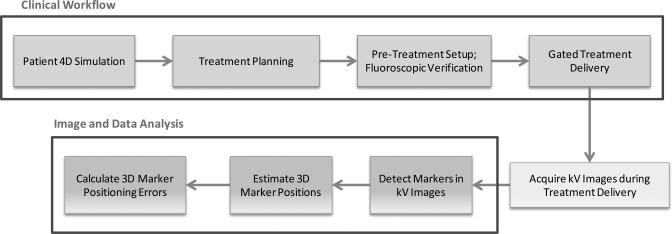
In Sec. 2, we first present details about the physical respiratory phantom, including its motion characteristics. Typical procedures for a gated VMAT treatment are discussed, including treatment simulation, planning, setup, and delivery. Methods for intrafraction verification through kV image acquisition, automatic marker detection, 3D tracking, and quantitative analysis will be discussed. A flowchart for the implementation of the proposed technique is shown in Fig. 1. In the end of Sec. 2, we briefly discuss the patient treatment which will be evaluated using the same technique. We present the results on both phantom experiments and patient study in Sec. 3. Finally, discussions and conclusion are presented in Secs. 4, 4.
Figure 1.
A flowchart for the implementation of the proposed technique.
METHODS AND MATERIALS
Phantom characteristics
The CIRS dynamic thorax phantom was used in this study. It provides known, accurate (±0.1 mm), and reproducible target motion inside a tissue equivalent phantom.17 The phantom body represents an average human thorax in shape, proportion, and composition. A lung equivalent rod containing a spherical target is inserted into the phantom. The phantom body is connected to a motion actuator that induces three-dimensional target motion through linear translation and rotation of the rod. In addition to the target motion stage, the lung phantom also includes a separate 1D motion stage for surrogate, which can be used to simulate patient’s surface motion. In this work, seven gold cylindrical-shaped fiducial markers (each with a dimension of 1 mm in diameter and 3 mm in length) were implanted inside the phantom for treatment setup and verification purposes.
Treatment simulation and planning
For treatment simulation, four-dimensional CT scans of the phantom were acquired in cine mode with an eight-slice GE LightSpeed™ CT scanner. During the 4D CT scan, the target moved in a regular sinusoidal fashion in the superior–inferior (SI) direction. The target motion has a peak-to-peak amplitude of 2 cm and a period of 4.5 s. To generate the necessary respiratory signal for 4D CT sorting, an RPM block was attached to the phantom’s surrogate platform, whose motion is the same as (and synchronized to) that of the target.
After simulation, ten phases of CT images were created from the 4D CT. The CT images at the end of exhale phase were used as the planning CT. The “gated” internal target volume (ITV) for the target as well as each marker was contoured, by expanding toward the inhale phase by 1 cm (e.g., half of the motion range). In contrast to a conventional motion inclusive ITV that is often constructed to encompass the full range of motion determined by 4D CT, the gated ITV is an allowance for residual motion within the respiratory gating window. In this case, the gating window allows a residual motion of 1 cm. An additional setup margin of 5 mm was added to form the final PTV. A point structure was created as a reference for each marker in the Eclipse™ treatment planning system. The virtual reference marker was placed at the corresponding marker position at the gating threshold and was used as the ground truth to evaluate the geometric accuracy of the treatment. Treatment plan was then optimized to deliver the prescription dose (200 cGy per fraction) to 95% of the PTV in one full arc.
Setup and verification prior to treatment
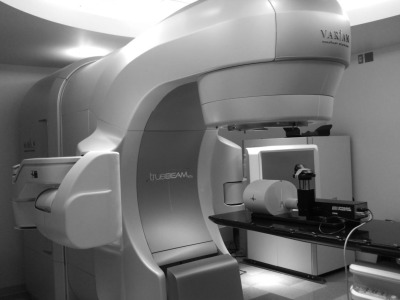
Prior to treatment, the lung phantom was first setup according to bony anatomy, by acquiring two orthogonal kV images. Figure 2 depicts the experimental setup, with the CIRS dynamic thorax phantom on the treatment couch. After the initial alignment, the amplitude of the gating window would be manually adjusted so that the MV beam-on occurs at the same time when the markers coincide with or move sufficiently close to the reference in orthogonal kV fluoroscopy. In practice, this is done by matching the positions of the marker center and the contoured marker center. This pretreatment verification procedure based on fluoroscopic images is intended to ensure that when the MV beam is enabled, the markers are as close as possible to their respective reference positions. For phantom experiment, this procedure usually takes around 1 min. During the pretreatment setup and verification, the target and surrogate motion is the same as (and synchronized to) that during treatment simulation.
Figure 2.
A picture showing the phantom experimental setup, with the CIRS lung phantom and motion stage on the treatment couch.
Treatment delivery and intrafraction kV image acquisition
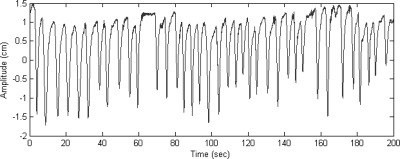
The gated VMAT treatment was delivered by a TrueBeam™ STx Linac. Similarly as in treatment simulation, an RPM block was attached to the phantom’s surrogate platform to generate the gating signal. The MV beam was controlled by the RPM system. In this study, we used amplitude-based gating for all treatments. In the first treatment fraction, we synchronized the motions of the target and surrogate and treat this as the baseline result. In order to assess the effects of the changes in the target–surrogate relation during treatment, we artificially introduced a phase shift of 5% and 10% of the entire breathing cycle between these two motions and used them throughout the treatments for the next two fractions. In addition, we simulated respiration with 3D motion for the target as well as real human respiratory curves shown in Fig. 3. The different motion characteristics during treatment delivery are summarized in Table TABLE I..
Figure 3.
The human respiratory curve used for the phantom study: the data were measured for a patient by the Varian RPM system.
TABLE I.
Motion characteristics of the target and surrogate during treatment delivery for the phantom study.
| Treatment fractiona | Motion type | Peak-to-peak amplitude (cm) | Period (s) | Phase shift between target and surrogate (%) |
|---|---|---|---|---|
| 1 | Sinusoidal | 2 (SI) | 4 | 0 |
| 2 | Sinusoidal | 2 (SI) | 4 | 5 |
| 3 | Sinusoidal | 2 (SI) | 4 | 10 |
| 4 | Sinusoidal | 0.6 (LR), 1 (AP), 2 (SI) | 4 | 0 |
| 5 | Patient | ∼2 (SI) | ∼5.3 | 0 |
| 6 | Patient | ∼2 (SI) | ∼5.3 | ∼11 (0.6 s) |
For treatment fractions 1–4, both target and surrogate motion is sinusoidal along the SI direction with a peak-to-peak amplitude of 2 cm for treatment setup; for treatment fractions 5 and 6, both target and surrogate motion follows the same patient respiratory curves (shown in Fig. 3) along the SI direction during treatment setup.
During the gated VMAT treatment, we acquired kV images immediately before MV beam-on at every respiratory cycle, using the on-board imaging (OBI) system. The OBI system consists of a 140 kV x-ray tube together with an aSi flat panel. The kV detector has an effective area of detection of ∼40 × 30 cm2. The kV source to imager distance was set to be 150 cm. The kV detector resolution is 1024 × 768, corresponding to a pixel size of ∼0.25 mm at the isocenter.
Verification of geometric accuracy
After the treatment, all the implanted markers were automatically detected in each kV image using in-house developed software. The marker detection was based on a hybrid intensity and geometry approach.18 Because the detected markers are in the 2D imager coordinate, their full 3D position in the patient coordinate system needs to be estimated. For this purpose, a recently proposed 3D Bayesian real-time tracking algorithm19 was adopted, which has been shown to achieve a submillimeter accuracy when tested on real (lung and pancreas) patient breathing traces.
Because the intrafraction kV images were acquired immediately before MV beam-on at every breathing cycle, they can be used to verify the geometric accuracy during gated treatment. This is achieved by comparing the marker position estimated from the kV images during delivery with the reference position defined in the planning CT. Since the MV beam should be on only when the marker is at its reference position, any discrepancy between the two may be characterized as a “gating miss” (except for uncertainties of the mechanical and imaging systems which are used to detect the markers in the patients). We calculated the distance from the marker to its reference position in the SI, left–right (LR), anterior–posterior (AP) direction as well as the 3D distance. The distance was defined as the marker positioning error in the corresponding direction. This procedure was repeated for each kV image acquired during dose delivery and the final results were obtained by averaging over all markers. The marker positioning errors were compared between the baseline treatment and that with a phase shift in target and surrogate motion.
Patient study
The above method was applied to evaluate the geometric accuracy of RPM-based gated VMAT treatments for a total of five patients (two pancreas patients, two liver patients, and one lung patient). The patients received SBRT in three to five fractions. Three to seven gold fiducial markers were implanted inside or near the tumor target before treatment simulation. Treatment planning, setup, and delivery for the patient are similar to those described in the phantom experiment. The pretreatment verification procedure based on fluoroscopic images usually takes around 1 min. Intrafraction kV images were acquired during one or two of the treatment fractions for the five patients. The marker positioning errors during treatment delivery were calculated similarly as in the phantom case.
RESULTS
Results for the phantom study
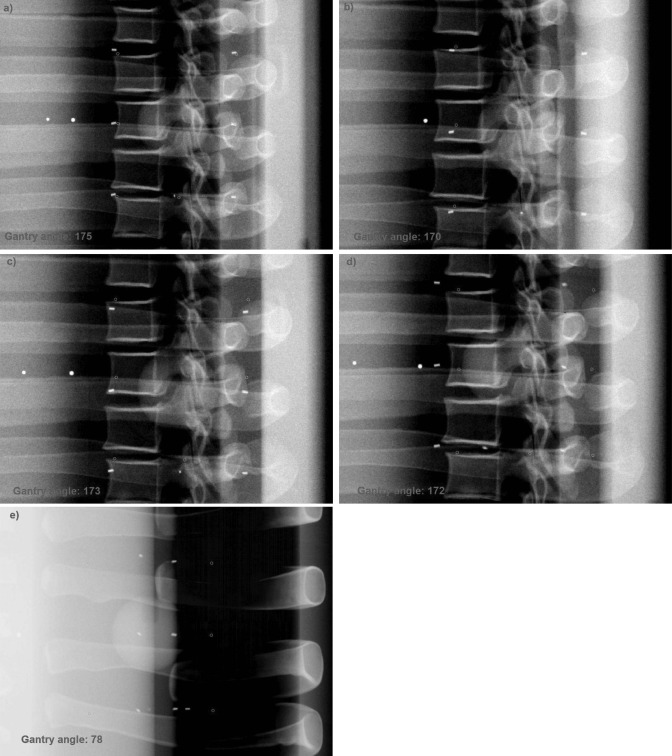
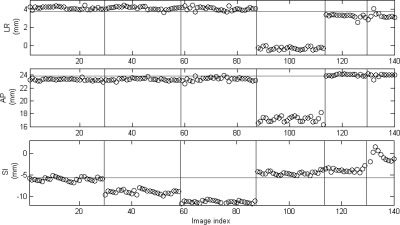
The total number of intrafraction kV images ranges from 11 to 29 in the six treatment fractions. Figure 4 shows one of the intrafraction kV images acquired during the gated VMAT treatments for the lung phantom. All seven fiducial markers are clearly visible in the kV image. Figure 5 shows the 3D position of one of the fiducial markers estimated from the intrafraction kV images and the corresponding reference position for the six fractions, i.e., SI sinusoidal motion with a 0%, 5%, and 10% phase shift between target and surrogate motion, 3D sinusoidal motion, real human respiratory curves with a 0% and ∼11% phase shift. Because the target motion was programmed to follow a regular sinusoidal function for the first three fractions, the marker position at the beginning of MV beam-on is quite stable within each fraction: the standard deviation is only 0.4, 0.5, and 0.3 mm (SI). In the baseline case, the mean marker position is very close (0.4 mm in SI) to the reference position, indicating that the gated treatment is geometrically accurate. However, when a phase shift between target and surrogate motion was introduced, there is clearly a discrepancy between the mean marker position and its reference position (3.3 and 5.6 mm in SI for 5% and 10% phase shift, respectively). A similar trend was observed for the results obtained with real human respiratory curves in treatment fractions 5 and 6, although the marker motion exhibits a great variability compared with the sinusoidal motion. Figure 5 clearly demonstrates that the proposed technique is able to detect geometric errors in the LR and AP directions in treatment fraction 4. These results suggest that in order to ensure the accuracy of RPM-based gating, a stable and robust correlation between target and external surrogate is a must. The positioning errors averaged over all the markers are summarized in Table TABLE II..
Figure 4.
One of the kV images acquired during the gated VMAT treatments for the phantom study: (a) 0% phase shift, (b) 5% phase shift, (c) 10% phase shift, (d) 3D motion—lateral view, and (e) 3D motion—AP view. All seven fiducial markers were present in the kV image and are clearly visible. The reference markers (shown as circles) are superimposed on the image using in-house software.
Figure 5.
3D position (circles) of one of the fiducial markers estimated from the kV images acquired during treatment for the phantom study. The horizontal lines indicate the reference position of the marker defined in planning CT. The vertical lines separate the six different treatment fractions as described in Table TABLE I..
TABLE II.
Mean and 95th percentile errors of the marker position for the phantom study. The target and surrogate motion characteristics for all six fractions are described in Table TABLE I..
| Mean (mm) | 95th percentile (mm) | |||||||
|---|---|---|---|---|---|---|---|---|
| Treatment fraction | LR | AP | SI | 3D | LR | AP | SI | 3D |
| 1 | 0.5 | 1.3 | 0.8 | 1.6 | 0.8 | 1.8 | 1.8 | 2.3 |
| 2 | 0.5 | 1.2 | 2.3 | 2.7 | 0.8 | 1.8 | 3.5 | 3.7 |
| 3 | 0.5 | 1.2 | 4.7 | 4.9 | 0.8 | 1.7 | 5.6 | 5.9 |
| 4 | 4.1 | 6.7 | 1.1 | 7.9 | 4.2 | 7.2 | 1.5 | 8.4 |
| 5 | 0.3 | 0.6 | 2.8 | 2.9 | 0.8 | 1.1 | 3.9 | 4.0 |
| 6 | 0.4 | 0.7 | 6.2 | 6.3 | 1.0 | 1.3 | 9.1 | 9.1 |
Results for the patient study
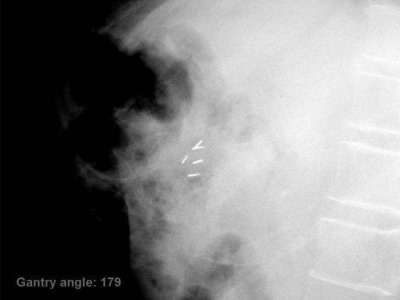
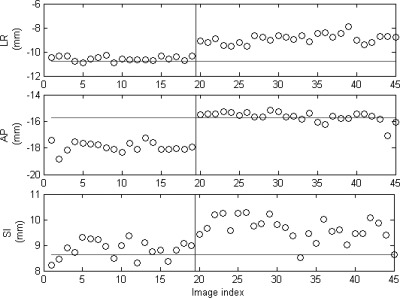
Depending on the specific breathing patterns of the patient, the total number of kV images acquired during treatment ranges from 14 to 40 for one fraction. Figure 6 shows one of the intrafraction kV images acquired during a gated VMAT treatment for the first pancreas patient. Figure 7 shows the 3D position of one of the fiducial markers estimated from the intrafraction kV images and the corresponding reference position for the same patient. Within the same fraction, there does not appear to be any distinct patterns of the marker position: the movement of the marker when the MV beam is enabled is quite random from one breathing cycle to the next. It is interesting to observe some interplay effects between interfraction and intrafraction variations. For instance, there was a 2.2 mm baseline shift in the AP direction for the first fraction and a 1.9 mm baseline shift in the LR direction for the second fraction. By comparing the marker positions and their reference with a t-test, both baseline shifts are found to be statistically significant (p < 0.0001). On the other hand, the baseline shift in the SI direction is not statistically significant for either fraction. The positioning errors in the SI direction mainly arise from intrafraction variations. Similar phenomenon was observed for other patients. The results averaged over all markers for the five patients are summarized in Table TABLE III..
Figure 6.
One of the kV images acquired during the gated VMAT treatments for the first pancreas patient. All five fiducial markers were present in the kV image and are clearly visible. The reference markers (shown as circles) are superimposed on the image using in-house software.
Figure 7.
3D position (circles) of one of the fiducial markers estimated from the kV images acquired during treatment for the pancreas patient. The horizontal lines indicate the reference position of the marker defined in planning CT. The vertical lines separate different treatment fractions.
TABLE III.
Mean and 95th percentile errors for the marker position for the patient study.
| Mean (mm) | 95th percentile (mm) | ||||||||
|---|---|---|---|---|---|---|---|---|---|
| Patient index | Site | LR | AP | SI | 3D | LR | AP | SI | 3D |
| 1 | Pancreas | 1.2 | 1.7 | 0.6 | 2.5 | 2.3 | 3.9 | 1.5 | 4.2 |
| 2 | Pancreas | 0.5 | 0.7 | 0.9 | 1.4 | 1.0 | 1.3 | 1.6 | 2.0 |
| 3 | Liver | 1.0 | 1.1 | 1.8 | 2.6 | 2.3 | 2.4 | 3.9 | 4.6 |
| 4 | Liver | 1.0 | 0.7 | 1.3 | 2.1 | 2.2 | 1.9 | 2.5 | 3.2 |
| 5 | Lung | 0.3 | 0.4 | 2.5 | 2.6 | 0.9 | 0.9 | 4.0 | 4.1 |
DISCUSSIONS
In this paper, we have presented a method to evaluate the geometric accuracy of gated VMAT using intrafraction kV images acquired at the beginning of beam-on at every breathing cycle during treatment. From the phantom experiments, it was found that if the relation between target and surrogate is stable throughout the treatment, the gated treatment is accurate (mean SI error: 0.8 mm); on the other hand, if the target–surrogate relation changes, e.g., if a 5% or 10% phase shift occurs during treatment, the mean intrafraction positioning error can be as large as 2.3 or 4.7 mm, as shown in the phantom study. Of note, these errors roughly agree with the theoretical predictions of 2.8 and 5.1 mm error for a 5% and 10% phase shift in a sinusoidal function (evaluated at the gating threshold). Results obtained using real human respiratory curves show a similar trend. The positioning errors along the LR and AP directions are small for the first three fractions, with a 95th percentile error of <2 mm. The technique detects LR and AP positioning errors if target motion is present along these directions during treatment. Changes in breathing period itself do not seem to influence the gating errors. Although not reported in the manuscript, treatments with the same period as in simulation have very similar results as shown in the current study. For the phantom experiment, we have used a 1-cm gating window for the 2-cm sinusoidal motion, leading to a 50% duty cycle for gating. If a smaller gating window (e.g., 0.5 cm) is used, the same general trends still hold, i.e., larger phase shift leads to larger positioning errors. However, the errors would be slightly smaller compared with the 1-cm gating window, because the target moves at a smaller speed around the gating threshold for a 0.5-cm gating window.
In addition to the phantom experiments, we demonstrated the clinical feasibility of intrafraction verification of gated VMAT and reported some preliminary results for patient treatments. Overall, the average intrafraction positioning errors over five patients are 0.8, 0.9, and 1.4 mm (95th percentile: 1.7, 2.1, and 2.7 mm) in the LR, AP, and SI directions, respectively. The positioning errors are generally small compared with the additional 5 mm margin added to form the final PTV, indicating there were no geometric misses in this group of patients using pretreatment fluoroscopic verification of the gating thresholds. The technique can be a useful clinical tool for intrafraction verification of gated VMAT. We have observed in our patient study that a 2–3 mm adjustment of the gating threshold is usually needed during the pretreatment fluoroscopic verification. Our study clearly demonstrates the potential of geometric misses in surrogate-based gating if such pretreatment image guidance is not used at each treatment fraction. From this small patient study, it is observed that for lung and liver patients, the errors in the SI direction appear to be the dominant factor, although not apparently so for the liver patients. For the pancreas patients, the errors in the AP and LR may play an important role: for instance, the AP error is the largest among those in all three directions for the first pancreas patient. These results reflect the specific anatomy and organ motion in these disease sites.
The marker positioning errors reported in this study incorporate uncertainties due to various sources, including but not limited to, hardware (e.g., the mechanical and x-ray imaging systems) and software (e.g., marker detection and 3D tracking). According to the vendor specification and our recent end-to-end test of the system, the TrueBeam Linac has a submillimeter mechanical and imaging accuracy. The marker detection and 3D tracking algorithms have also been demonstrated to have a submillimeter accuracy.18, 19 These uncertainties are generally smaller than the positioning errors found in this study. The apparent positioning errors also include uncertainties due to contouring of fiducial markers and placement of reference markers in the planning CT, which is limited by the axial slice thickness (1.25 mm in this study). The finite temporal resolution of kV imaging is also a factor here. For the patient study, each kV image has an exposure time (or pulse length) of 50 ms. Since most tumors move at a speed of less than 2 cm/s, the uncertainty of the target localization due to finite imaging time should be <1 mm. If a higher precision is desired, an imaging protocol with smaller exposure time and larger tube current may be used without compromising image quality.
Since multiple implanted fiducial markers were used in this study, there may be some variability in apparent positioning errors between different markers. For instance, in Fig. 4a, the top left marker appears to be a little further away from its reference position in the SI direction, while other markers are closer to their respective reference These uncertainties also enter into the apparent positioning errors. As an initial investigation into this issue, we calculated the intermarker distance for each marker, defined as the pair-wise difference in positioning error averaged over all images. If the fiducial markers are implanted into a rigid body and only translational motion is present, then the intermarker distance is zero. This is a reasonable assumption for the lung phantom, with an intermarker distance of 0.7 ± 0.3 mm (range: 0.5–1.1 mm) along the motion (SI) direction. For the pancreas patient, the intermarker distance is larger: 2.1 ± 0.8 mm (range: 1.5–3.1 mm) in the AP direction, which partially explains the large errors along this direction. The presence of intermarker distance indicates either rotational or deformational changes in the target, or simply marker migration during the treatment course. Due to the small patient size in this preliminary study, the uncertainties due to marker migration and/or intermarker variations are not systematically studied. However, these factors could affect the clinical decision for setup and verification purposes and thus deserve further investigation.
The impact of the geometric errors may vary depending on the directions at which the kV image is acquired. Since the MV treatment beam is (almost) always perpendicular to the SI direction, the errors in the SI direction at any time or gantry angle could contribute to measureable dosimetric errors in the delivery process. On the other hand, the dose distributions may be more tolerant to in-line (with MV beam) positioning errors, i.e., a combination of errors along the AP and LR directions, depending on the specific gantry angle. However, this only applies to occasional and random errors. If there are persistent and systematic positioning errors along AP or LR directions, the resultant dosimetric errors would have a similar magnitude with that caused by SI positioning errors.
The proposed technique has potential real-time applications in the clinic. After a kV image has been acquired by the on-board imaging system, our technique entails two main tasks: marker detection and 3D position estimation. The method has been implemented on the MATLAB platform running on a PC with a 2.80 GHz CPU and 4 GB RAM. The marker detection and the 3D position estimation takes about 30 and 55 ms per projection image, respectively, leading to a total of 85 ms of processing time for each kV projection image. It is expected that when implemented on a low-level language such as C, and especially on a multicore platform, the computational time will be dramatically reduced.
CONCLUSION
We have presented a method to evaluate the geometric accuracy of beam targeting in external surrogate-based gated VMAT. It was found that the correlation between external surrogate and internal target motion is crucial for the geometric accuracy of surrogate-based gating. Real-time guidance based on kV x-ray images overcomes the potential issues in surrogate-based gating and can achieve accurate beam targeting in gated VMAT.
ACKNOWLEDGMENTS
This work was supported by the National Cancer Institute (1R21 CA153587 and 1R01 CA133474) and National Science Foundation (0854492). The authors would like to thank Dr. Lei Wang for helpful discussions on the phantom experiments and assistance in 4D CT acquisition.
References
- Shirato H. et al. , “Physical aspects of a real-time tumor-tracking system for gated radiotherapy,” Int. J. Radiat. Oncol., Biol., Phys. 48(4), 1187–1195 (2000). 10.1016/S0360-3016(00)00748-3 [DOI] [PubMed] [Google Scholar]
- Xing L. et al. , “Overview of image-guided radiation therapy,” Med. Dosim. 31(2), 91–112 (2006). 10.1016/j.meddos.2005.12.004 [DOI] [PubMed] [Google Scholar]
- Ozhasoglu C., and Murphy M. J., “Issues in respiratory motion compensation during external-beam radiotherapy,” Int. J. Radiat. Oncol., Biol., Phys. 52(5), 1389–1399 (2002). 10.1016/S0360-3016(01)02789-4 [DOI] [PubMed] [Google Scholar]
- Dawson L. A. et al. , “Accuracy of daily image guidance for hypofractionated liver radiotherapy with active breathing control,” Int. J. Radiat. Oncol., Biol., Phys. 62(4), 1247–1252 (2005). 10.1016/j.ijrobp.2005.03.072 [DOI] [PubMed] [Google Scholar]
- Mendez Romero A. et al. , “Stereotactic body radiation therapy for liver tumors: Impact of daily setup corrections and day-to-day anatomic variations on dose in target and organs at risk,” Int. J. Radiat. Oncol., Biol., Phys. 75(4), 1201–1208 (2009). 10.1016/j.ijrobp.2008.12.020 [DOI] [PubMed] [Google Scholar]
- Timmerman R. D. et al. , “Stereotactic body radiation therapy in multiple organ sites,” J. Clin. Oncol. 25(8), 947–952 (2007). 10.1200/JCO.2006.09.7469 [DOI] [PubMed] [Google Scholar]
- Wang Z. et al. , “Refinement of treatment setup and target localization accuracy using three-dimensional cone-beam computed tomography for stereotactic body radiotherapy,” Int. J. Radiat. Oncol., Biol., Phys. 73(2), 571–577 (2009). 10.1016/j.ijrobp.2008.09.040 [DOI] [PubMed] [Google Scholar]
- Pouliot J. et al. , “Low-dose megavoltage cone-beam CT for radiation therapy,” Int. J. Radiat. Oncol., Biol., Phys. 61, 552–560 (2005). 10.1016/j.ijrobp.2004.10.011 [DOI] [PubMed] [Google Scholar]
- Sonke J. J. et al. , “Respiratory correlated cone beam CT,” Med. Phys. 32(4), 1176–1186 (2005). 10.1118/1.1869074 [DOI] [PubMed] [Google Scholar]
- Li T. et al. , “Four-dimensional cone-beam computed tomography using an on-board imager,” Med. Phys. 33(10), 3825–3833 (2006). 10.1118/1.2349692 [DOI] [PubMed] [Google Scholar]
- Jayachandran P. et al. , “Interfractional uncertainty in the treatment of pancreatic cancer with radiation,” Int. J. Radiat. Oncol., Biol., Phys. 76(2), 603–607 (2010). 10.1016/j.ijrobp.2009.06.029 [DOI] [PubMed] [Google Scholar]
- Adamson J. and Wu Q., “Prostate intrafraction motion assessed by simultaneous kilovoltage fluoroscopy at megavoltage delivery I: Clinical observations and pattern analysis,” Int. J. Radiat. Oncol., Biol., Phys. 78(5), 1563–1570 (2010). 10.1016/j.ijrobp.2009.09.027 [DOI] [PMC free article] [PubMed] [Google Scholar]
- Berbeco R. I. et al. , “Clinical feasibility of using an EPID in CINE mode for image-guided verification of stereotactic body radiotherapy,” Int. J. Radiat. Oncol., Biol., Phys. 69(1), 258–266 (2007). 10.1016/j.ijrobp.2007.04.051 [DOI] [PubMed] [Google Scholar]
- Tai A. et al. , “Gated treatment delivery verification with on-line megavoltage fluoroscopy,” Int. J. Radiat. Oncol., Biol., Phys. 76(5), 1592–1598 (2010). 10.1016/j.ijrobp.2009.08.005 [DOI] [PubMed] [Google Scholar]
- Liu W., Luxton G., and Xing L., “A failure detection strategy for intrafraction prostate motion monitoring with on-board imagers for fixed-gantry IMRT,” Int. J. Radiat. Oncol., Biol., Phys. 78(3), 904–911 (2010). 10.1016/j.ijrobp.2009.12.068 [DOI] [PubMed] [Google Scholar]
- Ma Y. et al. , “Four-dimensional inverse treatment planning with inclusion of implanted fiducials in IMRT segmented fields,” Med. Phys. 36, 2215–2221 (2009). 10.1118/1.3121425 [DOI] [PMC free article] [PubMed] [Google Scholar]
- http://www.cirsinc.com/products/modality/18/dynamic-thorax-phantom/.
- Mao W. et al. , “A fiducial detection algorithm for real-time image guided IMRT based on simultaneous MV and kV imaging,” Med. Phys. 35(8), 3554–3564 (2008). 10.1118/1.2953563 [DOI] [PMC free article] [PubMed] [Google Scholar]
- Li R., Fahimian B., and Xing L., “A Bayesian approach to real-time 3D tumor localization via monoscopic x-ray imaging during treatment delivery,” Med. Phys. 38(7), 4205–4214 (2011). 10.1118/1.3598435 [DOI] [PMC free article] [PubMed] [Google Scholar]


