

Abstract
Because proteins are the major functional components of cells, knowledge of their cellular localization is crucial to gaining an understanding of the biology of multicellular organisms. We have generated a protein expression map of the Arabidopsis root providing the identity and cell type-specific localization of nearly 2,000 proteins. Grouping proteins into functional categories revealed unique cellular functions and identified cell type-specific biomarkers. Cellular colocalization provided support for numerous protein–protein interactions. With a binary comparison, we found that RNA and protein expression profiles are weakly correlated. We then performed peak integration at cell type-specific resolution and found an improved correlation with transcriptome data using continuous values. We performed GeLC-MS/MS (in-gel tryptic digestion followed by liquid chromatography-tandem mass spectrometry) proteomic experiments on mutants with ectopic and no root hairs, providing complementary proteomic data. Finally, among our root hair-specific proteins we identified two unique regulators of root hair development.
Keywords: plant proteome, cell-type expression, FACS, RNA-protein correlation, root hair mutant
Multicellular organisms use specialized cell types to perform activities that are integral to their function. Cellular tasks are usually achieved by proteins, which act in signaling cascades, provide structural support, and catalyze enzymatic reactions vital to growth and metabolism. Knowledge of protein cellular localization and abundance using proteomic approaches is thus crucial to our understanding of biological systems (1, 2). Proteome data can be visually represented in a map, which highlights the spatial relationships of proteins at the level of cell type, tissue, or organ. Proteome maps are useful representations of the complex “building plan” of a biological system and also serve as valuable tools for the discovery of new cellular functions (2, 3). Proteomic studies of single cell populations isolated from a variety of multicellular organisms have recently been achieved, including the oocytes of worms and mice (4–6); pollen grains (consisting of two sperm and one vegetative cell) and stomatal guard cells of plants (7, 8); and sperm cells of mice and flies (9, 10). These cell types were relatively accessible because they either reside on the surface and can be purified in large quantities using biochemical fractionation (e.g., guard cells) or are large and can easily be collected (e.g., Caenorhabditis elegans oocytes). However, similar proteomic studies of internal cell populations have been more difficult and are usually only partially represented in proteomes of whole organs owing to signal dilution (e.g., refs. 11–16).
The Arabidopsis thaliana root is an excellent model for investigating cellular functions internal to an organ because it is transparent, radially symmetric, and cell types can be isolated by FACS to allow molecular profiling (17). The goal of this study was to investigate cell-type function by generating a proteomic map of the Arabidopsis root, at cell-type resolution. We performed FACS followed by GeLC-MS/MS (in-gel tryptic digestion followed by liquid chromatography-tandem mass spectrometry) proteomic analysis to identify the proteins in individual root cell types. The resulting proteome map of cell types revealed cellular functions and many proteins that are absent in the whole root proteome (11), supporting the importance of our cellular-level approach. We also compared our cellular proteome map with the RNA expression map of the same cell types (18) and found positive but low correlations between protein and RNA profiles. We observed improved correlations when we used a quantitative label-free proteomic approach, more specifically peak integration, of the same cell populations. This proteome map of the cell types of an organ highlights the potential of cell-type proteomics to provide new hypotheses about cellular functions and useful biomarkers. Focusing on root hairs, we performed GeLC-MS/MS proteomics on mutants with either ectopic or no hairs. We tested the hypothesis that cell type-specific proteins are involved in cell identity and identified two unique developmental modulators of root hairs.
Results and Discussion
Root Cellular Proteome Reveals Cellular Functions and Spatial Patterns.
To build an organ proteomic map at cell-type resolution, we isolated by FACS 1 × 10⁶ root cells from each of six different Arabidopsis GFP-marked cell populations that roughly cover the Arabidopsis root cell types (Fig. 1 A and B). To identify as many proteins as possible, we performed a total of 435 MS runs from these cell-type samples in a GeLC-MS/MS proteomic approach (SI Appendix, Fig. S1). We identified 1,995 unique proteins at a false-discovery rate (FDR) of 3% requiring that two unique, high-confidence peptides (PeptideProphet ≥90% confidence interval) match each protein (SI Appendix, Tables S1 and S2). As expected, our root cellular proteome data constitute a small portion (<10%) of the Arabidopsis proteome; however, this protein representation in single cell populations was sufficiently high to warrant further study.
Fig. 1.

The Arabidopsis root cellular proteome. (A) Confocal images of cell populations covering the major cell types of the Arabidopsis root. Upper (left to right): External cell populations of the root: root hairs, nonhair epidermis, and columella marked by the GFP reporters COBL9, WER, and PET111, respectively. Lower (left to right): Internal cell populations of the root: cortex, endodermis-quiescent center, and vasculature marked by the GFP reporters CORTEX, SCR, and WOL, respectively. (B) Schematic depicting the cellular coverage of the Arabidopsis root profiled by FACS and proteomics. Orange, pink, light yellow, blue, and purple denote the epidermal, cortex, endodermal-quiescent center, vascular, and columella cells, respectively, covered by the markers in A. (C) Distribution of the number of cell types in which proteins were identified. (D) Distribution of the proteins identified in a single cell type. (E) Cell-type functions uncovered by GO analyses. The heat map depicts GO term enrichment in individual cell types; yellow indicates enrichment (P < 10−3).
We first examined how cellular localization differed between root cell types in our proteome map. Although 13% of the proteins were found in all cell types, more than 35% of the proteins were identified in a single root cell population. Only 2% of the proteins we identified were previously reported as root organ biomarkers (Fig. 1 C and D and SI Appendix, Tables S3 and S4) (11). These results provided the initial evidence that isolating individual cell types from an organ can lead to insights into tissue-specific protein expression. Several proteins found in a single cell type have been validated to be localized and/or function in that cell type (SI Appendix, Table S5). For example, mutants in COBRA-LIKE9 (COBL9) and VARICOSE have characterized developmental defects in root hairs and vasculature, respectively (SI Appendix, Table S5). Similarly, we detected the PINFORMED (PIN) membrane proteins that facilitate the transport of the plant growth regulator auxin (19) in cells corresponding to their reported localization (SI Appendix, Fig. S3 and Table S5). To reveal cell-type functions, we next examined Gene Ontology (GO) term enrichment, focusing on proteins identified in a single cell type (Fig. 1E and SI Appendix, Table S7). For example, “auxin polar transport” and “tropism” were enriched in vascular and columella cells, respectively, consistent with the reported function of these cell types (Fig. 1E) (20–25). We also found the cellular function “nutrient reservoir activity” specifically in vascular cells (Fig. 1E). We hypothesize that mobilization of storage proteins to fuel vascular-specific development occurs in a different spatiotemporal manner than in other cell types; intriguingly, this has recently been reported in tobacco (26). Together, these examples suggest that proteomic profiling at cell-type resolution provides insights into cellular functions.
We also examined the spatial distribution patterns of the proteins we identified. There are 64 possible nonredundant combinations of protein presence or absence across cell types, and we probed these clusters for cellular functions by GO analyses (SI Appendix, Figs. S4 and S5). One cluster (cluster 1, SI Appendix, Fig. S4) has proteins found in both root hairs and columella cells. GO enrichment for toxin and starch catabolism in this cluster might reflect the external, differentiated nature and function of these cells. Other clusters suggest that differential subunit localization is important for cellular function. For instance, subunits of the Tailless Complex Polypeptide 1 (TCP1) complex implicated in cell-cycle progression and unfolded protein response are found in complementary cell types, which suggests that protein movement or cell type-specific proteins are important for Tailless Complex function (SI Appendix, Fig. S3; clusters 28, 29, and 42, SI Appendix, Figs. S4 and S5) (27–29). We conclude that the Arabidopsis root cellular proteome captures the complexity of the root at the cellular level, facilitating mechanistic understanding of cellular processes underlying root organ development and function.
Data Integration Uncovers Metabolic Processes, Support for Interactome Data, and Correlations of Protein and RNA Profiles.
Metabolic pathways in plants are well characterized from genetic and physiological experiments. To place our results in a functional context, we examined the overlap of our root cellular proteome and the Arabidopsis Plant Metabolic Network (30, 31). We found that 25% of the proteins we identified are enzymes in metabolic pathways, with some localized to single cell types (Fig. 2A and SI Appendix, Table S8). For example, flavonoid biosynthetic enzymes were found predominantly in the cortex, and the GO term “UV response” was found in the cortex (Figs. 2A and 1E, respectively). Flavonoids are beneficial to human nutrition and play various roles including UV protection in plants (32), which suggests the possibility that flavonoid biosynthesis in the cortex is important for UV protection of light-grown roots. Alternatively, flavonoids were recently shown to regulate the localization of PIN proteins, which are required in the cortex during gravitropic responses of the root (31, 32). In another example, we detected peroxidases in specific cell types, suggesting that regulation of cellular redox homeostasis occurs at the level of individual cell types (Fig. 2B). These examples suggest that certain enzymatic processes are enriched in individual root cell types, likely reflecting the specific cellular tasks of different cell types.
Fig. 2.

Data integration with metabolic pathway and transcriptome data and quantification of the root cellular proteome. (A) Flavonoid biosynthetic enzymes found in the cortex. (B) Peroxidases found in specific cell populations. Blue, pink, and yellow indicate localization in one, two, or three or more cell types, respectively. (C) Comparison of the root cellular proteome and transcriptome. The PCC between the RNA and GeLC-MS/MS or peak-integration protein profiles, respectively, are shown for each cell type. (D) RNAs with longer CDS are more highly correlated with GeLC-MS/MS protein profiles. The PCC of short (top row) or long (bottom row) CDS, respectively, are given for each cell type. (E) The protein intensities (sum of eight peptides) for the protein encoded by At5g60520 from peak-integration proteomic data are an example showing significant enrichment in a single cell type, the columella. Error bars indicate the SD of three technical replicates of each cell type.
Protein–protein interaction (PPI) maps are being generated in various organisms, including Arabidopsis (33). Of the 4,896 unique protein interactors annotated in The Arabidopsis Information Resource (TAIR) and BioGRID databases, 641 were found in the root cellular proteome (SI Appendix, Table S9). We reasoned that if both interactors were found in the same cell type this would provide support for the in vivo cellular function of these PPIs. To test this, we examined the localization of 113 PPI pairs for which both proteins were in our root cellular proteome (SI Appendix, Table S9). We found 90% of interacting proteins were colocalized in at least one root cell type. This finding was significant over proteome data of randomized protein pairs (P = 0.069), but not strongly. This is perhaps not surprising given the low number of interactions currently reported. Intriguingly, some identical localization patterns were found for interacting proteins pairs. For instance, P-glycoprotein1 and PIN1 were found only in vascular cells, and the interaction of these proteins has been functionally demonstrated to mediate auxin transport in HeLa and yeast cells (34). We conclude that our data support the colocalization and thus in vivo relevance of some Arabidopsis PPIs.
Available transcriptome data of the same cell types as profiled in our root cellular proteome afforded a unique opportunity to assess the relationship between RNA and protein expression profiles. To do this, we compared our root cellular proteome with transcriptomic data of the same cell types (18) by computing the Pearson correlation coefficient (PCC). We first converted the mRNA expression data to binary, presence/absence calls and then compared the presence or absence of mRNA and protein for the different cell types. We found low PCCs for each cell type (0.19–0.36; Fig. 2C), in agreement with other studies reporting low, positive correlations between RNA and protein profiles (35–39). We were also interested in the correlations between RNA and protein profiles of specific features: short vs. long 5′ UTRs, coding sequences (CDS), and 3′ UTRs in our data. We found higher correlations for RNAs with long vs. short CDS for all cell types, and this was consistent over a range of cutoffs (Fig. 2D and SI Appendix, Table S10). A small possibility exists that these data support a previously reported suggestion that RNA expression is less variable and often tissue specific for long CDS (40–42), which might lead to more consistent protein expression. However, a more likely explanation for our results is that low-molecular-weight proteins are sampled less frequently in GeLC-MS/MS experiments (43), and these proteins thus seem to be poorly correlated with transcript levels in our binary comparisons.
To determine the correlation using continuous values for protein abundance acquired by an alternative proteomic method, we FACS-isolated the same cell populations and used peak integration, a label-free quantitative proteomic approach (SI Appendix, Fig. S2). We identified and quantified 434 proteins at <1% FDR (SI Appendix, Tables S11 and S12); 85% of these proteins were also detected by GeLC-MS/MS proteomics (SI Appendix, Table S13). Taken together with the distinct grouping of the biological and technical replicates of the samples and the striking differences between cell-type profiles (SI Appendix, Fig. S6), these data highlight the reproducibility of the datasets and point to the strength of our cell-type approach. Further supporting this, we also identified proteins enriched in a single cell type using peak integration (Fig. 2E). We next computed the correlations between peak-integration proteomic and RNA expression profiles using continuous values for both and observed positive correlations that were higher than those found with the GeLC-MS/MS proteomic data (Fig. 2C). Although proteomic technologies are improving, RNA technologies sample the nearly complete transcriptome, whereas only a fraction of the proteome is found by proteomic strategies. Our detection of less than a tenth of the Arabidopsis proteome supports this idea. Therefore, comparisons between RNA and protein profiles represent a small, potentially biased, snapshot of the correlation between the complete Arabidopsis transcriptome and proteome. Many biological reasons also exist for the differences between mRNA and protein abundances: miRNA regulation, antisense transcription, mRNA transcript stability, translational rates, and protein stability and movement. Despite these considerations, we found that there is a definite positive correlation between protein and mRNA abundance. However, these correlations are modest at best.
GeLC-MS/MS Proteomics Reveals Unique Root Hair Regulators and Candidate Cell Type Biomarkers.
We hypothesized that proteins identified in a single cell population could play important functional roles in that cell type (SI Appendix, Table S3). We focused our functional analyses on root hairs where the majority of candidates existed. Some of these candidates were also identified in previous transcriptome analyses of root hairs (SI Appendix, Table S14) (44–46). Five of the 238 candidate root hair biomarkers were previously shown to control root hair development. To uncover unique root hair regulators, we performed a reverse genetic screen on 66 of the remaining candidates (SI Appendix, Tables S3 and S15) (47). Three insertional mutants exhibited root hair defects: one in COBL9 served as a control in our phenotypic assay (Fig. 3A); two were in proteins encoded by At1g01910 and At4g13050, respectively, and displayed reductions in root hair outgrowth (Fig. 3A). At1g01910 encodes a protein with anion-transporting ATPase and RAS GTPase domains (48), suggesting a unique role in root hair morphogenesis. At4g13050 encodes an acyl-ACP thioesterase that terminates fatty acid biosynthesis and is important in commercial plant oil production (Fig. 3A) (49). These examples support the functionality of candidate root cell type biomarkers.
Fig. 3.

Root hair proteins identified by GeLC-MS/MS proteomics. (A) Functional roles of root hair proteins. Left to right: bright-field images of wild-type and homozygous insertional mutant 7-d-old root hairs. Roots of wild-type grown on the same plate as mutants of the root hair biomarker cobl9 (Salk_09333C) and the newly identified root hair mutants Salk_012980C and Salk_111046C, respectively. (B) Left to right: 7-d-old root hair phenotypes of wild-type, caprice triptychon, and werewolf myb23, respectively, used for GeLC-MS/MS proteomics. (C) Venn diagram of the overlap of the samples in B.
We also wanted to take a complementary strategy to identify proteins in root hairs. We isolated and profiled 1 × 10⁶ cells of the following by GeLC-MS/MS proteomics: whole roots of werewolf myb23 mutants producing excessive root hairs, caprice triptychon mutants that largely lack root hairs, and wild-type plants (Fig. 3B) (50). We reasoned that comparing these genetic samples would reveal proteins enriched in root hairs. We identified 1,136 proteins at a FDR of 1% (SI Appendix, Tables S16 and S17) and examined the overlap between wild-type, hairy, and hairless mutant root proteins. We found more than 200 root hair proteins that were in wild-type and/or hairy mutant roots and were not found in hairless mutant roots (Fig. 3C and SI Appendix, Table S17). Fewer than five of these proteins are found from transcriptional profiling of these mutant roots (18), which suggests that transcriptomic profiling of mutants produces different results. A few of these proteins were also identified in previous transcriptome analyses of root hairs (SI Appendix, Table S14) (44–46). Ten of these proteins were also root hair specific in the root cellular proteome (SI Appendix, Table S18), suggesting that the two strategies are complementary. However, a large portion (36%) of proteins was found in all three genetic samples (Fig. 3C). Furthermore, known regulators of root hair development were not found using samples from different genetic backgrounds, and it is less feasible, if not impossible, to profile genetic mutants by proteomics for certain cell types. We conclude that although using FACS samples for proteomic profiling is advantageous, using samples from different genetic backgrounds provides a complementary approach to identifying root hair proteins.
Proteins identified in specific cell types are promising biomarker candidates; however, it is possible that these proteins are present in other cell populations below our detection levels or fail to meet our statistical cutoffs. We thus report cell type biomarkers as proteins that were identified in a single cell type and were also enriched in that cell type in transcriptome data (SI Appendix, Tables S19 and S20). Notably, these 61 cell type biomarkers include known regulators, such as PIN1, COBL9, and PIN3 of vascular, root hair, and columella cells, respectively (SI Appendix, Tables S5 and S20). The biomarkers and the cellular proteins identified here are potentially valuable resources for future applied research. For example, root hair proteins we identified from genetic mutants or FACS isolation might function in water and nutrient uptake relevant to studies assessing heat and drought stress effects (51). Additionally, fifty of the cellular proteins we report are associated with cell wall production and processes that might be relevant to biofuel research (SI Appendix, Table S21) (52). Besides cell type biomarkers, our cellular proteomic map of a developmental model organ is an important resource of expression data for nearly 2,000 proteins, more than 200 of which lack cellular RNA expression information (SI Appendix, Table S6). Our root cellular proteome also revealed support for transcriptome and interactome data. This type of data integration is critical for determination and manipulation of regulatory networks that control biological systems and also for future applications in crop improvement and biofuel production (52–54).
Materials and Methods
Plant Materials, Growth Conditions, and Phenotypic Analyses.
A. thaliana wild-type plants and all plant marker lines (COBL9, WER, CORTEX, SCR, WOL, and PET111) are in the Columbia-0 (Col-0) accession (18, 55–59). The wer-1 myb23-1 mutations are also in Col-0, and cpc-1 try-82 mutations are in a mixed background derived from the accessions Col-0, Landsberg carrying the erecta mutation [La(er)], and Wassilevskaya-0 (Ws-0) (18). The following Salk insertion lines were obtained from the Arabidopsis Biological Resource Center (47) and are in the Col-0 background: cobl9 (Salk_09333C) in At5g49270, (Salk_012980C) in At1g01910, and (Salk_111046C) in At4g13050. Primers used to verify that each mutant line was homozygous were as follows: cobl9, 549270LF 5′-CCTGCTTTGGTAGGAAATGG-3′ and 542970R 5′-GGATGATAGAGTCGTTGAAGA-3′; Salk_012980C, 101910L2F 5′- GAGGCGACAGTACAGAACAT-3′ and 101910R 5′-TCAATCACATCTTTCAAGCCC-3′; Salk_111046C, 413050LF 5′-GGTGGAGGCAATTGATCTAGG-3′ and 413050R 5′-TCTTCCATCAATCGACCAAAC-3′. The genotyping primer used to detect the left border of the insertional element in each line was LB1.3 5′- ATTTTGCCGATTTCGGAAC-3′.
For all proteomic profiling experiments seeds were sterilized using 50% (vol/vol) bleach and 0.1% Tween for 5 min and then rinsed three times with sterile water. For all other experiments seeds were sterilized using a solution of 30% (vol/vol) bleach and 1 μL/1 mL 20% (vol/vol) Triton-X100 for 10 min and then rinsed four times with sterile water. All seeds were plated on standard MS media [1× concentration Murashige and Skoog salt mixture (Caisson Laboratories), 0.5 g/L Mes, 1% sucrose, and 1% agar (Difco) and adjusted to pH 5.7 with KOH) with (for proteomic profiling experiments) or without (for phenotyping) mesh. All plated seeds were stratified at 4 °C for 2 d before germination on vertically positioned square plates in a Percival incubator with 16 h of daily illumination.
For verification of GFP marker line expression, each marker line (GFP reporters of COBL9, WER, CORTEX, SCR, WOL, and PET111) was grown on MS plates for 6 d. Plant roots were then stained in 10 μM propidium iodide and imaged by laser scanning confocal microscopy using the 25× objective of a Zeiss LSM 510 confocal microscope.
Phenotypic analyses of the 85 insertional mutant lines, corresponding to 66 genes, were performed as follows: 10 plants of the wild type and also of a given insertional mutant line were plated side by side on an agar plate, and roots of 7-d-old mutant plants were examined for root hair defects that were absent from the control (wild-type) roots grown on the same plate using a Leica dissecting microscope (Leica MDG30 transmitted light base equipped with a Leica Z6 APO zoom macroscope). Identical phenotypic analyses of the 85 insertional mutant lines were performed a second time using seeds collected from the first analyses (i.e., second generation). Mutant insertion lines with consistent root hair phenotypes in both assays (≈20 mutant plants total of each line) were assayed a third time. All root hair defects were imaged using identical magnification settings under the Leica dissecting microscope fit with a Qimaging RETIGA Ex camera.
Cellular Isolation and Sorting.
For cellular isolations used for GeLC-MS/MS proteomics, 6-d-old roots were cut into pieces, treated with protoplasting solution, and sorted as described previously (17, 60). All sorting was immediately halted when 1 × 10⁶ cells were collected for each biological replicate. This strategy allowed us to identify GFP in each sample and reduce sample complexity before MS. The same procedure was used for cellular isolations from whole roots of wild-type, caprice tryiptycon, and werewolf myb23 seedlings, except the gate for fluorescence was not used. For peak-integration proteomic experiments the procedure was identical, except BSA was not used in the sorting solutions.
Protein Profiling by GeLC-MS/MS Proteomics.
One million sorted root cells of each sample were gently pelleted by centrifugation. After centrifugation, the supernatant was removed and the cells were flash frozen and stored at −80 °C for future protein isolation and proteomic profiling. Sequential protein extraction was performed by homogenizing the sample in a Mixer-Mill using glass beads and then resuspending the homogenized sample consecutively in 50 μL of a salt-based soluble buffer [100 mM KCl, 50 mM Tris·HCl, 1.4 μM PMSF, and one tablet of protease mixture inhibitor (Roche Diagnostics)], a urea-based buffer (10 mM Tris·HCl, 5 mM EDTA, 0.1% SDS, 6 M urea, 1 M thiourea, and one tablet of protease mixture inhibitor), and/or a detergent-based buffer (125 mM Tris·HCl, 2% (wt/vol) SDS, 10% (vol/vol) glycerol, 50 mM Na2S2O5, and one tablet of protease mixture inhibitor). Between each buffer, the sample was centrifuged (30 min at 20,000 × g at 17 °C) and homogenized using an electric pestle. Each protein sample fraction was loaded individually onto a 0.75-mm, 12% SDS PAGE minigel (Mini-PROTEAN 3 Cell; Bio-Rad) and separated by one-dimensional SDS/PAGE. Gels were cut into ≈12 slices of 0.4 cm with a custom-made gel cutter. Gel slices were sequentially treated with 10 mM DTT (30 min, 60 °C), 50 mM iodoacetamide (30 min, room temperature, dark), and then used for in-gel digestion with trypsin overnight at 37 °C (8). MS was performed as described in ref. 8 with a 2D linear ion trap, Finnigan LTQ (Thermo Electron Corporation), equipped with an Ultimate Nano HPLC System (Dionex ).
Data Analysis of GeLC-MS/MS Proteomic Samples.
All MS/MS spectra were processed and analyzed using the Trans-Proteomic Pipeline (TPP) (61). Briefly, mzXML output files were searched using the Sequest search algorithm against the A. thaliana reference protein database TAIR9 (TAIR, release 9), concatenated with a decoy database (the reversed TAIR9 database) to estimate the overall FDR (62, 63), plus roughly 260 additional known contaminants (i.e., porcine trypsin, various keratins). The searches were performed allowing for semitryptic peptide identification using a mass tolerance of 3 Da, and methionine oxidation and cysteine 29 carbamidomethylation as variable modifications. PeptideProphet and ProteinProphet were then used to identify and validate peptide and protein search engine results, respectively (64–66). Only peptides with MS/MS spectra matching with >90% confidence at the peptide level were reported (SI Appendix, Tables S1 and S16). We report and consider only those proteins that were uniquely identified by two or more unique peptides that match MS/MS spectra with >90% confidence (SI Appendix, Tables S2 and S17). Our datasets are available in SI Appendix and have also been uploaded for public release at www.proteomecommons.org/tranche under the project “The Protein Expression Landscape of the Arabidopsis Root” (SI MS/MS Spectra). The hash for each tranche submission is listed in SI Appendix. Overall FDR at the protein level was then calculated as the number of proteins identified in the reversed TAIR9 decoy database divided by the total number of proteins identified from the TAIR9 reference protein database, multiplied by 100 to express FDR as a percentage. Candidate root cell type biomarkers and spatial clusters of protein cellular localization were determined by representing our high-confidence protein identifications as binary matrices (SI Appendix, Figs. S4 and S5 and Tables S2 and S17). In these matrices, presence of a protein in a particular cell population, encoded by “1” in the matrix, was determined if a protein was identified using the aforementioned stringent criteria in one or more of the serial extraction fractions of a given cell population; absence, encoded by “0” in the matrix, indicates failure of a protein to be identified using the same criteria in any of the serial extraction fractions of a given cell population. Heat maps of the resulting spatial clusters of the root cellular proteome were generated using MultiExperiment Viewer software (version 4) (67, 68). To calculate enrichment of GO terms for the proteins identified solely in each individual cell population, as well as protein members of individual spatial clusters of the root cellular proteome, we used software using the hypergeometric distribution, which tests whether GO terms are found in a list more frequently than expected by chance and then calculates a P value that is corrected for multiple hypothesis testing (69, 70). Heat maps of GO enrichment were generated using MultiExperiment Viewer software (version 4) (67, 68).
Data Integration Using GeLC-MS/MS Proteomic Profiles.
To integrate our root cellular proteome with Arabidopsis metabolic pathway information, we compared the loci from the root cellular proteome with those annotated in Arabidopsis metabolic pathways (AraCyc) (30, 31). AraCyc pathways were bulk downloaded from the Plant Metabolic Network (http://www.plantcyc.org/) on May 5, 2010. The file used is now found at ftp://ftp.plantcyc.org/Pathways/OLD/aracyc_dump.20091014.
We integrated our root cellular proteome data with available interactome data from TAIR and BioGRID databases (71). The file of PPIs curated by TAIR (file last updated February 1, 2011) was bulk downloaded and is at ftp://ftp.arabidopsis.org/home/tair/Proteins/nbrowse_interactions. The file of Arabidopsis PPIs deposited in BioGRID (version 3.1.75, file last updated February 1, 2011) (71) was bulk downloaded on March 6, 2011 and can be obtained from http://thebiogrid.org/download.php. We removed interactions that were reciprocal, with At1g80690, and self-self because these interactions artificially increased the level of colocalization (i.e., the number of colocalizing pairs was inflated owing to double counting of a reciprocal interaction). We implemented a randomization strategy to evaluate the significance of the observed level of colocalization of the PPI pairs relative to a randomly paired set. Colocalization is defined as protein coexpression in one of the six studied cell types. Of the 113 PPIs pairs in the TAIR and BioGRID databases for which both interactor proteins are in our root cellular proteome, we quantify the level of colocalization for each pair by the following statistic: 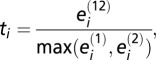 where
where  is the number of cell types in which member j from protein pair i is found, and
  denotes the number of cell types in which both members of protein pair i are detected. To summarize the overall evidence of concordance between colocalization and PPI for the entire dataset we define
 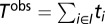 where the set of indexes to sum over includes all PPI pairs that do not contain a ubiquitously expressed member (expressed in all six cell types), that is,
  . Next we constructed a null distribution that preserves the overall localization matrix of the individual proteins, randomizing the individual colocalization partners. This is achieved by randomly permuting the pair assignment of the 226 individual proteins B times and estimating the corresponding evidence
  The final estimate of the significance of the observed colocalization in the given protein expression context is quantified by the empirical P value:
 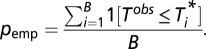 Using B = 100,000 permutations, the estimated significance is 0.0688 (random seed: 123456789). An implementation of the above-described randomization procedure in the programming language Ruby is available from the authors upon request. Note that in the randomization procedure described above we focus on the observed relevant colocalization (normalized for ubiquitous expression) because it is important to take into account the fact that a large fraction of the PPIs are ubiquitously expressed (36% of the pairs contain at least one ubiquitously expressed member), which results in high a priori expectation of background colocalization. Hence, we normalize the contribution of each pair to the overall significance score by dividing by the number of cell types in which coexpression could potentially take place. Nonetheless, the resolution for finding interesting patterns in terms of colocalization is limited owing to the small dynamic range of observed proteins—mostly at the high end of the spectrum—which gives us additional confidence that the P value of 0.069 reflects strong evidence against a putative random relationship between colocalization and the PPIs.
To compare RNA and protein expression profiles from the root cellular proteome and the microarray data of Dinneny et al. (18) of the cell populations of root hairs (COBL9), nonhair epidermis (WER), cortex (CORTEX), endodermis-quiescent center (SCR), vasculature (WOL), and columella (PET111), we first normalized the Affymetrix microarray data of the same cell populations using a mixed-model ANOVA normalization (18, 69, 72). We then extracted the RNA expression profiles corresponding to the loci identified in our root cellular proteome (SI Appendix, Table S2). Of the 1,995 proteins in the root cellular proteome, 1,835 proteins had RNA expression profiles detected by Affymetrix microarrays. For the RNA expression value of each locus in each cell type, the mean value was then converted to a binary value (“1” denotes presence and “0” denotes absence) at the same specified mean RNA expression value. For example, if the cutoff was “3,” then all mean values ≥3 and <3 were converted to “1” and “0,” respectively. The resulting binary matrix of RNA expression values was then compared with the matrix of binary root cellular proteome values for each cell population. These matrices were of the same dimension, and the order of loci was identical. The PCC was then computed using the correlation function in the statistical programming language R (version 2.6.2) for each cell type. This process was then repeated using a conversion cutoff of the normalized microarray values that spanned the full range of the mean RNA expression values of the RNA profiles (0–57) in 0.1 increments. We report the highest PCC calculated for each cell type that had a single, stable cutoff value. To determine whether the microarray normalization used affected the PCC, we also normalized the data using the Robust Multichip Average (RMA) normalization (RMA express, version 1.0.5) (73–75) and repeated the analysis; we did not observe differences in the PCCs of each cell type from RMA and those obtained using ANOVA.
Protein Profiling by Peak Integration.
One million sorted root cells of the wild type (two biological replicates) and each of the GFP marker lines—COBL9 (root hairs), WER (nonhair epidermis), CORTEX (cortex), SCR (endodermis and quiescent center), WOL (vasculature), and PET111 (columella)—were gently pelleted by centrifugation and resuspended in 100 μL of 0.5% Rapigest SF Surfactant (Waters Corp.). Samples were then sonicated constantly for 10 min on the high setting of a Bioruptor UCD-200 sonicator (Diagenode). After sonication, the samples were incubated for 5 min at 90 °C and then spun at maximum speed for 10 min to remove debris. Protein samples were then quantified by standard Bradford assays and also using Micro BCA Protein Assay kit (Thermo Scientific) that was analyzed using a Thermo Scientific Original Multiskan EX Plate Reader. Using our isolation procedure on 1 × 10⁶ root cells, the total amount of protein ranged from 10 to 30 μg for each sample. After quantification, protein samples were stored at −80 °C until they were profiled by MS at the Duke Proteomics Core Facility. Samples were thawed at 37 °C for 10 min with vortexing, and 15 μg of protein from each sample was concentration-normalized to ≈1.0 mg/mL using a mini-Bradford assay (Bio-Rad). Cysteine residues were reduced with 10 mM DTT and alkylated with 20 mM iodoacetamide. Proteins were digested with sequencing grade modified porcine trypsin (Promega) at a 1:50 wt/wt enzyme to substrate ratio overnight at 37 °C. Rapigest was hydrolyzed with the addition of trifluoroacetic acid and acetonitrile to final concentrations of 1% and 2% vol/vol, respectively; samples where heated to 60 °C for 2 h to ensure complete hydrolysis. Samples were cooled to 4 °C, centrifuged to remove particulates, and the supernatant was isolated and stored until analysis by LC-MS/MS.
For peak integration, label-free LC-MS/MS were collected from peptide digests that were analyzed using a nanoAcquity UPLC system coupled to a Synapt HDMS mass spectrometer (Waters Corp.). Approximately 1 μg of peptide material was first trapped at 20 μL/min for 2 min in 99.9% water with 0.1% vol/vol formic acid on a 20 μm × 180 mm Symmetry C18 column. Separations were then performed on a 75 μm × 250 mm column with 1.7 μm C18 BEH particles (Waters Corp.) using a 90-min gradient of 5–40% acetonitrile with 0.1% formic acid at a flow rate of 0.3 μL/min and 45 °C column temperature. We first conducted a single data-dependent analysis (DDA) of each sample that was used for column conditioning and complimentary identifications but not for quantification. The DDA experiments used a 0.9-s MS scan followed by MS/MS acquisition of the top three ions with charge >1. MS/MS scans for each ion used an isolation window of ≈3 Da, a maximum of 4 s per precursor, and dynamic exclusion for 120 s within 1.2 Da. For simultaneous qualitative and quantitative analysis, we then conducted three data-independent (MSE) analyses of each sorted whole root or cell type sample. MSE runs of all samples were performed in a statistically randomized fashion to avoid systematic temporal bias. MSE acquisition used a 0.9-s cycle time alternating between low collision energy (6 V) and high collision energy ramp (15–40 V).
Data Analysis of Peak Integration Data.
For robust peak detection and label-free alignment of individual peptides across all sample injections, the commercial package Rosetta Elucidator v3.3 (Rosetta Biosoftware) with the PeakTeller algorithm (76) was used, in a manner similar to a number of recent publications (77–84). After alignment and annotation, chromatographic peak intensities belonging to the same precursor mass in the MSE aligned chromatograms were then used to calculate the relative peptide and protein abundance on a sample-by-sample basis. Three MSE analytical replicate intensities for each peptide were combined by averaging after robust median scaling, to generate one intensity measurement per peptide for each sample (SI Appendix, Table S11), and individual peptide intensities were summed to yield protein intensities. The values were then log(10) transformed for statistical analysis (SI Appendix, Table S12).
We used both MS/MS DDA and MSE to generate peptide identifications. For DDA files, searchable peaklists were produced in Elucidator v3.3, and searches were then submitted to and retrieved from the Mascot v2.2 (Matrix Science) search engine in an automated fashion. For MSE data, ProteinLynx Global Server 2.4 (Waters Corp.) was used to generate searchable files that were then submitted to the IdentityE search engine (Waters Corp.), after which result files were then imported back into Elucidator. Both DDA and MSE data were searched against the TAIR9 database (31,221 entries, downloaded June 19, 2009 from ftp://ftp.arabidopsis.org/home/tair/Proteins/), with full 1× reverse database appended for peptide FDR determination and the addition of the sequence of ADH1_YEAST because this was used as an internal standard in the samples. Precursor ion mass tolerance was 20 ppm for both PLGS and Mascot searches, and product ion tolerance was 0.1 Da for Mascot and 40 ppm for PLGS. Tryptic enzyme specificity and a maximum of two missed cleavages were allowed. Carbamidomethyl cysteine was included as a fixed modification, and variable modifications included oxidized methionine and deamidated asparagine and glutamine.
To enable global spectra scoring across results from both search engines, all search results were concurrently validated using the PeptideProphet and ProteinProphet algorithms in Elucidator using independent reverse decoy database validation (64, 85). Peptides with PeptideProphet scores >0.76 were then annotated; this score corresponded to a 1% peptide FDR. Overall, 3,212 peptides were identified to 878 proteins, 434 with two or more peptides to match. Individual peptide scores are reported in SI Appendix, Table S11. Each peptide identified was allowed to be assigned to a single protein entry, and these assignments were made by ProteinProphet according to the rules of parsimony, and ProteinProphet scores are also provided in SI Appendix, Table S11. Database search results and spectra have been uploaded in the form of Scaffold 3 files (.sf3; Proteome Software) to the Tranche database (https://proteomecommons.org/tranche/) and can be accessed using the information available in SI Appendix.
Data Integration Using Peak-Integration Proteomic Profiles.
Protein and RNA expression profiles from peak integration and the microarray of (18), respectively, the cell populations of root hairs (COBL9), nonhair epidermis (WER), cortex (CORTEX), endodermis-quiescent center (SCR), vasculature (WOL), and columella (PET111) were compared by first normalizing the Affymetrix microarray data of the same cell populations using the mixed-model ANOVA normalization (18, 69, 72). Of the 434 proteins in the root cellular proteome obtained by peak integration, 371 proteins had RNA expression profiles detected by Affymetrix microarrays. The matrices of log transformed RNA expression values and the log protein intensity values were of the same dimension, and the order of loci was identical. The PCC was then computed using the correlation function in the statistical programming language R (version 2.6.2) for each cell type.
Supplementary Material
Acknowledgments
We thank Heather Belcher and Dr. Beth Harvat for assistance with cellular isolation and FACS; the Functional Genomics Center Zurich (FGCZ), especially Drs. Bernd Roschitzki and Christian Panse, for technical support; Prof. Ralph Schlapbach for providing access to FGCZ infrastructure and facilities; and the members of the P.N.B. laboratory for reviewing this manuscript. J.J.P. was supported by National Institutes of Health (NIH) Ruth L. Kirschstein National Research Service Award F32GM086976. M.M. is supported by National Science Foundation Postdoctoral Fellowship in Biological Informatics 0805648. This work was supported by generous funding from NIH Program Grant 1P50-GM081883 (to P.N.B. and U.O.) and the University of Zürich through the University Research Priority Program in Systems Biology/Functional Genomics (to U.G.).
Footnotes
The authors declare no conflict of interest.
1Monica A. Schauer formerly known as Monica A. Grobei.
This article contains supporting information online at www.pnas.org/lookup/suppl/doi:10.1073/pnas.1202546109/-/DCSupplemental.
References
- 1.Aebersold R, Mann M. Mass spectrometry-based proteomics. Nature. 2003;422:198–207. doi: 10.1038/nature01511. [DOI] [PubMed] [Google Scholar]
- 2.Ahrens CH, Brunner E, Qeli E, Basler K, Aebersold R. Generating and navigating proteome maps using mass spectrometry. Nat Rev Mol Cell Biol. 2010;11:789–801. doi: 10.1038/nrm2973. [DOI] [PubMed] [Google Scholar]
- 3.Choudhary C, Mann M. Decoding signalling networks by mass spectrometry-based proteomics. Nat Rev Mol Cell Biol. 2010;11:427–439. doi: 10.1038/nrm2900. [DOI] [PubMed] [Google Scholar]
- 4.Chik JK, Schriemer DC, Childs SJ, McGhee JD. Proteome of the Caenorhabditis elegans oocyte. J Proteome Res. 2011;10:2300–2305. doi: 10.1021/pr101124f. [DOI] [PubMed] [Google Scholar]
- 5.Pfeiffer MJ, et al. Proteomic analysis of mouse oocytes reveals 28 candidate factors of the “reprogrammome”. J Proteome Res. 2011;10:2140–2153. doi: 10.1021/pr100706k. [DOI] [PubMed] [Google Scholar]
- 6.Wang S, et al. Proteome of mouse oocytes at different developmental stages. Proc Natl Acad Sci USA. 2010;107:17639–17644. doi: 10.1073/pnas.1013185107. [DOI] [PMC free article] [PubMed] [Google Scholar]
- 7.Zhao Z, Zhang W, Stanley BA, Assmann SM. Functional proteomics of Arabidopsis thaliana guard cells uncovers new stomatal signaling pathways. Plant Cell. 2008;20:3210–3226. doi: 10.1105/tpc.108.063263. [DOI] [PMC free article] [PubMed] [Google Scholar]
- 8.Grobei MA, et al. Deterministic protein inference for shotgun proteomics data provides new insights into Arabidopsis pollen development and function. Genome Res. 2009;19:1786–1800. doi: 10.1101/gr.089060.108. [DOI] [PMC free article] [PubMed] [Google Scholar]
- 9.Baker MA, Hetherington L, Reeves GM, Aitken RJ. The mouse sperm proteome characterized via IPG strip prefractionation and LC-MS/MS identification. Proteomics. 2008;8:1720–1730. doi: 10.1002/pmic.200701020. [DOI] [PubMed] [Google Scholar]
- 10.Wasbrough ER, et al. The Drosophila melanogaster sperm proteome-II (DmSP-II) J Proteomics. 2010;73:2171–2185. doi: 10.1016/j.jprot.2010.09.002. [DOI] [PubMed] [Google Scholar]
- 11.Baerenfaller K, et al. Genome-scale proteomics reveals Arabidopsis thaliana gene models and proteome dynamics. Science. 2008;320:938–941. doi: 10.1126/science.1157956. [DOI] [PubMed] [Google Scholar]
- 12.Kline KG, Frewen B, Bristow MR, Maccoss MJ, Wu CC. High quality catalog of proteotypic peptides from human heart. J Proteome Res. 2008;7:5055–5061. doi: 10.1021/pr800239e. [DOI] [PMC free article] [PubMed] [Google Scholar]
- 13.Ewen K, Baker M, Wilhelm D, Aitken RJ, Koopman P. Global survey of protein expression during gonadal sex determination in mice. Mol Cell Proteomics. 2009;8:2624–2641. doi: 10.1074/mcp.M900108-MCP200. [DOI] [PMC free article] [PubMed] [Google Scholar]
- 14.Price JC, Guan S, Burlingame A, Prusiner SB, Ghaemmaghami S. Analysis of proteome dynamics in the mouse brain. Proc Natl Acad Sci USA. 2010;107:14508–14513. doi: 10.1073/pnas.1006551107. [DOI] [PMC free article] [PubMed] [Google Scholar]
- 15.Zhao S, et al. Regulation of cellular metabolism by protein lysine acetylation. Science. 2010;327:1000–1004. doi: 10.1126/science.1179689. [DOI] [PMC free article] [PubMed] [Google Scholar]
- 16.Cammarato A, et al. A mighty small heart: The cardiac proteome of adult Drosophila melanogaster. PLoS ONE. 2011;6:e18497. doi: 10.1371/journal.pone.0018497. [DOI] [PMC free article] [PubMed] [Google Scholar]
- 17.Birnbaum K, et al. A gene expression map of the Arabidopsis root. Science. 2003;302:1956–1960. doi: 10.1126/science.1090022. [DOI] [PubMed] [Google Scholar]
- 18.Dinneny JR, et al. Cell identity mediates the response of Arabidopsis roots to abiotic stress. Science. 2008;320:942–945. doi: 10.1126/science.1153795. [DOI] [PubMed] [Google Scholar]
- 19.Davies PJ. Plant Hormones and Their Role in Plant Growth and Development. Dordrecht, The Netherlands: Martinus Nijhoff Publishers; 1987. [Google Scholar]
- 20.Goldsmith MHM. The polar transport of auxin. Annu Rev Plant Physiol. 1977;28:439–478. [Google Scholar]
- 21.Olsen GM, Mirza JI, Maher EP, Iversen TH. Ultrastructure and movements of cell organelles in the root cap of agravitropic mutants and normal seedlings of Arabidopsis thaliana. Physiol Plant. 1984;60:523–531. doi: 10.1111/j.1399-3054.1984.tb04921.x. [DOI] [PubMed] [Google Scholar]
- 22.Kiss JZ, Hertel R, Sack FD. Amyloplasts are necessary for full gravitropic sensitivity in roots of Arabidopsis thaliana. Planta. 1989;177:198–206. [PubMed] [Google Scholar]
- 23.Sachs T. Pattern Formation in Plant Tissues. Cambridge, UK: Cambridge Univ Press; 1991. [Google Scholar]
- 24.Gälweiler L, et al. Regulation of polar auxin transport by AtPIN1 in Arabidopsis vascular tissue. Science. 1998;282:2226–2230. doi: 10.1126/science.282.5397.2226. [DOI] [PubMed] [Google Scholar]
- 25.Friml J, Wiśniewska J, Benková E, Mendgen K, Palme K. Lateral relocation of auxin efflux regulator PIN3 mediates tropism in Arabidopsis. Nature. 2002;415:806–809. doi: 10.1038/415806a. [DOI] [PubMed] [Google Scholar]
- 26.Zheng H, Staehelin LA. Protein storage vacuoles are transformed into lytic vacuoles in root meristematic cells of germinating seedlings by multiple, cell type-specific mechanisms. Plant Physiol. 2011;155:2023–2035. doi: 10.1104/pp.110.170159. [DOI] [PMC free article] [PubMed] [Google Scholar]
- 27.Ursic D, Culbertson MR. The yeast homolog to mouse Tcp-1 affects microtubule-mediated processes. Mol Cell Biol. 1991;11:2629–2640. doi: 10.1128/mcb.11.5.2629. [DOI] [PMC free article] [PubMed] [Google Scholar]
- 28.Brackley KI, Grantham J. Activities of the chaperonin containing TCP-1 (CCT): Implications for cell cycle progression and cytoskeletal organisation. Cell Stress Chaperones. 2009;14:23–31. doi: 10.1007/s12192-008-0057-x. [DOI] [PMC free article] [PubMed] [Google Scholar]
- 29.Muñoz IG, et al. Crystal structure of the open conformation of the mammalian chaperonin CCT in complex with tubulin. Nat Struct Mol Biol. 2011;18:14–19. doi: 10.1038/nsmb.1971. [DOI] [PubMed] [Google Scholar]
- 30.Mueller LA, Zhang P, Rhee SY. AraCyc: A biochemical pathway database for Arabidopsis. Plant Physiol. 2003;132:453–460. doi: 10.1104/pp.102.017236. [DOI] [PMC free article] [PubMed] [Google Scholar]
- 31.Zhang P, et al. MetaCyc and AraCyc. Metabolic pathway databases for plant research. Plant Physiol. 2005;138:27–37. doi: 10.1104/pp.105.060376. [DOI] [PMC free article] [PubMed] [Google Scholar]
- 32.Lepiniec L, et al. Genetics and biochemistry of seed flavonoids. Annu Rev Plant Biol. 2006;57:405–430. doi: 10.1146/annurev.arplant.57.032905.105252. [DOI] [PubMed] [Google Scholar]
- 33.Vidal M, Cusick ME, Barabási AL. Interactome networks and human disease. Cell. 2011;144:986–998. doi: 10.1016/j.cell.2011.02.016. [DOI] [PMC free article] [PubMed] [Google Scholar]
- 34.Blakeslee JJ, et al. Interactions among PIN-FORMED and P-glycoprotein auxin transporters in Arabidopsis. Plant Cell. 2007;19:131–147. doi: 10.1105/tpc.106.040782. [DOI] [PMC free article] [PubMed] [Google Scholar]
- 35.Gygi SP, Rochon Y, Franza BR, Aebersold R. Correlation between protein and mRNA abundance in yeast. Mol Cell Biol. 1999;19:1720–1730. doi: 10.1128/mcb.19.3.1720. [DOI] [PMC free article] [PubMed] [Google Scholar]
- 36.Chen G, et al. Discordant protein and mRNA expression in lung adenocarcinomas. Mol Cell Proteomics. 2002;1:304–313. doi: 10.1074/mcp.m200008-mcp200. [DOI] [PubMed] [Google Scholar]
- 37.Ghaemmaghami S, et al. Global analysis of protein expression in yeast. Nature. 2003;425:737–741. doi: 10.1038/nature02046. [DOI] [PubMed] [Google Scholar]
- 38.Williamson AJ, et al. Quantitative proteomics analysis demonstrates post-transcriptional regulation of embryonic stem cell differentiation to hematopoiesis. Mol Cell Proteomics. 2008;7:459–472. doi: 10.1074/mcp.M700370-MCP200. [DOI] [PubMed] [Google Scholar]
- 39.Gry M, et al. Correlations between RNA and protein expression profiles in 23 human cell lines. BMC Genomics. 2009;10:365. doi: 10.1186/1471-2164-10-365. [DOI] [PMC free article] [PubMed] [Google Scholar]
- 40.Eisenberg E, Levanon EY. Human housekeeping genes are compact. Trends Genet. 2003;19:362–365. doi: 10.1016/S0168-9525(03)00140-9. [DOI] [PubMed] [Google Scholar]
- 41.Walther D, Brunnemann R, Selbig J. The regulatory code for transcriptional response diversity and its relation to genome structural properties in A. thaliana. PLoS Genet. 2007;3:e11. doi: 10.1371/journal.pgen.0030011. [DOI] [PMC free article] [PubMed] [Google Scholar]
- 42.Colinas J, Schmidler SC, Bohrer G, Iordanov B, Benfey PN. Intergenic and genic sequence lengths have opposite relationships with respect to gene expression. PLoS ONE. 2008;3:e3670. doi: 10.1371/journal.pone.0003670. [DOI] [PMC free article] [PubMed] [Google Scholar]
- 43.Stevenson SE, Chu Y, Ozias-Akins P, Thelen JJ. Validation of gel-free, label-free quantitative proteomics approaches: Applications for seed allergen profiling. J Proteomics. 2009;72:555–566. doi: 10.1016/j.jprot.2008.11.005. [DOI] [PubMed] [Google Scholar]
- 44.Jones MA, Raymond MJ, Smirnoff N. Analysis of the root-hair morphogenesis transcriptome reveals the molecular identity of six genes with roles in root-hair development in Arabidopsis. Plant J. 2006;45:83–100. doi: 10.1111/j.1365-313X.2005.02609.x. [DOI] [PubMed] [Google Scholar]
- 45.Won SK, et al. Cis-element- and transcriptome-based screening of root hair-specific genes and their functional characterization in Arabidopsis. Plant Physiol. 2009;150:1459–1473. doi: 10.1104/pp.109.140905. [DOI] [PMC free article] [PubMed] [Google Scholar]
- 46.Deal RB, Henikoff S. A simple method for gene expression and chromatin profiling of individual cell types within a tissue. Dev Cell. 2010;18:1030–1040. doi: 10.1016/j.devcel.2010.05.013. [DOI] [PMC free article] [PubMed] [Google Scholar]
- 47.Alonso JM, et al. Genome-wide insertional mutagenesis of Arabidopsis thaliana. Science. 2003;301:653–657. doi: 10.1126/science.1086391. [DOI] [PubMed] [Google Scholar]
- 48.Marchler-Bauer A, et al. CDD: A Conserved Domain Database for the functional annotation of proteins. Nucleic Acids Res. 2011;39(Database issue):D225–D229. doi: 10.1093/nar/gkq1189. [DOI] [PMC free article] [PubMed] [Google Scholar]
- 49.Salas JJ, Ohlrogge JB. Characterization of substrate specificity of plant FatA and FatB acyl-ACP thioesterases. Arch Biochem Biophys. 2002;403:25–34. doi: 10.1016/S0003-9861(02)00017-6. [DOI] [PubMed] [Google Scholar]
- 50.Schellmann S, et al. TRIPTYCHON and CAPRICE mediate lateral inhibition during trichome and root hair patterning in Arabidopsis. EMBO J. 2002;21:5036–5046. doi: 10.1093/emboj/cdf524. [DOI] [PMC free article] [PubMed] [Google Scholar]
- 51.Libault M, Brechenmacher L, Cheng J, Xu D, Stacey G. Root hair systems biology. Trends Plant Sci. 2010;15:641–650. doi: 10.1016/j.tplants.2010.08.010. [DOI] [PubMed] [Google Scholar]
- 52.Vanholme R, Van Acker R, Boerjan W. Potential of Arabidopsis systems biology to advance the biofuel field. Trends Biotechnol. 2010;28:543–547. doi: 10.1016/j.tibtech.2010.07.008. [DOI] [PubMed] [Google Scholar]
- 53.Moreno-Risueno MA, Busch W, Benfey PN. Omics meet networks—using systems approaches to infer regulatory networks in plants. Curr Opin Plant Biol. 2010;13:126–131. doi: 10.1016/j.pbi.2009.11.005. [DOI] [PMC free article] [PubMed] [Google Scholar]
- 54.Petricka JJ, Benfey PN. Reconstructing regulatory network transitions. Trends Cell Biol. 2011;21:442–451. doi: 10.1016/j.tcb.2011.05.001. [DOI] [PMC free article] [PubMed] [Google Scholar]
- 55.Lee MM, Schiefelbein J. WEREWOLF, a MYB-related protein in Arabidopsis, is a position-dependent regulator of epidermal cell patterning. Cell. 1999;99:473–483. doi: 10.1016/s0092-8674(00)81536-6. [DOI] [PubMed] [Google Scholar]
- 56.Bonke M, Thitamadee S, Mähönen AP, Hauser MT, Helariutta Y. APL regulates vascular tissue identity in Arabidopsis. Nature. 2003;426:181–186. doi: 10.1038/nature02100. [DOI] [PubMed] [Google Scholar]
- 57.Nawy T, et al. Transcriptional profile of the Arabidopsis root quiescent center. Plant Cell. 2005;17:1908–1925. doi: 10.1105/tpc.105.031724. [DOI] [PMC free article] [PubMed] [Google Scholar]
- 58.Lee JY, et al. Transcriptional and posttranscriptional regulation of transcription factor expression in Arabidopsis roots. Proc Natl Acad Sci USA. 2006;103:6055–6060. doi: 10.1073/pnas.0510607103. [DOI] [PMC free article] [PubMed] [Google Scholar]
- 59.Brady SM, Song S, Dhugga KS, Rafalski JA, Benfey PN. Combining expression and comparative evolutionary analysis. The COBRA gene family. Plant Physiol. 2007b;143:172–187. doi: 10.1104/pp.106.087262. [DOI] [PMC free article] [PubMed] [Google Scholar]
- 60.Birnbaum K, et al. Cell type-specific expression profiling in plants via cell sorting of protoplasts from fluorescent reporter lines. Nat Methods. 2005;2:615–619. doi: 10.1038/nmeth0805-615. [DOI] [PubMed] [Google Scholar]
- 61.Deutsch EW, et al. A guided tour of the Trans-Proteomic Pipeline. Proteomics. 2010;10:1150–1159. doi: 10.1002/pmic.200900375. [DOI] [PMC free article] [PubMed] [Google Scholar]
- 62.Elias JE, Gygi SP. Target-decoy search strategy for increased confidence in large-scale protein identifications by mass spectrometry. Nat Methods. 2007;4:207–214. doi: 10.1038/nmeth1019. [DOI] [PubMed] [Google Scholar]
- 63.Elias JE, Gygi SP. Target-decoy search strategy for mass spectrometry-based proteomics. Methods Mol Biol. 2010;604:55–71. doi: 10.1007/978-1-60761-444-9_5. [DOI] [PMC free article] [PubMed] [Google Scholar]
- 64.Keller A, Nesvizhskii AI, Kolker E, Aebersold R. Empirical statistical model to estimate the accuracy of peptide identifications made by MS/MS and database search. Anal Chem. 2002;74:5383–5392. doi: 10.1021/ac025747h. [DOI] [PubMed] [Google Scholar]
- 65.Nesvizhskii AI, Aebersold R. Analysis, statistical validation and dissemination of large-scale proteomics datasets generated by tandem MS. Drug Discov Today. 2004;9:173–181. doi: 10.1016/S1359-6446(03)02978-7. [DOI] [PubMed] [Google Scholar]
- 66.Nesvizhskii AI. Protein identification by tandem mass spectrometry and sequence database searching. Methods Mol Biol. 2007;367:87–119. doi: 10.1385/1-59745-275-0:87. [DOI] [PubMed] [Google Scholar]
- 67.Saeed AI, et al. TM4: A free, open-source system for microarray data management and analysis. Biotechniques. 2003;34:374–378. doi: 10.2144/03342mt01. [DOI] [PubMed] [Google Scholar]
- 68.Saeed AI, et al. TM4 microarray software suite. Methods Enzymol. 2006;411:134–193. doi: 10.1016/S0076-6879(06)11009-5. [DOI] [PubMed] [Google Scholar]
- 69.Brady SM, et al. A high-resolution root spatiotemporal map reveals dominant expression patterns. Science. 2007a;318:801–806. doi: 10.1126/science.1146265. [DOI] [PubMed] [Google Scholar]
- 70.Orlando DA, Brady SM, Koch JD, Dinneny JR, Benfey PN. Manipulating large-scale Arabidopsis microarray expression data: identifying dominant expression patterns and biological process enrichment. Methods Mol Biol. 2009;553:57–77. doi: 10.1007/978-1-60327-563-7_4. [DOI] [PMC free article] [PubMed] [Google Scholar]
- 71.Stark C, et al. The BioGRID Interaction Database: 2011 update. Nucleic Acids Res. 2011;39(Database issue):D698–D704. doi: 10.1093/nar/gkq1116. [DOI] [PMC free article] [PubMed] [Google Scholar]
- 72.Levesque MP, et al. Whole-genome analysis of the SHORT-ROOT developmental pathway in Arabidopsis. PLoS Biol. 2006;4:e143. doi: 10.1371/journal.pbio.0040143. [DOI] [PMC free article] [PubMed] [Google Scholar]
- 73.Irizarry RA, et al. Exploration, normalization, and summaries of high density oligonucleotide array probe level data. Biostatistics. 2003a;4:249–264. doi: 10.1093/biostatistics/4.2.249. [DOI] [PubMed] [Google Scholar]
- 74.Irizarry RA, et al. Summaries of Affymetrix GeneChip probe level data. Nucleic Acids Res. 2003b;31:e15. doi: 10.1093/nar/gng015. [DOI] [PMC free article] [PubMed] [Google Scholar]
- 75.Bolstad BM, Irizarry RA, Astrand M, Speed TP. A comparison of normalization methods for high density oligonucleotide array data based on variance and bias. Bioinformatics. 2003;19:185–193. doi: 10.1093/bioinformatics/19.2.185. [DOI] [PubMed] [Google Scholar]
- 76.Weng L, et al. 2006. Discover biological features using composite images. United States Patent and Trademark Office application no. 20070211928 (November 13, 2006)
- 77.Meng F, et al. Quantitative analysis of complex peptide mixtures using FTMS and differential mass spectrometry. J Am Soc Mass Spectrom. 2007;18:226–233. doi: 10.1016/j.jasms.2006.09.014. [DOI] [PubMed] [Google Scholar]
- 78.Lee AY, et al. Quantitative analysis of histone deacetylase-1 selective histone modifications by differential mass spectrometry. J Proteome Res. 2008;7:5177–5186. doi: 10.1021/pr800510p. [DOI] [PubMed] [Google Scholar]
- 79.Neubert H, et al. Label-free detection of differential protein expression by LC/MALDI mass spectrometry. J Proteome Res. 2008;7:2270–2279. doi: 10.1021/pr700705u. [DOI] [PubMed] [Google Scholar]
- 80.Chan EY, et al. Dynamic host energetics and cytoskeletal proteomes in human immunodeficiency virus type 1-infected human primary CD4 cells: analysis by multiplexed label-free mass spectrometry. J Virol. 2009;83:9283–9295. doi: 10.1128/JVI.00814-09. [DOI] [PMC free article] [PubMed] [Google Scholar]
- 81.Lomenick B, et al. Target identification using drug affinity responsive target stability (DARTS) Proc Natl Acad Sci USA. 2009;106:21984–21989. doi: 10.1073/pnas.0910040106. [DOI] [PMC free article] [PubMed] [Google Scholar]
- 82.Nittis T, et al. Revealing novel telomere proteins using in vivo cross-linking, tandem affinity purification, and label-free quantitative LC-FTICR-MS. Mol Cell Proteomics. 2010;9:1144–1156. doi: 10.1074/mcp.M900490-MCP200. [DOI] [PMC free article] [PubMed] [Google Scholar]
- 83.Paweletz CP, et al. Application of an end-to-end biomarker discovery platform to identify target engagement markers in cerebrospinal fluid by high resolution differential mass spectrometry. J Proteome Res. 2010;9:1392–1401. doi: 10.1021/pr900925d. [DOI] [PubMed] [Google Scholar]
- 84.Sietsema KE, et al. Potential biomarkers of muscle injury after eccentric exercise. Biomarkers. 2010;15:249–258. doi: 10.3109/13547500903502802. [DOI] [PubMed] [Google Scholar]
- 85.Nesvizhskii AI, Keller A, Kolker E, Aebersold R. A statistical model for identifying proteins by tandem mass spectrometry. Anal Chem. 2003;75:4646–4658. doi: 10.1021/ac0341261. [DOI] [PubMed] [Google Scholar]
Associated Data
This section collects any data citations, data availability statements, or supplementary materials included in this article.