Abstract
An array of chemical modifications have recently emerged, designed to improve the stability of natural peptides that inherently suffer from short in vivo half-lives, thereby preventing their use as therapeutics. The resultant peptidomimetics resemble native peptides; however, they contain synthetic elements (e.g. non-coded amino acids) which confer improved biophysical properties. An elegant approach towards the identification of peptidomimetics is through screening of large combinatorial chemical libraries incorporating both coded and non-coded amino acids (e.g. β amino acids). We apply here our recently developed Integrated Chemical Biophysics (ICB) platform, which combines microscale one-bead one-compound screening with fluorescence tagging of retrieved hit beads and subsequent affinity determination of hit compounds in homogenous solution, to the task of identifying novel mixed α, β peptidomimetic binders for the adaptor protein SLAM-associated protein (SAP), which acts as an intracellular adapter that transduces T and NK cell activation. An enhancement to the ICB process is introduced which enables ranking hit compounds from single-point measurements even if the library compound is <95% pure and without HPLC purification of single-bead-derived substance. Finally, a novel computational protocol enabling binding mode and SAR rationalisation of hit compounds is also described which we now utilise to inform future library design. Application of the full ICB process has allowed identification of a highly interesting motif, Ac-β3-Pro-α-pTyr, as a mimic for the −1 and −2 positions of the natural binding motif and provides a promising starting point for further optimization towards higher-affinity SAP inhibitors with enhanced metabolic stability.
Electronic supplementary material
The online version of this article (doi:10.1007/s12154-011-0071-9) contains supplementary material, which is available to authorized users.
Keywords: Screening, One-bead one-compound, SAP, Peptidomimetics, Docking
Introduction
The market for synthetic peptide therapeutics, not including natural peptides, has risen from €5.3 billion in 2003 to €8 billion in 2005 with an estimated potential to recoup €11.5 billion by 2013 [1]. Their adoption for use as therapeutics has been slow to progress in recent years due to several well-characterised limitations of inherent physiochemical and pharmacokinetic profiles. Peptides for use as therapeutics generally suffer from low oral bioavailability, short half-lives due to rapid proteolytic degradation, rapid hepatic and renal clearance, low ability to cross physiological barriers (e.g. intestinal mucosa, lumen and blood–brain barrier) due to hydrophilicity and high synthetic and production costs. Recent years have seen the advent of a plethora of strategies to overcome these limitations, generally through chemical modifications to produce peptidomimetics or peptide mimics. The incorporation of non-coded amino acids and backbone modifications into peptides, for example, renders the peptide more proteolytically stable and can significantly alter its molecular properties.
Therefore, methods to design and identify peptidomimetics for unordered or ‘linear’ peptide stretches are of high interest. Since the introduction of beta peptides by Seebach et al. [21], their propensity to fold into stable secondary structures has been successfully used to mimic secondary structures, such as helices [6, 7, 9, 20, 22], sheets [19] or turns [23]. Furthermore, beta peptides show a remarkable metabolic stability making them attractive candidates for peptidomimetic design. Their slightly increased hydrophobicity might also prove advantageous for increased circulation time and cell delivery.
With this in mind, we endeavoured to identify ‘linear’ peptide mimetics stabilized by beta amino acids, which would inhibit the interaction of the immunoglobulin-type receptor SLAM with its SH2 domain partner—adaptor protein SLAM-associated protein (SAP). The importance of the SAP/SLAM pathway is highlighted by the finding that the SAP (SH2D1A) gene, located on the X chromosome, is mutated in human immunodeficiency X-linked lymphoproliferative disease, characterised by higher susceptibility to Epstein–Barr virus infection [5]. SAP also has been demonstrated to be a key player in the induction of numerous autoimmune diseases such as lupus erythematosus. SAP-deficient mice are fully resistant to lupus induced by pristine [11]. SAP-deficient mice bear marked immune phenotypes. Firstly, altered B cell responses to viruses and parasites have been observed as a result of reduced production of specific antibodies due to CD4+ T cell dysfunction [17]. Secondly, in SAP-deficient mice, CD8+ T cell proliferation is enhanced in tandem with cytokine secretion [1] whereas a reduction in activation-induced cell death is observed. Importantly, NK T cells have been shown to be almost absent in SAP knockout mice [2], and Dong et al. [4] have noted reduced levels of IFN-γ secretion and cytotoxicity in NK cells. Thus, evidence assembled to date from SAP-deficient mouse models has established the SAP–SLAM signalling axis as a major immune regulatory unit of high potential for drug discovery. However, SH2 domains have historically been classified as undruggable, and attempts to design potent, metabolically stable and cell-permeable small molecules for SH2 domains have not been successful so far. Unique to SAP also is its intrinsic ability to bind SLAM in a phosphorylation-dependent and independent manner. This is very unusual as deletion of this phosphorylated tyrosine (pTyr) in receptors or recognition peptides usually results in a loss of binding to SH2 domains [15]. In total, approximately 120 SH2 domains have been identified within the human genome, and the peptide-binding specificity for many of these domains has been investigated [13]. These specific protein–protein interactions occur through phosphotyrosine (pTyr)-based signalling motifs located in the cytoplasmic tail of many signalling receptors. Moreover, the classical ‘two-pronged’ interaction motif common to all SH2 domains is not present in SAP, which relies on a ‘three-pronged’ motif, with additional interactions being made by the two N-terminal residues immediately following the central pTyr [12].
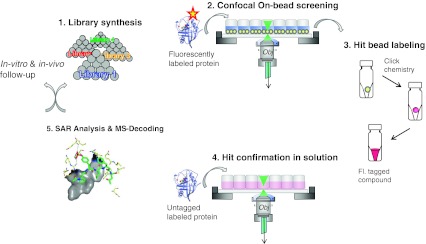
We use our previously described screening methodology—Integrated Chemical Biophysics (ICB) [10] which combines on-bead screening and seamless hit confirmation in homogeneous solution (Fig. 1), to screen a large combinatorial mixed α, β phosphopeptide library for SH2 domain binders of this difficult target—SAP. Importantly, ICB addresses the significant cost issues associated with peptide synthesis and optimisation simultaneously by enabling combinatorial synthesis and screening in picomolar scale. To increase the general utility of this platform, we also present two significant enhancements. Firstly, we have refined our 2D-fluorescence intensity distribution analysis (FIDA) anisotropy-based solution confirmation methodology to allow accurate ranking of hit compounds resulting from libraries with less than 95% purity. Secondly, we describe a novel computational method that enables rationalisation of the binding modes of the most promising compounds. Extension of the integration of computation in this platform technology will enable prior assessment of interactions of all libraries with potential targets so that library design will be more focused.
Fig. 1.
Simplistic overview of the main elements of the ICB screening process. The ICB screening process combines on-bead screening with direct hit confirmation in homogeneous solution of fluorescently tagged hit compounds and molecular modelling as well as further in vitro and in vivo follow-up studies
Application of our enhanced ICB platform has permitted identification of a highly interesting Ac-β3-Pro-α-pTyr motif as a mimic for the −1 and −2 positions of the natural binding motif. The results indicate a promising starting point for further optimization towards small high-affinity SAP inhibitors.
Results
Design and synthesis of one-bead one-compound libraries of mixed α/β-phosphopeptides
SH2 domains generally recognize short peptide stretches containing a central phosphotyrosine and some additional residues C- and N-terminally thereof (Table 1) [3]. Despite their common phosphotyrosine recognition motif, the actual 3D orientation, folding and interaction patterns of specific SH2 domain ligands in their respective binding site can vary considerably. The entire replacement of alpha amino acids by ß-amino acids would, in the majority of complexes, simply lead to a misalignment between pocket and ß-peptide ligand side chains and to a loss of affinity. Our strategy for designing a first set of ß-peptidic libraries to mimic natural phosphotyrosine ligands therefore relied on a combination of ‘conserving’ important binding features and utilising possible additional interactions not ‘reachable’ by α peptides.
Table 1.
Sequence preferences of some selected SH2 domains N-terminal (−3, −2, −1) and C-terminal (+1, +2, +3) of the phosphotyrosine, according to the literature (Machida and Mayer [16]; Sheinerman, Al-Lazikani and Honig [24]) [25, 26]
| Protein | –3 | –2 | –1 | 0 | 1 | 2 | 3 |
|---|---|---|---|---|---|---|---|
| Grb2 | ? | ? | X | pY | X | N | X |
| SAP | X | T/S | I | (p)Y | X | X | V/I |
| Lck | ? | ? | ? | pY | E | E | I |
| Zap70 | ? | ? | X | pY | E | X | L |
| EAT2 | X | T | V/Y/F | pY | X | X | V |
Strong preferences are shown in bold type; ? represents a position not investigated, and X denotes that no clear preferences have been derived from previous experiments
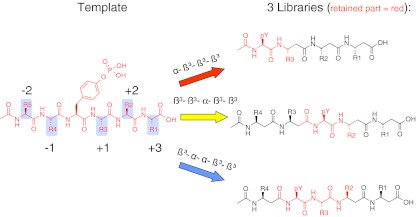
For SAP, Poy et al. have measured a dissociation constant of 650 nM for the non-phosphorylated SLAM peptide. The phosphorylated variant showed a fivefold tighter binding with a Kd of 120 nM [18]. We therefore decided to retain the phosphorylated tyrosine in our library designs (Fig. 2). To retain varying parts of the original α-peptide template, three libraries (red, blue and yellow) were designed. The use of the alpha-phosphotyrosine residue in each library provides a common anchor point. When L-β³ amino acids are incorporated, the first residue C-terminally to an alpha amino acid will retain its side chain position as compared to the natural sequence. The first of the three libraries (red) ‘Ac-pTyr-β3aa3-β3aa2-β3aa1-OH’ contains three beta amino acids C-terminally to the phosphotyrosine. The second library (yellow) ‘Ac-β3aa4-β3aa3-pTyr-β3aa2-β3aa1-OH’ extends to both sides. The third library (blue) ‘Ac-β3aa4-pTyr-αaa3-β3aa2-β3aa1-OH’ retains an additional alpha amino acid C-terminally to the phosphotyrosine and lacks the N-terminal beta amino acid in comparison to the second library.
Fig. 2.
Design of beta amino acid containing phosphotyrosine libraries. SH2 domains recognize several residues adjacent to a central phosphorylated tyrosine. To mimic this common recognition motif, three libraries were designed containing mixed alpha–beta peptides. Each of the three libraries (colour coded as red, yellow and blue) is designed to mimic a different part of the original alpha-peptidic SH2 binding motif
The three libraries were synthesised according to a split–mix procedure with a division into sublibraries only after the last combinatorial position. With 15 amino acid building blocks in each combinatorial position (all natural side chains, except Met, Gly, Cys, Leu, His), this led to 15 sublibraries per library and to a total of 104,625 theoretical ligand structures.
On-bead screen of Cy5-labelled SAP by confocal nanoscanning
The on-bead screens of the mixed αβ phosphopeptide libraries were carried out following previously described procedures [8]. Briefly, confocal nanoscanning, CONA, is a fully automated and quantitative on-bead screening process. Confocal images, recorded during scanning of monolayers of beads below their equatorial plane in each well of a 96-well plate, are analysed to detect the binding of a fluorescently labelled target protein to bead-immobilized ligands. The high-resolution data allow discriminating target protein-binding events on the surface of the beads from auto-fluorescence which is associated with the entire bead volume.
Primary on-bead screening with Cy5-labelled SAP at a concentration of 5 nM in a gelatine and bovine serum albumin (BSA)-containing blocking buffer produced a total of 253 hit beads. These beads were assigned as primary hits based on the detection of a fluorescence ‘ring’ intensity of at least fourfold over the interior fluorescence intensity (background) of the beads within the outer 5 μm averaged in the CONA scan (for a more detailed description of hit bead ranking, see supporting information, Figure S9). This corresponds to an overall hit rate of 0.17% within the 75 wells of the screening plate based on an average number of 2,000 beads per well (for a layout of the screening plate and a table of hit beads, see Fig. S1 and Tables S1 and S2 in the supporting information).
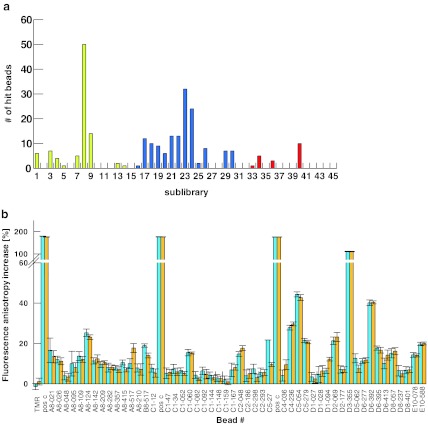
The three libraries responded significantly differently to Cy5-SAP binding (Fig. 3a). The shorter tetrapeptide library (red) produced the lowest number of hit beads. The library containing the α-amino acid in the +1 position (blue) overall produced the highest number of hits. Interestingly, sublibrary 8 of library Ac-β3aa4-β3aa3-pTyr-β3aa2-β3aa1-OH (yellow) which contains a β3-arginine in position R4 contained the highest number of hits among all sublibraries.
Fig. 3.
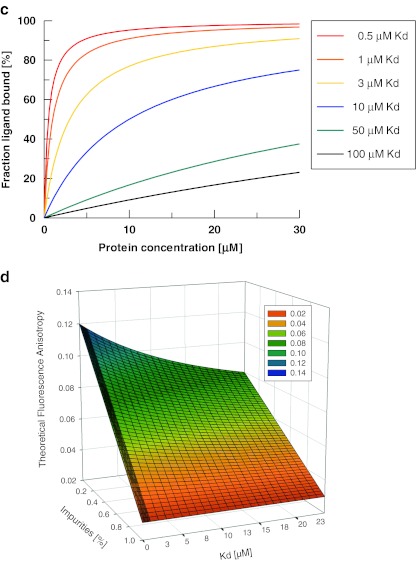
a Distribution of hit beads per sublibrary. The three different libraries are colour coded. b 2D-FIDA anisotropy data for single-point measurements of hit compounds after addition of 16 μM SAP-SH2. For assessing the activity of a compound in the off-bead confirmation assay with 2D-FIDA and FCS analysis, the starting anisotropy/translational diffusion time of the compound and the relative signal change upon protein addition are the relevant parameters. Single-point solution measurements (2D-FIDA anisotropy) were performed with samples derived from all picked hit beads from the Cy5-SAP screen. The cleaved compound fractions were diluted 1:500, incubated with SAP in a 384-well microtitre plate and measured on the PS02 instrument (assay volume, 7 μl; 12 × 12-s measurement time). A literature-described α-peptidic SAP binder, used in HPLC-purified form, served as positive control (denoted pos c). c Simulation of fraction ligand bound vs. protein concentration for different Kd values. A simulation of the fraction of protein-bound ligand as a function of protein concentration at different Kd values was generated with a 1:1 binding model, using the software package GraFit 5.1 (Erithacus software). d 3D plot showing theoretical anisotropy values as a function of purity and dissociation constant of the observed ligand. Anisotropy values were calculated as the sum of fractional contributions from the complex, the unbound compound and the impurities, according to Eq. 5. The simulation was carried out for 24 μM protein and 1 nM compound concentration, assuming compound starting anisotropies of 0.04, complex anisotropies of 0.12 and the average anisotropies of the impurities to be 0.03
Hit analysis and bead picking
Based on the distribution of hit beads and the analysis of the fluorescence intensity of bead-bound Cy5-SAP within the sublibraries, a total of 48 beads from 13 wells were isolated using the bead-picking device on the PS04 instrument [8]. All retrieved hit beads were placed into separate glass vials for subsequent fluorescence labelling. A list of all picked hit beads with the corresponding ring intensities is given in Table S3 (supporting information).
PS/PS labelling and confirmation of binding affinity of cleaved TMR-labelled hit compounds to SAP in solution
All 48 picked hit beads were successfully derivatised by PS/PS labelling with TMR-azide (TMR-N3) following a recently published procedure [10]. The hit compounds were then measured for their affinity to unlabelled SAP in a fluorescence fluctuation analysis assay at single molecule resolution (2D-FIDA anisotropy, Fig. 3b and Fig. S2, supporting information). After cleavage from the resin, the compounds derived from single-hit beads were dissolved in 20 μl of acetonitrile (20% v/v) in water and diluted 1:500 to reach appropriate concentrations for 2D-FIDA measurements. The α-peptide Ac-Thr-Ile-Tyr(PO3H2)-Ala-Gln-Ile-NH(CH2CH2O)2CH2CH2CONHCH2CH2CO-Pra(TMR)-OH, which corresponds to the consensus motif for SAP binding described in the literature [25, 26], was synthesised, PS/PS labelled and HPLC purified and served as positive control for protein integrity in this measurement series (pos c; Fig. 3b). For the 2D-FIDA anisotropy measurements, a SAP protein concentration of 16 μM was used. Under these conditions, hit compounds with dissociation constants in the nanomolar range will be bound to SAP in saturation (Fig. 3c). Compounds with dissociation constants up to 100 μM will be detectable based on the simulation of the 1:1 binding equilibrium. The experiments showed, however, that SAP binding to the hit-bead-derived compounds resulted in relatively small 2D-FIDA anisotropy signal increases (Fig. 3b). A titration of TMR-N3 with SAP performed as control experiment did not result in any significant anisotropy increase, indicating that unspecific protein-binding effects of TMR were negligible. Therefore, hit compounds producing more than 10% relative anisotropy signal increase, 22 out of the 50 primary on-bead hits, were classified as ‘active’ in this assay. This corresponds to a hit confirmation rate of 44%.
The unexpectedly small anisotropy enhancements detected in the single-point measurements of hit compound solutions can be due to either low binding affinities to SAP or due to the presence of non-binding impurities in the unpurified sample cleaved from single beads. As demonstrated previously [10], this can in principle be overcome by HPLC purifying the substances from individual hit beads preceding fluorescence anisotropy binding measurements. Ideally, an effective bead-based screening process should work without purification steps prior to single-point binding confirmations in homogeneous solution. Therefore, an alternative method which allows detecting the best binders from only single-point measurements despite the presence of impurities is needed.
We first considered a pure sample situation (Fig. 3c): If the fluorescence intensity stays constant during a complex formation reaction, the anisotropy increase is linearly proportional to the fraction of bound ligand. The anisotropy fit is usually performed using Eq. 1 with parameter a representing the fraction of bound ligand. Parameter a is usually derived from Eq. 2 which represents the solution of the quadratic equation (ES-1, supporting information) describing the fraction of a 1:1 protein–ligand complex at equilibrium as a function of total protein concentration and dissociation constant Kd.
 |
1 |
 |
2 |
with
 |
3 |
 |
4 |
where min and max are the starting and end values of the average steady-state parameter, Q is the quenching factor and qbound and qfree are molecular brightnesses of the labelled ligand in the bound and free states. For FIDA measurements, molecular brightnesses are obtained for each polarization channel, and the molecular brightness values of q can be calculated directly by q = q|| + 2x q⊥. For FCS measurements, a possible quenching factor can be derived from the total intensities.
Impurities arise from incomplete reactions on the solid support or from remaining traces of free unreacted dye, carried over from the PS/PS-labelling step. Therefore, these impurities will consist of smaller fragments of the final synthesis product with anisotropy values similar to or smaller than the final compound. Synthesis side products will generally bind with lower affinity to the target protein as compared to the finalized screening compound. This results in reduced anisotropy values.
A sample containing a certain percentage of impurities, xi, will therefore consist of three molecular species during the binding reaction: final synthesis products with anisotropy rstart, protein–compound complexes with anisotropy rmax and impurities with anisotropy ri. Using these assumptions, the theoretical anisotropy values for any point of the binding curve can be calculated as the sum of all individual contributions to the overall signal, according to Eq. 5.
 |
5 |
rs, rc and rI being the starting anisotropy (∼0.04 for the phosphopeptides), the end anisotropy of the complex (∼0.12) and the average anisotropy of the impurities (∼0.03); a is the fraction of total PS/PS-labelled material bound to the protein (i.e. the fraction ligand bound, normalised to the total amount of labelled material) and x is the fraction of impurities.
However, the presence of impurities has also to be taken into account in Eq. 2, as the fraction of bound ligand, relative to all labelled molecules in the sample, is reduced within the sample. This alters the mass balances and the quadratic equation for 1:1 binding to:
 |
6 |
 |
7 |
 |
8 |
L0 and R0 being the total amount of PS/PS-labelled material and the protein concentration, [LR] is the concentration of complex formed and x is the amount of impurities in percent of total labelled material.
A 3D plot showing theoretical anisotropy values on the z-axis was generated based on Eqs. 5 and 8 (Fig. 3d). Kd values from 1 nM to 24 μM for a protein–compound complex formation are shown on the x-axis. Compound purities from 0% to 100% were plotted on the y-axis. The overall protein concentration was set to 24 μM. This plot demonstrates how the detected anisotropy signals resulting from single-point measurements vary with compound–protein affinity and compound purities.
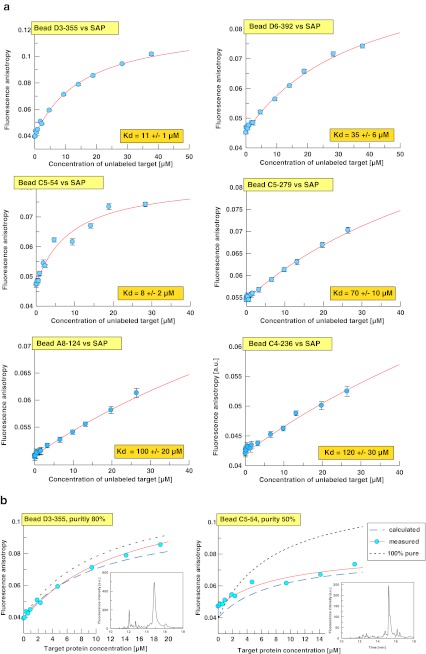
Based on these simulations of theoretical anisotropy values, a binder with an affinity (Kd) of 10 μM and a purity of 40% should still lead to an anisotropy increase of ∼30–35% upon 16-μM SAP protein addition. Based on these criteria, a total of seven single bead cleaved compounds, A8-124, D3-355, C5-054, D6-392, C4-236, D2-069 and C5-279, were selected for full titration experiments to determine their affinity to SAP (Fig. 4a). The titration experiments with the seven selected compounds were carried out on the PS02 instrument using 2D-FIDA anisotropy settings. The results of the titrations of hit compounds with unlabelled protein revealed that six compounds were bound to SAP with hyperbolic titration curves. Fitting of the 2D-FIDA anisotropy data to the quadratic equation describing a 1:1 protein ligand complex formation at equilibrium as function of the Kd and of the total target protein concentration yielded Kd values from 8 ± 2 μM for bead C5-54 to 120 ± 30 μM for bead C4-236. The maximum total SAP protein concentration used in the titration experiments was 38 μM. Therefore, the lower Kd values (up to 40 μM) are well defined by the fitting procedure. The uncertainties in the fitted saturation levels of the lower affinity curves also led to increased standard deviations of the determined Kd values. Therefore, for compounds C5-279, A8-124 and C4-236, the dissociation constants were fitted with fixed anisotropy saturation values of re = 0.12. The confidence intervals of the fitted Kd values were derived using a small series of saturation anisotropies fixed in between re = 0.1 and 0.13.
Fig. 4.
a Titration curves for selected TMR-derivatized SAP hit compounds. TMR-conjugated hit compounds selected after single-point confirmation measurements with SAP were titrated with unlabelled SAP using a low-volume 384-well plate (assay volume, 7 μl). Confocal fluorescence fluctuation spectroscopy data were recorded on the PS02 instrument and analysed with the FIDA Analyze software (Evotec, Hamburg, Germany). Non-linear curve fits based on Eqs. 1 to 4 yielded the Kd values indicated in the orange inserts. The Kd values for beads C5-279, A8-124 and C4-236 were derived from a one-component fit with the end anisotropy fixed to 0.12. b Comparison of predicted and measured anisotropy-based target (SAP)-binding curves of non-purified hit compounds cleaved from single-hit beads. The target binding curves were simulated by calculating the expected anisotropy values corresponding to percent SAP complex formation between TMR-conjugated primary hit compounds in the presence of non-binding impurities based on Eq. 5. The percent complex formation at a given target concentration and for a specific Kd value was calculated based on Eq. 8. The Kd values needed as input were taken from the 2D-FIDA anisotropy titrations (Kd = 11 μM for bead D3-355, 8 μM for bead C5-54). For all other parameters needed in Eq. 5, the same settings as for the non-linear curve fits in Fig. 3d were used (i.e. starting anisotropies of hit compounds rs = 0.04, starting anisotropies of impurities rI = 0.03, end anisotropies of the ligand–receptor complex rc = 0.12). For the fraction of non-binding impurities, the values obtained by HPLC analysis were used as indicated. The corresponding HPLC chromatograms of the single-bead cleaved samples are shown as inserts. Fluorescence detection at 555 nm excitation and 575 nm emission was used. For sample C5-54, which turned out to be only 50% pure, the main component of impurities arises from a second compound very close to the main HPLC peak, indicated by the non-symmetrical peak shape. For comparison, the binding curves for 100% pure samples with identical affinities were calculated (based on Eqs. 1 to 4). Red line non-linear curve fit of the experimental data, blue dashed line binding curve, predicted by Eq. 5, black, dotted line predicted binding curve for a 100% pure sample of the same affinity
Comparison of predicted and measured anisotropy values for unpurified, single-bead-derived compound fractions
HPLC analyses of all titrated hit compound samples were performed to assess their purities. Purities ranged from 80% for compound D3-355 to 32% for compound D2-069. The latter did not produce a fittable binding curve in the 2D-FIDA assay. The purity information derived from the HPLC runs was then used to verify the validity of the anisotropy prediction model for single bead cleaved, and not further purified compounds as described above (Eq. 5). An overlay plot of the calculated titration curve (dashed blue line, Fig. 4b) with the fit curve of the measured data (red line, Fig. 4b) revealed excellent agreement between simulation and experiment (two exemplary hit beads, beads D3-355 and C5-54, are shown; Fig. 4b).
Decoding and re-synthesis of SAP hits
All six samples which were shown to bind to SAP were analysed by matrix-assisted laser desorption/ionization mass spectrometry (MALDI-MS) and tandem mass spectrometry (MS/MS) measurements. With the exception of compound C4-236, candidate structures were assigned to all samples (Table S4, supporting information). Compound C4-236 produced an MS spectrum of very low intensity which was not interpretable. Also, due to the low affinity of compound A8-124 for SAP, no follow-up experiments were carried out with this compound. The nine remaining candidate structures were re-synthesised on TentaGel beads with chemical procedures identical to those used for the screening library (Table S5 supporting information).
On-bead confirmation of re-synthesised SAP hit compounds
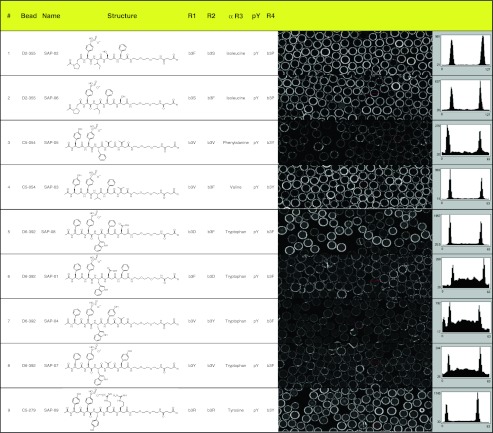
To identify the correct hits among the compounds with either isobaric masses or alternative candidate structures, all re-synthesised ligands were first tested for on-bead binding by confocal nanoscanning. The scanned area of 6.2 × 0.8 mm on the PS02 instrument contains approximately 300 beads. Five out of the nine re-synthesised compounds (SAP-02, SAP-03, SAP-06, SAP-08, SAP-09) exhibited clear on-bead binding to Cy5-labelled SAP (Fig. 5).
Fig. 5.
On-bead confirmation of re-synthesised SAP hit compounds. The structures depicted in the fourth column comprise the peptide sequence and the ADO spacer. The propargylglycine is not shown. R in the chemical drawings indicates the propargylglycine and the linkage to the bead via the HMBA linker. R1 to R4 are the combinatorial positions and denote the respective building blocks as one-letter code for beta 3 homo amino acids or the full name for alpha amino acids. The scan images show representative sections from the whole scan area (6.2 × 0.8 mm); a typical intensity profile is drawn to the right of each scan image
Both re-synthesised candidate structures resulting from one primary hit bead were confirmed as SAP binders on bead (Fig. 5; SAP-02 and SAP-06 are both possible decodes for D2-355). At least one of the candidate structures, F of the four remaining primary hit beads, exhibited Cy5-SAP binding on bead.
Validation of the binding affinity of the confirmed single-bead-derived, decoded and re-synthesised hit compounds to SAP in solution
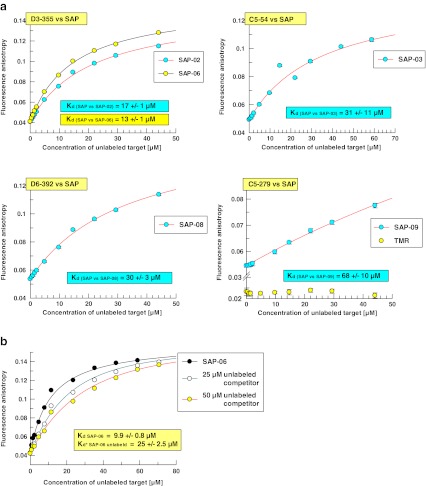
The five re-synthesised hit compounds which had confirmed as on-bead binders to SAP were fluorescently tagged via PS/PS labelling, cleaved from the solid support and purified by HPLC chromatography. To validate the affinities which had been determined for the single-bead-derived compound fractions, the purified compounds were titrated with SAP using 2D-FIDA anisotropy detection (Fig. 6a).
Fig. 6.
a Confirmation of SAP binding of re-synthesised hit compounds in homogenous solution. From the list of re-synthesised SAP hits, five compounds which had shown positive on-bead binding results were titrated with unlabelled SAP using identical settings as for experiments shown in Fig. 4a. Data from compounds derived from the same original hit beads are plotted together into one graph, i.e. compounds SAP-02 and SAP-06 represent two decoding suggestions from one-hit bead. b Competition binding of PS/PS-labelled and unlabelled compound SAP-06. 2D-FIDA anisotropy data for binding of PS/PS-labelled compound SAP-06-TMR to SAP were recorded in the presence of increasing concentrations of non-labelled SAP-06. The individual Kd values were 25 ± 2.5 μM (at 25 μM competitor) and 20 ± 2.4 μM (at 50 μM competitor)
The two candidate structures for bead D3-355, SAP-02 and SAP-06 yielded very close affinities for SAP with Kd values of 17 ± 1 and 13 ± 1 μM, respectively. The close match of the Kd value determined for SAP-06 with the originally determined Kd of 11 ± 1 μM suggests that the SAP-06 structure corresponds to the original hit. The re-synthesised compound SAP-03, which corresponds to the hit bead C5-054, exhibited a lower affinity compared to the single-bead-derived sample.
Competition between labelled and unlabelled SAP hit compounds in a homogeneous solution
It is of critical importance to assess the influence of the label on the affinity of the hit compounds identified in the on-bead screening and PS/PS-labelling processes. For the most potent compound within the series of fluorescently tagged re-synthesised SAP hits, SAP-06, the affinity of the unlabelled compound was determined. A competition titration of labelled SAP-06 in presence of an excess of unlabelled ligand SAP-06 was performed by 2D-FIDA anisotropy detection on the PS02 instrument. The solubility of unlabelled SAP-06 in aqueous buffer limits the experimentally achievable competitor concentration to 50 μM. Non-linear curve fitting of the obtained binding data using the algebraic exact solution for a 1:1:1 fit model as function of the total SAP concentration resulted in a Kd of 25 μM for the unlabelled phospho-β-peptide SAP-06 (Fig. 6b).
Computational analysis of on-bead screening hits for Cy5-SAP
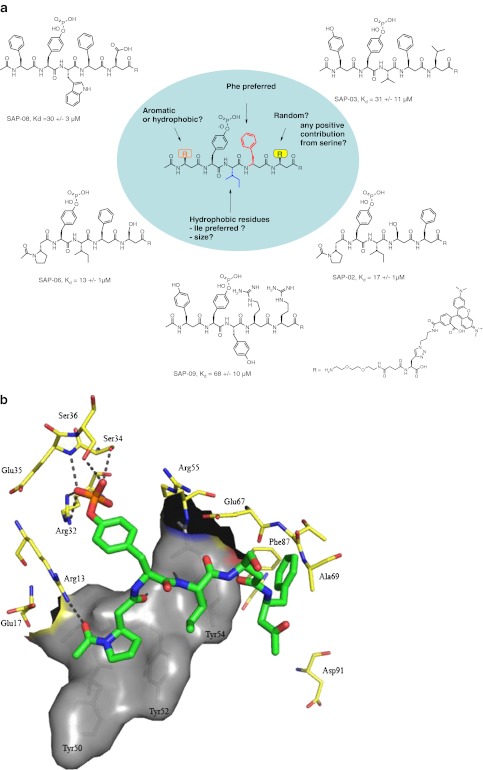
The ICB screen of the three mixed α, β-phosphopeptide libraries with SAP as target protein resulted in the identification of SAP-06 as the compound with the highest affinity together with the following SAR information (Fig. 7): a hydrophobic residue (preferably isoleucine) on position +1 in combination with an aromatic residue on position +2 seems to be beneficial for binding. Furthermore, a proline residue on position −1 was identified as a second promising element for SAP binding. As a basis for the design of a next-generation library with increased potential to deliver high-affinity SAP compounds, we undertook a pharmacophore study to draw more detailed conclusions about the binding mode of the hit compounds. To probe the critical interactions made by the hit series, a novel computational methodology was developed utilising information from both ligand and protein. Autoligand (MGLTools, part of the AutoDock software package) was employed to derive information about the size, shape and atom type placement of an optimal ligand within the SAP–SLAM SH2 domain binding site using the crystal structures of SAP with the phosphorylated and the non-phosphorylated SLAM interaction motif as basis. This analysis resulted in optimal fill volumes (Fig. S3, supporting information) which were used as input for Openeye Scientific Software (vROCS) to enable the creation of a receptor-based pharmacophore.
Fig. 7.
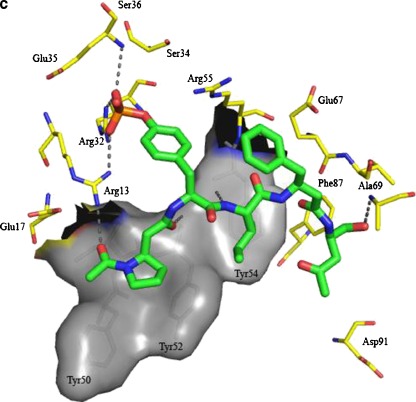
a Structure activity relationship of SAP-binding hit compounds identified from screening of the three phosphotyrosine libraries. b Binding site residues and critical interactions as predicted for SAP-02 and SAP SH2 binding domain from virtual docking. The crucial interactions of the pTyr residue with Arg32 and Ser34 are shown along with the beta3-proline occupying the −1 and −2 positions of the natural alpha-peptide ligand. Beta3-proline is also predicted to interact with Arg 13. c Binding site residues and critical interactions as predicted for SAP-06 and SAP SH2 binding domain from virtual docking. The overall positioning of the ligand is very similar to SAP-02. Also, the same positioning for beta3-proline and its interaction with Arg13 are predicted for that ligand
Defining all critical hydrogen-bonding interactions between SLAM and SAP and merging this information with our receptor-based pharmacophore allowed us to generate a hybrid shape and feature-based pharmacophore (Fig. S4, supporting information). This pharmacophore now incorporated not only those features found crucial for SLAM peptide binding but also contained information for the placement of additional donor, acceptor or hydrophobic atoms which could enhance the affinity of any new ligand. For all experimentally validated hit compounds, starting from 2D structures, 3D conformers were generated using the program OMEGAv2.4.1 (Openeye Scientific Software). All conformers were subsequently screened against the hybrid pharmacophore derived from vROCS to pre-select valid ligand binding poses that were passed on to a final fully flexible docking routine using RosettaLigand. Single-point energies were calculated for the top scoring solutions generated by RosettaLigand using Szybki v1.5.1 (Openeye Scientific Software). Szybki uses a Poisson–Boltzmann protein–ligand electrostatic model to calculate protein–ligand interaction energies containing solvent screening and desolvation (Table S6, supplementary information).
The output of this protocol is illustrated in Fig. 7b and c for the two most active compounds (SAP-06 and SAP-02). To validate our in silico method, the original SLAM phosphopeptide was also put through the described protocol (Fig. S5, supplementary information). Using this protocol, the correct binding pose was obtained for the SLAM phosphopeptide, showing H bonding from the backbone of the phosphorylated peptide to Ile51, Glu67, Ala69 and Gly93 of SAP in conjunction with side-chain H bonding to Glu67 and Glu17 and hydrophobic interactions with the triad of Tyr50, Tyr52 and Tyr54.
For the two highest-affinity hit compounds SAP-06 and SAP-02, (l)-β3-proline occupies a groove formed by Tyr52 and Tyr50 equivalent to positions −1 and −2 of SLAM, respectively. This leads to a new interaction with Arg13 as compared to the natural alpha-peptide which instead interacts with Glu17. pTyr in SAP-06 and SAP-02 makes a series of H-bonding contacts similar to those observed with the natural ligand. In SAP-06, the phosphate group is shifted to enable an additional interaction with Arg13. Furthermore, isoleucine at position +1 in SAP02 and SAP06 is well positioned above Tyr54 of SAP and makes large stabilizing hydrophobic contacts. H-bonding backbone interactions are observed with Tyr52 and Tyr54. The introduction of (l)-β3-proline in SAP06 and SAP02 shortens the newly identified ligands by one amino acid which may lead to more optimal physiochemical characteristics. Noteworthily, incorporation of β-amino acids after +1 appears to prevent backbone H bonding with Glu67 and Ala69. The highest-affinity compound, SAP-06, differs from the slightly less potent compound SAP-02 only by the mutual exchange of R1 and R2 whereby H bonding to Ala69 is replaced with п stacking perpendicular to Phe87. Promisingly, scores obtained with our protocol followed the correct rank order of binding affinities obtained experimentally and also distinguished clearly between high- or low-affinity binding ligands.
Discussion
We have previously applied our ICB platform successfully for the identification of novel mixed α, β-peptide binders of the SH2 domain of the adaptor protein Grb-2 [10]. The progression from an SH2 domain comprising a two-pronged motif to the three-pronged motif of SAP provided us with additional interaction possibilities for ligands containing one or more beta amino acids. In addition, to our knowledge, no small molecule ligands have been described for SAP so far.
The ICB screening process comprises a combination of primary screening on bead, using one-bead one-compound libraries, and seamless confirmation of single-bead labelled and cleaved compounds in homogeneous solution. This allows identifying the highest-affinity compounds from large libraries by direct Kd determination in solution without time-consuming and resource-intensive re-synthesis of on-bead hits.
The compound archive for on-bead screens is combinatorial libraries built using split-and-mix procedures. Inherent to the fast and cheap OBOC libraries, synthesis is a certain limitation in purity of the library substances. Only the individual chemical reagents used as building blocks can be tested before a library is produced. The purity of library compounds can vary and is only revealed after cleavage of the compound from beads. Although our recently developed post-synthesis/post-screening labelling process resolves the need for re-synthesis of on-bead screening hit compound prior to quantitative solution validation, the possible variations in compound purity make it necessary to either purify single-bead-derived compounds before affinity measurement or run full titration experiments for reliable determination of affinities. However, the first step in the confirmation of tens to hundreds of single hit-bead-derived compounds is usually a single-point measurement, monitoring the anisotropy change in a sample containing fluorescently labelled ligand and excess of target protein. The observed change in the anisotropy signal depends on both purity and affinity of the compound. We therefore developed an algorithm for simulating the binding isotherms as function of the presence of variable amounts of non-binding impurities. From the comparison of predicted and measured anisotropies, the following conclusions can be drawn: (1) the model for calculating expected anisotropy data according to Eq. 5 as the sum of all signal contributions from three individual species (i.e. free compound, complex and impurities) correctly approximates the ‘real’ data curve. (2) This method can now be used to determine affinities of compounds from single-point titration measurements using the obtained algorithm and the pre-determined sample purity parameters. As a consequence, the efficient selection of the best compounds from large numbers of on-bead screening hits in the future will be significantly simplified, making the cumbersome HPLC purification of single-bead-derived material obsolete.
The ICB screen resulted in the identification of a series of mixed α,β-peptide ligands with micromolar dissociation constants. To rationalise the experimental SAR and to provide a basis for further ligand optimization through follow-up library design, synthesis and screening, a new computational protocol was developed. Importantly, this protocol uses 2D structures of either peptide or peptidomimetic ligands as input and generates 3D binding poses by using a combination of ligand conformer pharmacophore filtering and fully flexible protein–peptidomimetic docking. Using the natural SLAM phosphopeptide as control, this computational protocol predicted similar binding modes for the solution-validated hit compounds. Moreover, rank order of binding affinities was predicted correctly, and it was also very encouraging to observe a clear window with respect to the differences in scores obtained for ligands with high or low binding affinities. (l)-β3-proline at position −1 was revealed to be an excellent beta amino acid substitute for positions −1 and −2 of the natural SLAM sequence. In addition, valuable insights into necessary interaction features C-terminally to the phosphotyrosine motif were generated. For example, in future library designs, the computational output hints towards the use of (d)-β-amino acids in position +2 and +3 as this would point side chains for SAP recognition towards the PPI interface, potentially enabling the development of shorter ligands with fewer amide bonds and stereochemistry known to confer proteolytic resistance.
In summary, we expect that the enhancements made to our ICB platform will facilitate the necessity for rapid, low-cost screening of large focused peptidomimetic libraries borne from computational design.
Materials and methods
Reagents
Unless stated otherwise, all chemical reagents and solvents were purchased from Sigma or Fluka. β-Amino acid building blocks and Fmoc-propargylglycine were obtained from ChemImpex, AnandChem or Fluka. All other amino acid building blocks and other SPPS reagents were ordered from Bachem or Novabiochem. TentaGel S resins used for on-bead screening were purchased from RAPP-Polymers.
For general methods such as HPLC analysis or peptide synthesis, see supporting information. Protein labelling, synthesis of phosphotyrosine libraries and analytical characterization of the individual hit compounds are also described in the supporting information.
On-bead screening
On-bead screening using the CONA method was carried out essentially as described previously [10]. In brief, the wells of a 96-well microtitre plate were filled with 1 mg resin of one of the phosphotyrosine sublibraries. After swelling the beads in PBS, 0.01% Tween20 and brief sonication, the beads were treated with a gelatine blocking buffer at 4° for 1 h. Then the beads were incubated with the target protein at a concentration of 5 nM in the same blocking buffer for 8 h at 4 °C before performing the automated confocal nanoscanning which took just over 6 h. The beads exhibiting the highest fluorescence ring intensities were then picked as described previously [10] using the PS04 PickoScreen instrument's picking device and placed into autosampler glass vials with conical inlets (one bead per vial).
Blocking buffer
PBS (10 mM phosphate, 137 mM NaCl, 3 mM KCl, pH = 7.4), 0.25% (w/v) gelatine (dry gelatine for blocking buffer, Sigma–Aldrich), 0.01% (v/v) Tween20 and 0.2% (w/v) BSA were used.
PS/PS labelling of single beads
Beads were treated with 12 μl of a four-component labelling solution (4.5 μl H2O, 4 μl tbutanol, 1.5 μl catalyst solution, 2 μl dye solution) and agitated for at least 16 h at room temperature by mild shaking. The labelling solution was removed (under microscope inspection), and the labelled beads were washed with methanol (5×) and water (1×).
- Dye solution
2 mM methanolic solution of an azide functionalized fluorescent dye
- Catalyst solution
freshly prepared mixture (1:1) of ascorbic acid (10 mg/ml) and copper sulphate (5 mg/ml) in water
Cleavage of PS/PS-labelled compounds from resin beads
Labelled beads were treated with an ice-cooled solution (6 μl) of NaOH (1 M)/dioxane (1:1) for 15 min at room temperature. After neutralization with HCl (4 μl, 1 M), the cleavage solution was evaporated under reduced pressure.
Solution confirmation of cleaved compounds by confocal fluorescence fluctuation spectroscopy
To generate stock solutions, the cleaved and dried material from each hit bead was dissolved in 20 μl of acetonitrile (20% v/v) in water. One-microlitre aliquots from each sample were further diluted 1:500 in PBS (10 mM phosphate, 137 mM NaCl, 3 mM KCl, pH = 7.4), containing 0.005% Tween20. All solution confirmation measurements were performed in a total assay volume of 7 μl on the PS02 instrument (typical measurement time, 12 × 12 s per sample) at ambient temperature, using low-volume 384-well microtitre plates (Perkin Elmer, Waltham, USA).
Single-point solution confirmation and affinity determination
Complex formation between the PS/PS-labelled hit compound and SAP-SH2 was monitored by recording the fluorescence fluctuation data for each compound in the presence and absence of SAP-SH2 (16 μM) and by determining the fluorescence anisotropy with 2D-FIDA [14]. The resulting values were then compared with the values predicted by the 3D plot in Fig. 3d.
For affinity determination, a titration series, containing 10 to 12 measurement points of increasing SAP-SH2 protein concentration was recorded. Fluctuation signals for individual wells were recorded in replicates of 12 × 12 s for each titration point.
Structure decoding by MALDI-MS and MALDI-MS/MS
For MALDI-MS decoding of screening hits, 1 μl of the initial single-bead-derived stock solution was diluted with 3 μl of a solution of acetonitrile/0.1% trifluoroacetic acid 50:50 (v/v). To 0.3 μl of this solution, the same volume of matrix (α-cyano-4-hydroxycinnamic acid, 20 mg/ml in acetonitrile/0.1% trifluoroacetic acid 50:50, v/v) was added onto a stainless steel MALDI plate and dried at room temperature. The MALDI plates were analysed on the 4700 Proteomics Analyzer TOF-TOF™ mass spectrometer (Applied Biosystems/MD Sciex, Foster City, CA). MS spectra of the intact ions were measured in positive ion reflector mode in a mass range from m/z 800 to 2,600 with a time resolution of 0.5 ns, a sensitivity of 50 mV/div and 750 laser shots per sample spot. The instrument parameters (laser position, voltages and times) were optimized for maximal signal intensity and resolution. MALDI-MS spectra were analysed using the Data Explorer software (version 4.6, Applied Biosystems, CA, USA). The candidate structures were identified by comparison of all MS peaks in the mass range from m/z = 800 to 2,600 with a table of theoretical Y fragments for all individual library members.
Molecular modelling and virtual screening
To derive information about the size, shape and optimal atom type placement within the SAP–SLAM SH2 domain binding site, autoligand (ref) was employed to probe PDB entries 1D4T and 1D4W. Using different numbers of fill points (10–500), we generated a plot of total energy per volume vs. volume (Fig. 1) to determine the optimal fill volume that allowed mapping of the binding pocket. All fill volumes with an EPV>−17 were read into Pymol (http://www.pymol.org) and coloured by B-factor to highlight those areas optimal for placement of acceptor, donor and hydrophobic atoms. Only those areas coloured from yellow/orange–red were retained for subsequent analysis.
Next, all overlapping fill points from different fills were merged, and all remaining points were used as input to vROCS (Openeye Scientific Software) which enabled the creation of a receptor-based pharmacophore. Any features which overlapped conserved waters from the X-ray which could not be displaced using the current peptide backbone conformation were removed from the pharmacophore as illustrated in Fig. 2. Defining all critical hydrogen-bonding interactions between SLAM and SAP and merging this information with our receptor-based pharmacophore allowed us to generate a shape/feature-based pharmacophore within vROCS which incorporated not only those features crucial for SLAM peptide binding but also features whereby donor/acceptor/hydrophobic atoms could be placed to enhance the affinity of the peptide.
All experimentally validated on-bead hits were drawn in Chemsketch (http://www.acdlabs.com) without linker attachment and ionised at physiological pH (7.4) prior to 3D enumeration with OMEGA v 2.3.2 (Openeye Scientific Software). Maxconfs and Maxconfgen were set at 50,000 and 10,000, respectively, with all other parameters kept as default.
The top pharmacophore-matched solution was taken for follow-up fully flexible docking with RosettaLigand, and 100 solutions for each were generated. The top-ranked solution was selected by sorting by Interface Delta. Single-point energies were calculated for the top-ranking solutions generated by RosettaLigand using Szybki v 1.5.1 (Openeye Scientific Software) with no optimisation of ligands or protein position in the active site. Protein–ligand energies are expressed in kilocalories per mole.
Electronic supplementary material
(DOCX 1149 kb)
References
- 1.Chen G, Tai AK, Lin M, Chang F, Terhorst C, Huber BT. Increased proliferation of CD8+ T cells in SAP-deficient mice is associated with impaired activation-induced cell death. Eur J Immunol. 2007;37(3):663–674. doi: 10.1002/eji.200636417. [DOI] [PubMed] [Google Scholar]
- 2.Chuang H-C, Lay J-D, Hsieh W-C, Wang H-C, Chang Y, Chuang S-E, Su I-J. Epstein-Barr virus LMP1 inhibits the expression of SAP gene and upregulates Th1 cytokines in the pathogenesis of hemophagocytic syndrome. Blood. 2005;106(9):3090–3096. doi: 10.1182/blood-2005-04-1406. [DOI] [PubMed] [Google Scholar]
- 3.Dierck K, Machida K, Voigt A, Thimm J, Horstmann M, Fiedler W, Mayer BJ, Nollau P. Quantitative multiplexed profiling of cellular signalling networks using phosphotyrosine-specific DNA-tagged SH2 domains. Nat Methods. 2006;3(9):737–744. doi: 10.1038/nmeth917. [DOI] [PubMed] [Google Scholar]
- 4.Dong Z, Cruz-Munoz M-E, Zhong M-C, Chen R, Latour S, Veillette A (2009) Essential function for SAP family adaptors in the surveillance of hematopoietic cells by natural killer cells. Nat Immunol 10(9):973–980 [DOI] [PubMed]
- 5.Furukawa H, Tohma S, Kitazawa H, Komori H, Nose M, Ono M. Role of SLAM-associated protein in the pathogenesis of autoimmune diseases and immunological disorders. Arch Immunol Ther Exp. 2010;58(1):37–44. doi: 10.1007/s00005-009-0060-7. [DOI] [PubMed] [Google Scholar]
- 6.Gademann K, Hane A, Rueping M, Jaun B, Seebach D. The fourth helical secondary structure of beta-peptides: the (P)-28-helix of a beta-hexapeptide consisting of (2R,3S)-3-amino-2-hydroxy acid residues. Angew Chem Int Ed. 2003;42(13):1534–1537. doi: 10.1002/anie.200250290. [DOI] [PubMed] [Google Scholar]
- 7.Hara T, Durell SR, Myers MC, Appella DH. Probing the structural requirements of peptoids that inhibit HDM2-p53 interactions. J Am Chem Soc. 2006;128(6):1995–2004. doi: 10.1021/ja056344c. [DOI] [PubMed] [Google Scholar]
- 8.Hintersteiner M, Buehler C, Uhl V, Schmied M, Muller J, Kottig K, Auer M. Confocal nanoscanning, bead picking (CONA): PickoScreen microscopes for automated and quantitative screening of one-bead one-compound libraries. J Comb Chem. 2009;11(5):886–894. doi: 10.1021/cc900059q. [DOI] [PubMed] [Google Scholar]
- 9.Hintersteiner M, Kimmerlin T, Garavel G, Schindler T, Bauer R, Meisner N-C, Seifert J-M, Uhl V, Auer M. A highly potent and cellularly active b-peptidic inhibitor of the p53/hDM2 interaction. Chembiochem. 2009;10(6):994–998. doi: 10.1002/cbic.200800803. [DOI] [PubMed] [Google Scholar]
- 10.Hintersteiner M, Kimmerlin T, Kalthoff F, Stoeckli M, Garavel G, Seifert J-M, Meisner N-C, Uhl V, Buehler C, Weidemann T, Auer M. Single bead labelling method for combining confocal fluorescence on-bead screening and solution validation of tagged one-bead one-compound libraries. Chem Biol. 2009;16(7):724–735. doi: 10.1016/j.chembiol.2009.06.011. [DOI] [PubMed] [Google Scholar]
- 11.Hron JD, Caplan L, Gerth AJ, Schwartzberg PL, Peng SL. SH2D1A regulates T-dependent humoral autoimmunity. J Exp Med. 2004;200(2):261–266. doi: 10.1084/jem.20040526. [DOI] [PMC free article] [PubMed] [Google Scholar]
- 12.Hwang PM, Li C, Morra M, Lillywhite J, Muhandiram DR, Gertler F, Terhorst C, Kay LE, Pawson T, Forman-Kay JD, Li S-C. A “three-pronged” binding mechanism for the SAP/SH2D1A SH2 domain: structural basis and relevance to the XLP syndrome. EMBO J. 2002;21(3):314–323. doi: 10.1093/emboj/21.3.314. [DOI] [PMC free article] [PubMed] [Google Scholar]
- 13.Kaneko T, Huang T, Zhao B, Li L, Liu H, Voss CK, Wu C, Schiller MR, Shun-Cheng Li S. Loops govern SH2 domain specificity by controlling access to binding pockets. Sci Signal. 2010;3(120):ra34. doi: 10.1126/scisignal.2000796. [DOI] [PMC free article] [PubMed] [Google Scholar]
- 14.Kask P, Palo K, Fay N, Brand L, Mets U, Ullmann D, Jungmann J, Pschorr J, Gall K. Two-dimensional fluorescence intensity distribution analysis: theory and applications. Biophys J. 2000;78(4):1703–1713. doi: 10.1016/S0006-3495(00)76722-1. [DOI] [PMC free article] [PubMed] [Google Scholar]
- 15.Li S-C, Gish G, Yang D, Coffey AJ, Forman-Kay JD, Ernberg I, Kay LE, Pawson T. Novel mode of ligand binding by the SH2 domain of the human XLP disease gene product SAP/SH2D1A. Curr Biol. 1999;9(23):1355–1362. doi: 10.1016/S0960-9822(00)80080-9. [DOI] [PubMed] [Google Scholar]
- 16.Machida K, Mayer BJ (2005) The SH2 domain: versatile signaling module and pharmaceutical target. Biochimica et Biophysica Acta 1747(1):1–25 [DOI] [PubMed]
- 17.McCausland MM, Yusuf I, Tran H, Ono N, Yanagi Y, Crotty S. SAP regulation of follicular helper CD4 T cell development and humoral immunity is independent of SLAM and Fyn kinase. J Immunol. 2007;178(2):817–828. doi: 10.4049/jimmunol.178.2.817. [DOI] [PubMed] [Google Scholar]
- 18.Poy F, Yaffe MB, Sayos J, Saxena K, Morra M, Sumegi J, Cantley LC, Terhorst C, Eck MJ. Crystal structures of the XLP protein SAP reveal a class of SH2 domains with extended, phosphotyrosine-independent sequence recognition. Mol Cell. 1999;4(4):555–561. doi: 10.1016/S1097-2765(00)80206-3. [DOI] [PubMed] [Google Scholar]
- 19.Schreiber JV, Quadroni M, Seebach D. Sequencing of b-peptides by mass spectrometry. Chimia. 1999;53(12):621–626. [Google Scholar]
- 20.Seebach D, Abele S, Gademann K, Guichard G, Hintermann T, Jaun B, Matthews JL, Schreiber JV, Oberer L, Hommel U, Widmer H. Beta 2- and beta 3-peptides with proteinaceous side-chains. Synthesis and solution structures of constitutional isomers, a novel helical secondary structure, and the influence of solvation and hydrophobic interactions on folding. Helvetica Chimica Acta. 1998;81(5):932–982. doi: 10.1002/hlca.19980810513. [DOI] [Google Scholar]
- 21.Seebach D, Beck AK, Bierbaum DJ. The world of beta- and gamma-peptides comprised of homologated proteinogenic amino acids and other components. Chem Biodivers. 2004;1(8):1111–1239. doi: 10.1002/cbdv.200490087. [DOI] [PubMed] [Google Scholar]
- 22.Seebach D, Overhand M, Kuehnle FNM, Martinoni B. b-Peptides. Synthesis by Arndt-Eistert homologation with concomitant peptide coupling. Structure determination by NMR and CD spectroscopy and by x-ray crystallography. Helical secondary structure of a b-hexapeptide in solution and its stability towards pepsin. Helvetica Chimica Acta. 1996;79(4):913–941. doi: 10.1002/hlca.19960790402. [DOI] [Google Scholar]
- 23.Seebach D, Rueping M, Arvidsson PI, Kimmerlin T, Micuch P, Noti C, Langenegger D, Hoyer D. Linear, peptidase-resistant beta 2/beta 3-di- and alpha/beta 3-tetrapeptide derivatives with nanomolar affinities to a human somatostatin receptor preliminary communication. Helvetica Chimica Acta. 2001;84(11):3503–3510. doi: 10.1002/1522-2675(20011114)84:11<3503::AID-HLCA3503>3.0.CO;2-A. [DOI] [Google Scholar]
- 24.Sheinerman FB, Al-Lazikani B, Honig B (2003) Sequence, structure and energetic determinants of phosphopeptide selectivity of SH2 domains. J Mol Biol 334(4):823–841 [DOI] [PubMed]
- 25.Songyang Z, Shoelson SE, Chaudhuri M, Gish G, Pawson T, Haser WG, King F, Roberts T, Ratnofsky S. SH2 domains recognize specific phosphopeptide sequences. Cell (Cambridge, MA, United States) 1993;72(5):767–778. doi: 10.1016/0092-8674(93)90404-e. [DOI] [PubMed] [Google Scholar]
- 26.Songyang Z, Shoelson SE, McGlade J, Olivier P, Pawson T, Bustelo XR, Barbacid M, Sabe H, Hanafusa H. Specific motifs recognized by the SH2 domains of Csk, 3BP2, fps/fes, GRB-2, HCP, SHC, Syk, and Vav. Mol Cell Biol. 1994;14(4):2777–2785. doi: 10.1128/MCB.14.4.2777. [DOI] [PMC free article] [PubMed] [Google Scholar]
Associated Data
This section collects any data citations, data availability statements, or supplementary materials included in this article.
Supplementary Materials
(DOCX 1149 kb)


