

Abstract
Please cite this paper as: Squires et al. (2012) Influenza research database: an integrated bioinformatics resource for influenza research and surveillance. Influenza and Other Respiratory Viruses 6(6), 404–416.
Background The recent emergence of the 2009 pandemic influenza A/H1N1 virus has highlighted the value of free and open access to influenza virus genome sequence data integrated with information about other important virus characteristics.
Design The Influenza Research Database (IRD, http://www.fludb.org) is a free, open, publicly‐accessible resource funded by the U.S. National Institute of Allergy and Infectious Diseases through the Bioinformatics Resource Centers program. IRD provides a comprehensive, integrated database and analysis resource for influenza sequence, surveillance, and research data, including user‐friendly interfaces for data retrieval, visualization and comparative genomics analysis, together with personal log in‐protected ‘workbench’ spaces for saving data sets and analysis results. IRD integrates genomic, proteomic, immune epitope, and surveillance data from a variety of sources, including public databases, computational algorithms, external research groups, and the scientific literature.
Results To demonstrate the utility of the data and analysis tools available in IRD, two scientific use cases are presented. A comparison of hemagglutinin sequence conservation and epitope coverage information revealed highly conserved protein regions that can be recognized by the human adaptive immune system as possible targets for inducing cross‐protective immunity. Phylogenetic and geospatial analysis of sequences from wild bird surveillance samples revealed a possible evolutionary connection between influenza virus from Delaware Bay shorebirds and Alberta ducks.
Conclusions The IRD provides a wealth of integrated data and information about influenza virus to support research of the genetic determinants dictating virus pathogenicity, host range restriction and transmission, and to facilitate development of vaccines, diagnostics, and therapeutics.
Keywords: Bioinformatics, epitope, influenza virus, integrated, surveillance
Introduction
The U.S. National Institute of Allergy and Infectious Diseases (NIAID) supports basic, translational, and clinical research designed to develop improved diagnostic, therapeutic, and preventative strategies for human infectious diseases. With the advent of high‐throughput experimental methodologies, it has become apparent that publicly accessible databases and bioinformatics analysis tools are increasingly needed in infectious disease research. In response to this need, NIAID has developed the Bioinformatics Resource Centers (BRC) program to support the management and analysis of data related to human pathogenic microorganisms. 1 As one of the five NIAID‐supported BRCs, the Influenza Research Database (IRD; accessible at http://www.fludb.org) is focused on data related to influenza virus.
Influenza virus is a member of the Orthomyxoviridae family of segmented, negative‐strand RNA viruses. 2 Influenza’s eight genomic segments encode 10 or 11 proteins, depending on whether the PB1‐F2 ORF is present. As a zoonotic virus, 3 influenza is able to infect a wide range of host species, including humans, with wild aquatic birds considered to be the major reservoir species and swine an important intermediary host.
Influenza A virus is one of the major human public health threats in both the developed and developing world, causing 3–5 million cases of serious illness every year worldwide. 4 In addition, because of segment reassortment and species jump events, influenza virus occasionally produces pandemic strains that are able to rapidly spread through the human population. The morbidity and mortality caused by the recent 2009 H1N1 pandemic strain were less than feared based on the experience with previous pandemic strains, 5 but nonetheless resulted in serious disease and death among many, including in age groups not usually associated with severe disease. 6 Previous pandemic strains have been substantially more virulent, with the 1918 “Spanish flu” causing an estimated 20–100 million deaths worldwide. 7 , 8 , 9 Although antiviral drugs and prophylactic vaccines have been developed, the rapid evolution of influenza facilitates the generation of drug‐resistant and vaccine‐resistant variants; therefore, this virus remains a major public health threat.
Influenza Research Database (http://www.fludb.org)
The IRD emerged out of the earlier BioHealthBase BRC. 10 The IRD is a comprehensive, web‐accessible database and analysis resource developed by a team of research scientists, bioinformaticians, and professional software developers supported by the U.S. National Institute of Allergy and Infectious Disease. The IRD has three major components: a comprehensive database containing a variety of different data types accessible through a series of optimized search interfaces, a suite of analysis and visualization tools focused on comparative genomics and data integration, and personal workbenches for saving data and analysis results (Figure 1). Several influenza‐focused web‐accessible databases exist: the NCBI Influenza Virus Resource (IVR, http://www.ncbi.nlm.nih.gov/genomes/FLU/FLU.html), 11 Global Initiative on Sharing Avian Influenza Data (GISAID) EpiFlu Database 12 (http://www.gisaid.org), Influenza Sequence & Epitope Database 13 (ISED, http://influenza.korea.ac.kr/ISED2/), the Influenza Virus Database 14 [(IVBD), (http://influenza.psych.ac.cn/)], and the OpenFlu Database 15 at http://openflu.vital‐it.ch; however, the IRD is unique in the breadth and depth of the data and analysis tools provided and in its approach to data and workflow integration that assist in the development of vaccines, 16 , 17 , 18 , 19 , 20 , 21 , 22 therapeutics, 23 , 24 and diagnostics. 25 , 26 , 27
Figure 1.
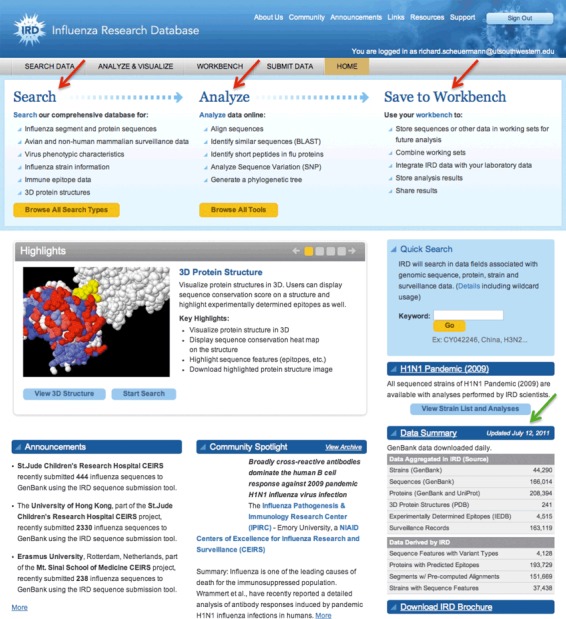
Influenza Research Database (IRD) home page – The IRD home page provides easy access to search interfaces (Search), comparative genomics analysis and visualization tools (Analyze), and a user’s personal workbench (Save to Workbench) (red arrows). The Data Summary section provides a quick overview of the current IRD data content and the date of last update (green arrow). Other sections highlight some of the novel analysis and visualization tools (Highlights), recent publications from the influenza research community (Community Spotlight), and upcoming events and recent data submissions (Announcements).
Foundational sequence data
As with the other IVBD resources, the foundation of IRD is the genomic and protein sequence and annotation information imported from GenBank 28 and UniProt. 29 Data are uploaded from these sources into IRD on a daily basis to ensure that they remain current. As of July 12, 2011, information about 44 290 strains is available within the IRD including sequence records for 166 014 virus segments and 208 394 encoded proteins (Figure 1, green arrow). In contrast to the GISAID EpiFlu resource, all data in IRD are available for use without restriction of any kind. As with several other resources, IRD supports standard comparative genomics analysis of sequence data with multiple sequence alignment and phylogenetic tree construction tools. In addition, the IRD also extends these tools in numerous useful ways as demonstrated below.
Related data from other sources
Experimentally determined immune epitope data are imported from the Immune Epitope Database (IEDB, http://www.immuneepitope.org) 30 and integrated with the existing protein sequence data. As of July 2011, 4515 experimental epitopes covering all 11 influenza proteins are represented, including both T‐cell and B‐cell/antibody epitopes and MHC‐binding peptides. Of the influenza virus epitopes curated by the IEDB and imported into the IRD, 70% are assayed as T cell, 8·3% as B‐cell epitopes, 40·8% as MHC Class I, and 29·5% as MHC Class II (epitopes can be in multiple categories, such as T‐cell epitopes that are also MHC Class I epitopes). Protein structures are imported from the RSCB Protein Data Bank resource (PDB, http://www.pdb.org), 31 and protein domains and motifs from Pfam. 32 Many of the 241 protein structures currently available in IRD were determined from cocrystals that include small molecule inhibitors and neutralizing antibodies. The immune epitope and protein structure data can each be searched and viewed independently, but the real power of the IRD can be seen when these components are integrated with the sequence data, as will be demonstrated later.
Novel data submitted to IRD
As of July 2011, 163 119 avian surveillance records have been deposited in the IRD, largely through the NIAID‐sponsored Centers of Excellence in Influenza Research and Surveillance (CEIRS, http://www.niaid.nih.gov/labsandresources/resources/ceirs/Pages/default.aspx). A key aspect of the IRD’s support for surveillance data was the collaborative development of metadata standards for required data fields and standardized vocabularies that are used to annotate every surveillance record. The required data fields include information about the surveillance sample collection location, date, and reason for collection, information about the host species, health status, age, and gender, as well as information about the type of specimen collected, and the method used for virus detection. The adoption of metadata standards ensures accuracy and reliability in data content across all surveillance data providers. Current surveillance data cover 29 countries with extensive representation of samples from China, the Netherlands, and the United States. Specimens from 131 598 surveillance samples have been tested for the presence of the influenza virus, of which 6421 (4·9%) contained influenza virus. Of those, 621 have been sequenced to date and are directly linked to strain and sequence data within the IRD. In addition to avian surveillance samples, 10 469 surveillance samples have been obtained from non‐human mammalian sources, predominantly from swine (85%) and domestic cat (10%), of which 348 (3·3%) were influenza virus positive.
Novel data generated by IRD
Novel data are generated and continually updated using both published and custom bioinformatics algorithms including predicted cytotoxic T‐cell epitopes using NetCTL, 33 sequence variation statistics using custom entropy‐based algorithms, predicted protein domains and motifs using InterProScan, 34 and estimated protein isoelectric points and molecular weights using EMBOSS software. 35 A further novel data type, sequence feature variant types (SFVT), has been developed by IRD and builds on extensive expert knowledge about influenza protein structures and functions (JM Noronha, M Liu, RB Squires, BE Pickett, BG Hale, GM Air, SE Galloway, T Takimoto, M Schmolke, RA Lamb, V Hunt, E Klem, M McGee and RH Scheuermann, unpublished data). Sequence features (SF) are motifs in genes or proteins that are associated with important virus properties. The IRD team, together with its Scientific Working Group and subject matter experts, used focused manual curation of the literature and other information sources to define a total of 4128 SF in the 11 influenza A virus proteins to date. These SF are classified as structural (e.g., a particular alpha helix in a protein), functional (e.g., an enzyme active site), and immune epitopes. An SF can be as large as an entire protein or as small as a single amino acid position; an SF can be a continuous region in the protein sequence or a non‐continuous series of residues localized in 3D space. Once the SF motifs have been defined, the extent of sequence variation is determined as variant types (VT) for each SF. These SFVT data are a unique resource and can be used as a starting point for genotype–phenotype association studies of influenza viruses.
Data integration
New biological insights can be obtained through the integration of distinct data types. Data integration is one of the key features that distinguishes database resources like those of the NIAID BRC program, including IRD, that are focused on a particular biological domain from data archive resources like GenBank and IEDB that are focused on a particular data type. IRD relies on these data archives to provide comprehensive data of a particular type in a standard format and focuses on how to best integrate these data and derive new knowledge from their analyses to address biological questions that benefit from or require integrated solutions.
The IRD protein structure viewer, a customized implementation of the JMol 3D visualization software, 36 is unique among the influenza resources and one example of how IRD integrates related data. The JMol 3D structure viewer is integrated with other sequence‐related data in the IRD database. For example, in order to observe the relationship between sequence conservation and immune epitopes, the IRD offers the ability to color‐code protein structures based on a sequence variation score (Figure 2C) and simultaneously highlight selected SF‐like immune epitopes (Figure 2D). In this way, IRD has integrated protein structure information derived from PDB, immune epitope data from IEDB, and sequence variation scores calculated by IRD, in order to observe the correlation of these protein features.
Figure 2.
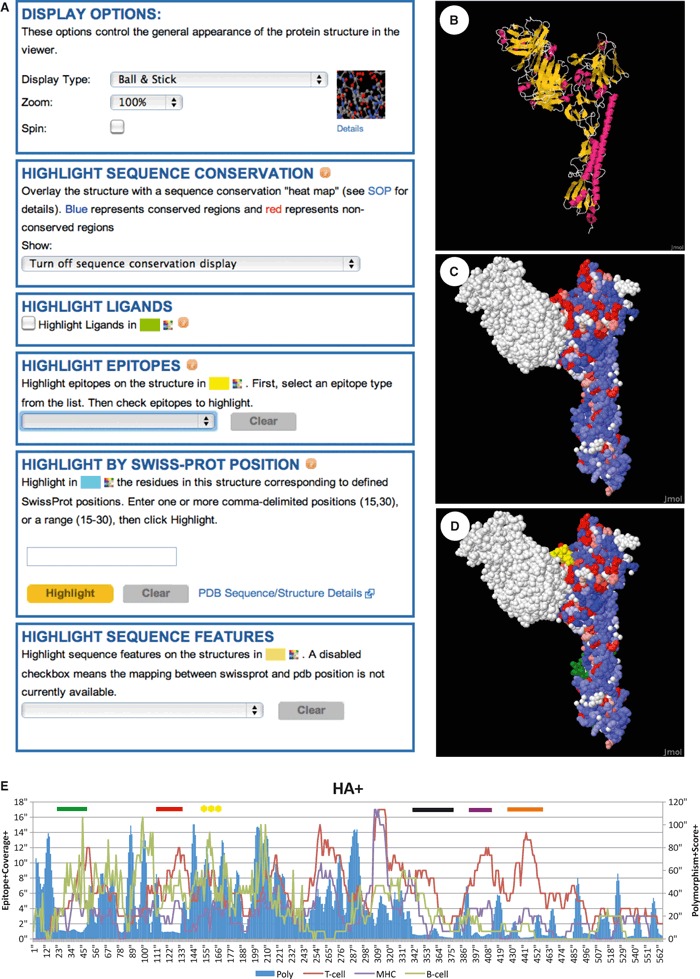
Data integration in the 3D protein viewer – In the Influenza Research Database (IRD) enhanced version of the JMol 3D protein viewer, users can visualize selected influenza protein structures and choose a variety of different customization features (A). The structure (1EO8) of an H3 hemagglutinin (HA) protein in complex with a neutralizing antibody (white residues in upper left portion of structures in C and D) is shown. Users can choose different display types including ribbon diagrams (B) and space filling models (C, D). The 3D viewer also integrates data from the IRD database, so that users can color protein structures based on pre‐computed sequence conservation score (C, D), with highly conserved residues colored in blue and highly variable residues colored in red. Users can also highlight the location of selected immune epitopes (the B‐cell epitope Immune Epitope Database [IEDB] ID:33413 is colored yellow in D) and other pre‐compiled sequence features. The HA conserved epitope region (CER)1 is shown highlighted in green (see below). (E) Influenza segment sequence variation as measured by polymorphism score (poly) plotted in comparison with epitope coverage. Sequence polymorphism scores were computed for human H1N1 subtype HA sequences using a formula adapted from Crooks et al. 47 and downloaded from the IRD, with scores for proteins ranging from 0 (fully conserved) to 432 (all amino acids equally represented at a position). In order to visualize the regions of sequence variation, an average polymorphism score was computed using a 5‐amino‐acid sliding window. An epitope coverage score was computed by counting the number of epitopes that occur at each amino acid position. T‐cell and MHC‐binding epitope data shown are from human only, while B‐cell epitope data are from all host species. Colored bars at the top of each chart show regions of high immunological activity but little sequence variation – CER. Conserved epitope regions are colored as follows: HA‐CER1 (25–50, green), HA‐CER2 (115–130, red), HA‐CER3 (340–375, black), HA‐CER4 (395–410, purple), and HA‐CER5 (435–450, orange). The location of the B‐cell epitope IEDB ID:33413 is highlighted with yellow asterisks.
Influenza Research Database also supports user‐driven integrative data analysis. For example, through the integration of experimentally validated immune epitopes location data with an analysis of amino acid sequence conservation from the IRD, we have identified conserved epitope regions (CER) within the hemagglutinin (HA) protein that are both known host immune system targets and regions that are conserved within human type A influenza H1N1 viruses (Figure 2E). Indeed, the results of this integrative analysis have experimental support. Investigators have recently isolated monoclonal antibodies that demonstrate heterosubtypic cross‐reactivity. In one case, a series of monoclonal antibodies were generated from the repertoire of anti‐influenza B cells in a human volunteer. Among the different monoclonals, a subset showed high‐affinity binding to HA proteins from several different influenza subtypes. 37 The structure obtained from cocrystals revealed that one of these antibodies, CR6261, recognized regions within the HA stalk. 38 In a separate study, investigators intentionally elicited a heterosubtypic immune response through an immunization strategy utilizing HA proteins from different subtypes in priming and boosting. 39 Binding analysis with truncated protein construct again revealed that cross‐reactive antibodies were recognizing regions within the HA stalk. A comparison of the regions identified by the integrative computational methods described here with the regions identified by these experimental methods shows a dramatic correlation (Table 1) with each of the antibody binding regions covered by one or more CER. The region covered by CER1, which overlaps with the binding site of CR6261, is highlighted in green in the stalk of the HA structure in Figure 2D. The CER for HA also include all four highly cross‐reactive epitopes predicted by Duvvuri et al. 40 and found to be conserved in both seasonal H1N1 and the pandemic H1N1 2009 viruses.
Table 1.
Overlap between experimentally determined cross‐reactive epitopes and computationally determined conserved epitope regions (CER)
| Reference | Region* | Location** | H0 coordinates*** | CER coverage† |
|---|---|---|---|---|
| Ekiert et al. 38 | CR6261 Region1 | HA1 Val40 | 47 | HA‐CER1 |
| HA1 Leu42 | 49 | HA‐CER1 | ||
| HA1 Leu292 | 307? | None | ||
| HA2 Thr49 | 392 | None | ||
| HA2 Val52 | 395 | HA‐CER4 | ||
| HA2 Ile56 | 399 | HA‐CER4 | ||
| CR6261 Region2 | HA1 His18 | 25 | HA‐CER1 | |
| HA1 His38 | 45 | HA‐CER1 | ||
| HA2 Trp21 | 364 | HA‐CER3 | ||
| HA2 Thr41 | 384 | None | ||
| HA2 Ile45 | 388 | None | ||
| Wang et al. 39 | 12D1 | HA2 76–106 | 419–446 | HA‐CER5 |
HA, hemagglutinin; ?, Based on the information provided in the paper by Ekiert et al., there is a discrepancy between the residue listed and the amino acid position reported; we have not been able to resolve this discrepancy.
*Monoclonal antibody binding region reported in Reference.
**Numbering scheme used in Reference.
***Equivalent location in numbering scheme used in Figure 2E.
†Overlap with HA CER reported here.
Workbench: save searches, working sets, and analysis results
The IRD Workbench allows a registered user to save search and analysis results for later retrieval. Registration is free and serves only to match individual workbenches with specific user accounts on the IRD server. The IRD Workbench supports collaboration among the researchers by allowing a user to share his/her saved results with selected users, or even with the public. Complex data sets not achievable by single searches can be derived from the intersection or union of working sets (or search results) within the IRD Workbench. Users can upload unpublished sequence data to their Workbench for simple incorporation into an analysis with public data. Private data remain invisible to the outside world unless a user designates otherwise.
Analysis tools supported within the IRD
The IRD supports numerous analysis tools, including the inference of maximum‐likelihood phylogenetic trees using PhyML. 41 A user can select a quick version of tree inference using default PhyML settings or specify the PhyML settings themselves. If the user does not know the best settings for PhyML for a particular set of sequences, the IRD custom software, ModelCompare, can be run to compare the fit of these data to a range of different models of evolution. The IRD also provides a customized tree viewer based on Archaeopteryx (http://www.phylosoft.org/archaeopteryx) 42 that incorporates Archaeopteryx functions, such as re‐rooting, subtree ordering, and branch swapping in addition to allowing the user to decorate the tree labels based on sequence metadata characteristics including subtype, host, country, or year of isolation derived from the IRD database (Figure 3).
Figure 3.
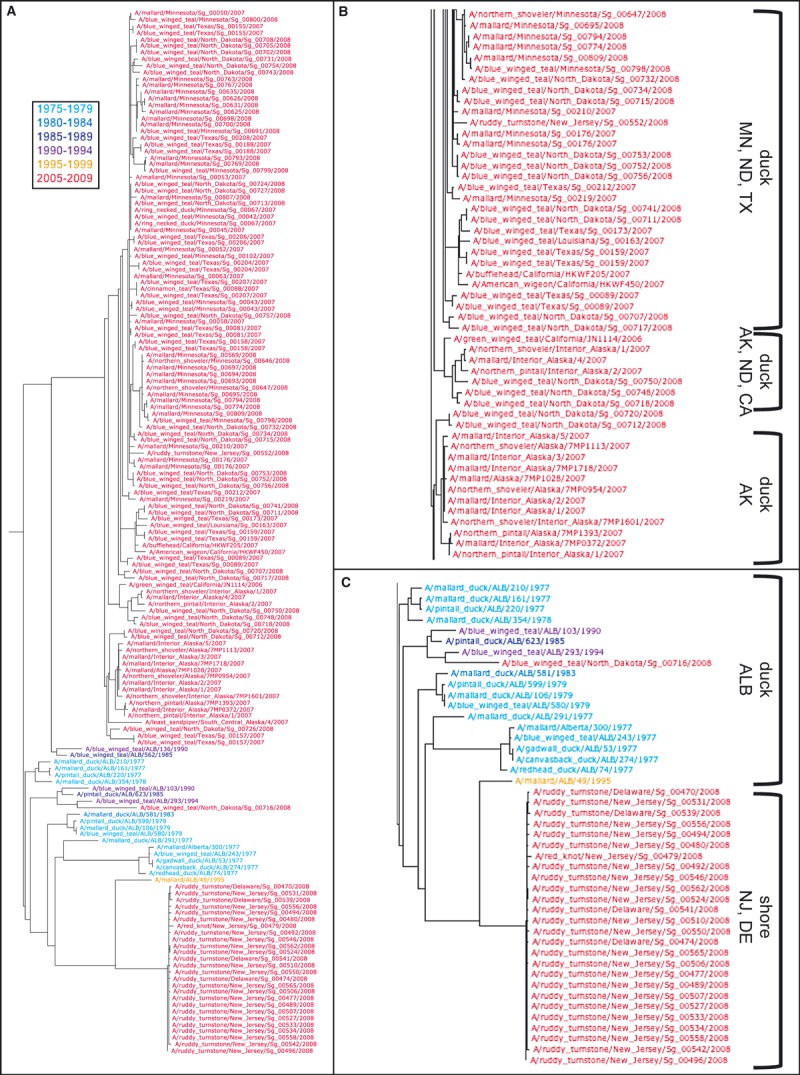
Influenza Research Database (IRD) phylogenetic trees – (A) In the IRD enhanced version of the Archaeopteryx tree visualization tool, the user can color‐code branch nodes based on a variety of different sequence annotation characteristics from the IRD database, in this case year of isolation grouped into 5‐year intervals. Phylogenetic relationships between hemagglutinin nucleotide sequences from all H4 influenza subtype viruses isolated from aquatic ducks (Anatidae family) and shorebirds (Scolopacidae family) available in IRD surveillance records as of July 2011 are shown using the IRD “Quick Tree” maximum‐likelihood estimation based on the HKY model of evolution. (B) An expanded view of the major 2005–2009 Minnesota (MN), North Dakota (ND), Texas (TX), Alaska (AK), and California (CA) duck branch. (C) An expanded view of the New Jersey (NJ) and Delaware (DE) shorebird branch with related Alberta (ALB) duck isolates from pre‐2005.
In addition to the integrated phylogenetic tree generation and visualization capability, the IRD also supports the generation and visualization of multiple sequence alignments. Multiple sequence alignments can highlight substitutions in common among the evolutionarily related sequences. The IRD uses the MUltiple Sequence Comparison by Log‐Expectation (MUSCLE) 43 algorithm to generate alignments, which can then be saved to the IRD Workbench and shared with collaborators. Alternatively, the user can visualize pre‐computed and curated alignments that are stored on the IRD server to circumvent the alignment process, especially for large data sets. Visualization of sequence alignments in IRD is based on the Java alignment editor JalView 44 (Figure 4).
Figure 4.
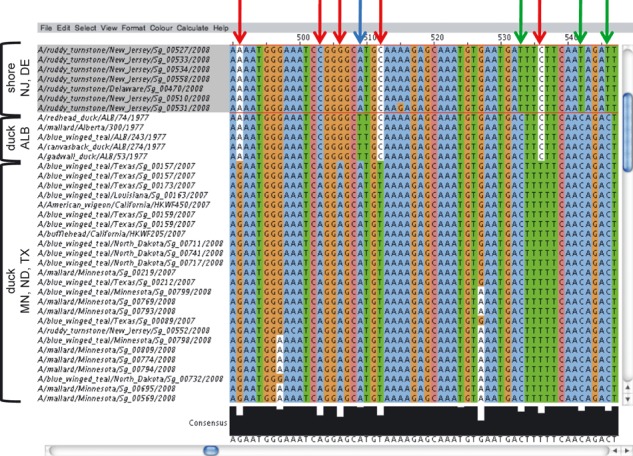
Influenza Research Database (IRD) multiple sequence alignment – H4 hemagglutinin nucleotide sequences from the aquatic duck and shorebird surveillance samples were aligned using the MUltiple Sequence Comparison by Log‐Expectation algorithm and visualized using the IRD enhanced JalView. Bar graph of sequence conservation values along with the computed consensus sequence is shown at the bottom. Nucleotide residues shared by Alberta (ALB) duck and Delaware Bay (NJ, DE) shorebird isolates but not by the Minnesota (MN), North Dakota (ND), or Texas (TX) isolates are noted with red arrows. Residues unique to Alberta ducks (blue arrow) or shorebirds (green arrows) are also highlighted.
The IRD also offers a novel metadata‐driven comparative genomics analysis tool (Meta‐CATS) that resolves statistically significant residues that differ among the sequences grouped by metadata characteristics. Sequences are selected from a working set and can be automatically grouped by sequences characteristics including host species, age or gender, geographical location of isolation, year of isolation, virus type, and collecting institution. Users are also able to upload or paste a list of sequences and manually group their sequences for analysis. Following the analysis, users can choose to view a chi‐square goodness‐of‐fit test result or a Pearson’s chi‐square pairwise comparison report.
IRD surveillance data
One of the more significant, distinguishing aspects of the IRD in comparison with other influenza resources is the availability of avian and non‐human mammalian surveillance data. Surveillance data can be searched by various host and surveillance sample characteristics (Figure 5) with the results returned in the form of a surveillance record list or a custom summary table that enables users to compare up to four characteristics in a two‐dimensional table. Characteristics that can be compared include host taxonomy, age and health status, sample influenza test results, isolation location and date, and virus subtype. The IRD surveillance records include precise geospatial location in the form of latitude and longitude coordinates, which allows visualization of the surveillance locations on a Google Map (Figure 6). Spatial coordinates also allow surveillance records to be mapped relative to other geospatial entities, such as bird migratory flyways.
Figure 5.
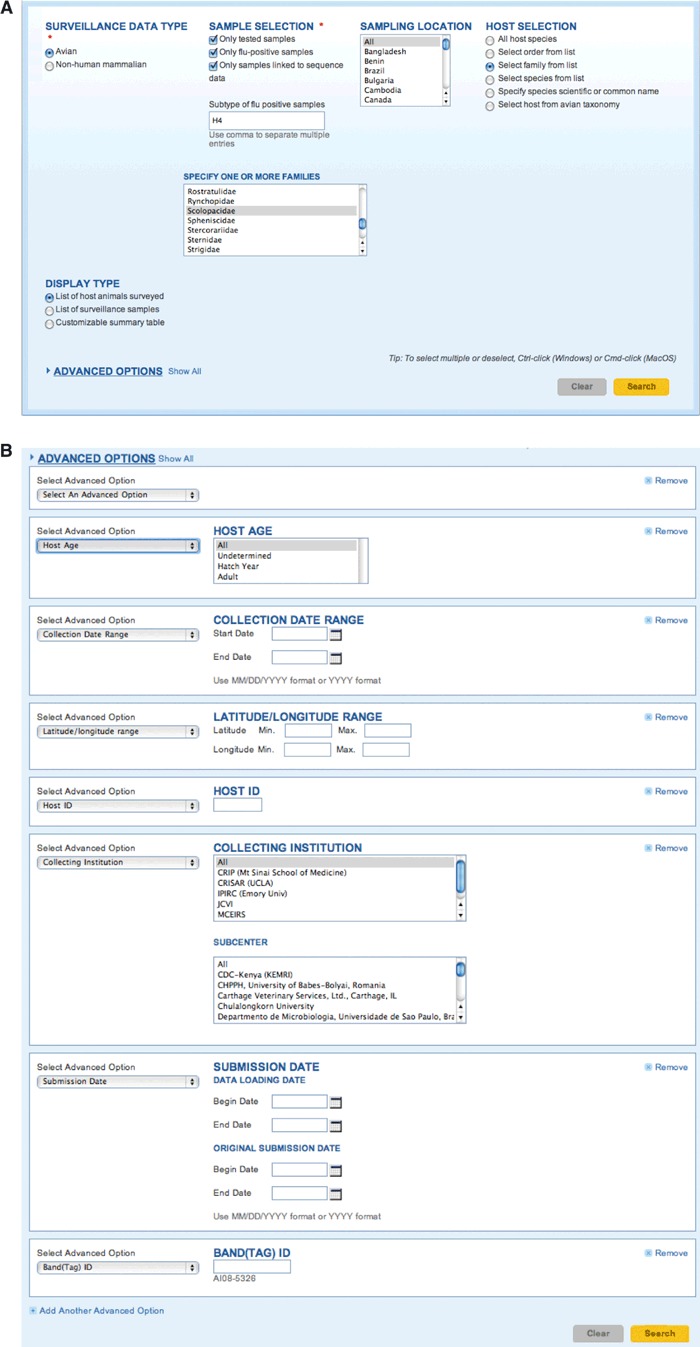
Surveillance data search interface – (A) Influenza Research Database (IRD) data are accessed through a variety of different customized search interfaces in which commonly used search criteria are initially displayed. In the case of animal surveillance data, these include sampling location, host, and whether influenza virus was detected and sequenced. Branching logic is used to add additional search criteria based on other selections; choosing the “Select family by list” radio button pops up a new box with avian family names listed. (B) In addition to the commonly used criteria, IRD also allows for searching by other characteristics (e.g., host age, collection date, latitude and longitude coordinates of collection site) as advanced options.
Figure 6.
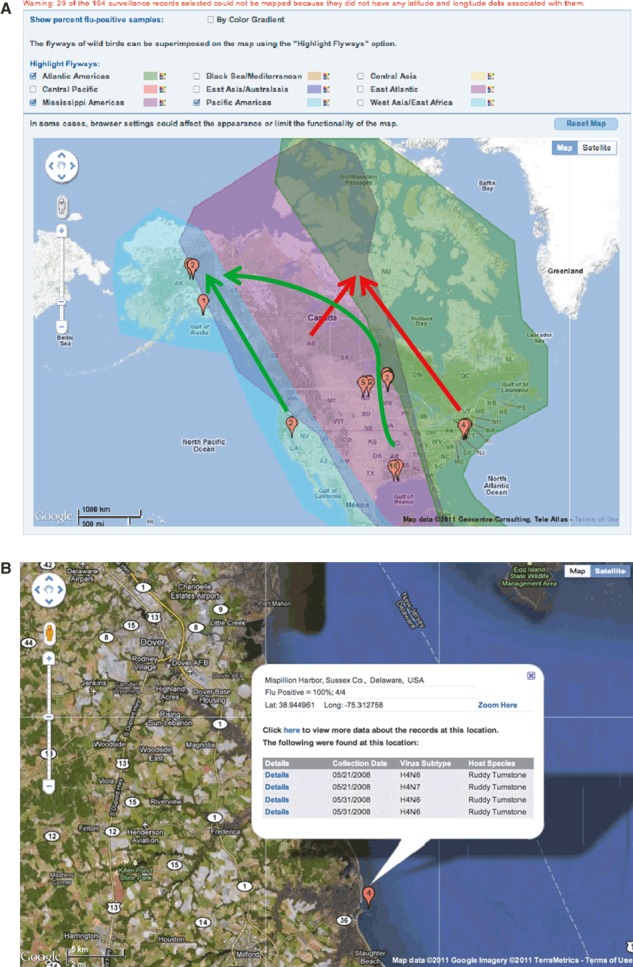
Google Map view of H4 flu‐positive avian surveillance sample isolation locations – Balloons show the geospatial location of surveillance sample isolation locations based on the latitude and longitude coordinates. Both geopolitical views (A) and satellite images (B) are available options, with custom zooming. Each balloon can be expanded to view more detailed information about the surveillance samples represented (B). Additional geospatial information (e.g., mapped avian migration flyways) can be overlaid to view the spatial relationships with surveillance sampling locations (A). Possible avian migration‐based influenza virus spreading routes suggested by the phylogenetic (Figure 3) and sequence alignment (Figure 4) analysis are indicated with red arrows for the Alberta duck/Delaware Bay shorebird clade and green arrows for the Texas, Minnesota, North Dakota, Alaska, and California duck clade (A).
Other IRD features of interest
The IRD offers numerous additional tools and data resources, including a data submission portal for the submission of sequences to GenBank, web interfaces for submission of surveillance and experiment data to the IRD, WHO vaccine strain lists dating back to the 1976 influenza season, influenza cellular infection life cycle pathways contributed to the Reactome 45 knowledgebase (http://www.reactome.com), PCR primer/probe set data for use in rapid detection and subtyping of influenza viruses in research applications, and antiviral drug information and links to other resources including the influenza reagents resources at the Biodefense and Emerging Infections Research Resources Repository (BEI, http://www.beiresources.org).
IRD surveillance use case
To illustrate how the query, analysis, and visualization tools available in IRD can be assembled into a workflow, we will demonstrate a comparative genomics analysis related to sequences derived from wild bird surveillance. This study will use IRD tools to identify and select the sets of sequence records, save these sets in a personal workbench, conduct the comparative sequence analysis, and visualize the result (Figure 7). In this use case, we examined the nucleotide differences in genomic segment 4 encoding HA proteins of the H4 subtype in two families of birds, Anatidae and Scolopacidae, utilizing surveillance metadata to help interpret the results.
Figure 7.
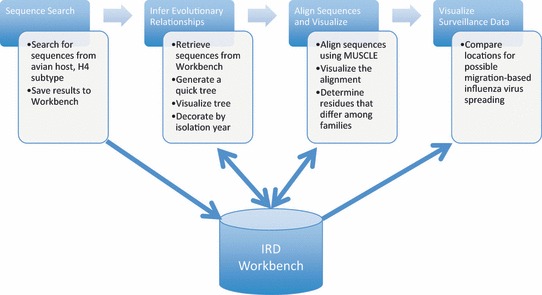
Overview of the Influenza Research Database (IRD) Use Case – The IRD use case consists of four steps – sequence search, phylogenetic analysis, sequence alignment, and Google Map visualization, which save data to and retried data from the IRD Workbench. Results of selected steps are shown in 3, 4, 5, 6.
Accessing data within IRD begins with selecting an appropriate search interface from the “Search Data” menu on the IRD home page. For our use case, we will focus on sequence records derived from “Animal Surveillance Data”. The “Animal Surveillance Data” search interface allows users to select surveillance samples based on the features, such as host species (avian or swine), geographical region, and sample collection date, and then obtain associated sequence records. We select samples from avian hosts, limit the search to samples that have been tested for the presence of influenza and found to be positive, and further limit to the subset for which sequence data are available (Figure 5A). We focus on samples having the H4 HA subtype, and limit the avian host species to aquatic ducks and shorebirds by selecting for their taxonomic families, Anatidae and Scolopacidae, respectively. This query yielded 162 surveillance records (July 2011) from the United States or Canada.
Utilizing the IRD workbench
In order to retain the results of our search for subsequent analysis, the IRD Workbench is used. To save the results of our previous search, we check the “Select all 162 results” box and click the “Add to Working Set” button, then provide a name for the working set when prompted. As the original search was for surveillance records, we are given the option of saving either the original set of surveillance records or sequence records directly related to them. Thus, we can choose to save strain (162 records), genomic segment (929 records), or encoded protein (1189 records) records. Because our next step will be to perform an analysis of the nucleotide sequences for HA (segment 4), we choose the “Create segment” option. The end result is a saved working set of HA nucleotide sequences from the 162 avian (H4) surveillance samples. Users may further refine the working set based on phylogenetic relationships by using the IRD TreePruner tool, 46 which enables users to iteratively trim a working set based on a quick phylogenetic tree.
Inferring evolutionary relationships
Next, we infer the evolutionary relationships of these HA sequences using the quick tree option. In the display of the tree (Figure 3), the terminal nodes were colored by year of isolation in 5‐year intervals using the advanced decoration option. This display shows that the majority of strains were isolated between 2005 and 2009 (labels colored red). These strains fall into two major branches: one that includes the strains isolated from New Jersey and Delaware shorebirds and one that includes the strains isolated from a variety of different duck species from Texas, North Dakota, Minnesota, Alaska, and California (Figure 3). Interestingly, the sequences most similar to the shorebird sequences are derived from older duck isolates (colored in various shades of blue) from Alberta (Figure 3C).
Aligning multiple sequences
We next align the sequences (using MUSCLE) in our working set. Visual inspection of the alignment highlights many residues in common among the shorebird and Alberta duck sequences, which distinguish these sequences from those of the other duck sequences from the United States (red arrows in Figure 4).
Visualizing with google maps
Next we chose “View on Map” from our original search results. We then colored the balloon locations by percent flu‐positive samples and highlight three different bird migratory flyways: “Atlantic Americas,”“Mississippi Americas,” and “Pacific Americas” (Figure 6A). Various Google Map features are supported, including the ability to change to a satellite image and zooming in to a particular location (Figure 6B). Selected balloons can also be expanded to show more detailed sample information. By combining the phylogenetic information of Figure 3 with the mapping information of Figure 6, we can hypothesize that the shorebirds of Delaware Bay and the ducks of Alberta may interact in the regions of migration flyway overlap in the northern Nunavut province of Canada to spread H4 influenza viruses.
Conclusion
The IRD (http://www.fludb.org) is a public BRC developed through support from the U.S. NIAID to support the bioinformatics needs of the influenza virus research community. IRD offers a comprehensive collection of common and novel data integrated with a suite of analysis and visualization tools. With the recent addition of the SFVT and Meta‐CATS tools, together with the earlier IRD Workbench and other capabilities, researchers can now piece together entire analysis pipelines to support data mining and association discovery as illustrated by the surveillance sequence analysis use case. The well‐integrated set of data types and analysis tools available in IRD are being used to assist in the development of vaccines, therapeutics, and diagnostics to mitigate the public health impact of seasonal flu and to predict and prevent the emergence of future influenza pandemics.
Acknowledgements
First and foremost, we would like to acknowledge the contribution of all providers of data to public database resources like GenBank and IRD. Without their efforts to generate the data and their willingness to make it freely available through public data repositories, the potential for the kind of comprehensive integrative data analysis illustrated here would not be possible. We have especially benefitted from collaborating with the NIAID‐funded Centers of Excellence for Influenza Research and Surveillance (CEIRS) who have been extremely helpful in developing data standards, identifying use cases, and sharing their data. We also acknowledge the generous support received from the NIAID – N01AI40041.
Re‐use of this article is permitted in accordance with the Terms and Conditions set out at http://wileyonlinelibrary.com/onlineopen#OnlineOpen_Terms
References
- 1. Greene JM, Collins F, Lefkowitz EJ et al. National institute of allergy and infectious diseases bioinformatics resource centers: new assets for pathogen informatics. Infect Immun 2007; 75:3212–3219. [DOI] [PMC free article] [PubMed] [Google Scholar]
- 2. Palese P, Shaw ML. Orthomyxoviridae: the viruses and their replication; in Fields BN, Knipe DM, Howley PM. (eds): Fields’ Virology. Philadelphia: Wolters Kluwer Health/Lippincott Williams & Wilkins, 2007; 1647–1689. [Google Scholar]
- 3. Kruse H, Kirkemo AM, Handeland K. Wildlife as source of zoonotic infections. Emerg Infect Dis 2004; 10:2067–2072. [DOI] [PMC free article] [PubMed] [Google Scholar]
- 4. World Health Organization . Influenza web page. Available at http://www.who.int/mediacentre/factsheets/fs211/en/ (Accessed 22 July 2011).
- 5. Fraser C, Donnelly CA, Cauchemez S et al. Pandemic potential of a strain of influenza A (H1N1): early findings. Science 2009; 324:1557–1561. [DOI] [PMC free article] [PubMed] [Google Scholar]
- 6. Louie JK, Acosta M, Winter K et al. Factors associated with death or hospitalization due to pandemic 2009 influenza A(H1N1) infection in California. JAMA 2009; 302:1896–1902. [DOI] [PubMed] [Google Scholar]
- 7. Johnson NP, Mueller J. Updating the accounts: global mortality of the 1918–1920 “Spanish” influenza pandemic. Bull Hist Med 2002; 76:105–115. [DOI] [PubMed] [Google Scholar]
- 8. Murray CJ, Lopez AD, Chin B et al. Estimation of potential global pandemic influenza mortality on the basis of vital registry data from the 1918–20 pandemic: a quantitative analysis. Lancet 2006; 368:2211–2218. [DOI] [PubMed] [Google Scholar]
- 9. Patterson KD, Pyle GF. The geography and mortality of the 1918 influenza pandemic. Bull Hist Med 1991; 65:4–21. [PubMed] [Google Scholar]
- 10. Squires B, Macken C, Garcia‐Sastre A et al. BioHealthBase: informatics support in the elucidation of influenza virus host pathogen interactions and virulence. Nucleic Acids Res 2007; 36(Database):D497–D503. [DOI] [PMC free article] [PubMed] [Google Scholar]
- 11. Bao Y, Bolotov P, Dernovoy D et al. The Influenza virus resource at the National Center for Biotechnology Information. J Virol 2008; 82:596–601. [DOI] [PMC free article] [PubMed] [Google Scholar]
- 12. Bogner P, Capua I, Lipman DJ et al. A global initiative on sharing avian flu data. Nature 2006; 442:981. [Google Scholar]
- 13. Yang S, Lee JY, Lee JS et al. Influenza sequence and epitope database. Nucleic Acids Res 2009; 37(Suppl 1):D423. [DOI] [PMC free article] [PubMed] [Google Scholar]
- 14. Chang S, Zhang J, Liao X et al. Influenza Virus Database (IVDB): an integrated information resource and analysis platform for influenza virus research. Nucleic Acids Res 2007; 35(Suppl 1):D376–D380. [DOI] [PMC free article] [PubMed] [Google Scholar]
- 15. Liechti R, Gleizes A, Kuznetsov D et al. OpenFluDB, a database for human and animal influenza virus. Database 2010; 2010:baq004. [DOI] [PMC free article] [PubMed] [Google Scholar]
- 16. Lees WD, Moss DS, Shepherd AJ. Analysis of antigenically important residues in human influenza a virus in terms of B‐cell epitopes. J Virol 2011; 85:8548–8555. [DOI] [PMC free article] [PubMed] [Google Scholar]
- 17. Baldo V, Baldovin T, Pellegrini M et al. Immunogenicity of three different influenza vaccines against homologous and heterologous strains in nursing home elderly residents. Clin Dev Immunol 2010; 2010:517198. [DOI] [PMC free article] [PubMed] [Google Scholar]
- 18. Gupta SK, Srivastava M, Akhoon BA et al. Identification of immunogenic consensus T‐cell epitopes in globally distributed influenza‐A H1N1 neuraminidase. Infect Genet Evol 2011; 11:308–319. [DOI] [PubMed] [Google Scholar]
- 19. Oh HL, Akerstrom S, Shen S et al. An antibody against a novel and conserved epitope in the hemagglutinin 1 subunit neutralizes numerous H5N1 influenza viruses. J Virol 2010; 84:8275–8286. [DOI] [PMC free article] [PubMed] [Google Scholar]
- 20. Prabakaran M, He F, Meng T et al. Neutralizing epitopes of influenza virus hemagglutinin: target for the development of a universal vaccine against H5N1 lineages. J Virol 2010; 84:11822–11830. [DOI] [PMC free article] [PubMed] [Google Scholar]
- 21. Bui HH, Peters B, Assarsson E, Mbawuike I, Sette A. Ab and T cell epitopes of influenza A virus, knowledge and opportunities. Proc Natl Acad Sci USA 2007; 104:246–251. [DOI] [PMC free article] [PubMed] [Google Scholar]
- 22. Sette A, Rappuoli R. Reverse vaccinology: developing vaccines in the era of genomics. Immunity 2010; 33:530–541. [DOI] [PMC free article] [PubMed] [Google Scholar]
- 23. Su CY, Cheng TJ, Lin MI et al. High‐throughput identification of compounds targeting influenza RNA‐dependent RNA polymerase activity. Proc Natl Acad Sci USA 2010; 107:19151–19156. [DOI] [PMC free article] [PubMed] [Google Scholar]
- 24. Abrahamyan A, Nagy E, Golovan SP. Human H1 promoter expressed short hairpin RNAs (shRNAs) suppress avian influenza virus replication in chicken CH‐SAH and canine MDCK cells. Antiviral Res 2009; 84:159–167. [DOI] [PubMed] [Google Scholar]
- 25. Beck ET, Henrickson KJ. Molecular diagnosis of respiratory viruses. Future Microbiol 2010; 5:901–916. [DOI] [PubMed] [Google Scholar]
- 26. Slomka MJ, Densham AL, Coward VJ et al. Real time reverse transcription (RRT)‐polymerase chain reaction (PCR) methods for detection of pandemic (H1N1) 2009 influenza virus and European swine influenza A virus infections in pigs. Influenza Other Respi Viruses 2010; 4:277–293. [DOI] [PMC free article] [PubMed] [Google Scholar]
- 27. He F, Du Q, Ho Y, Kwang J. Immunohistochemical detection of Influenza virus infection in formalin‐fixed tissues with anti‐H5 monoclonal antibody recognizing FFWTILKP. J Virol Methods 2009; 155:25–33. [DOI] [PubMed] [Google Scholar]
- 28. Sayers EW, Barrett T, Benson DA et al. Database resources of the National Center for Biotechnology Information. Nucleic Acids Res 2011; 39(Database issue):D38–D51. [DOI] [PMC free article] [PubMed] [Google Scholar]
- 29. The UniProt C . Ongoing and future developments at the Universal Protein Resource. Nucleic Acids Res 2011; 39(Suppl 1):D214–D219. [DOI] [PMC free article] [PubMed] [Google Scholar]
- 30. Vita R, Zarebski L, Greenbaum JA et al. The immune epitope database 2.0. Nucleic Acids Res 2010; 38(Suppl 1):D854–D862. [DOI] [PMC free article] [PubMed] [Google Scholar]
- 31. Berman H, Henrick K, Nakamura H. Announcing the worldwide Protein Data Bank. Nat Struct Mol Biol 2003; 10:980. [DOI] [PubMed] [Google Scholar]
- 32. Bateman A, Coin L, Durbin R et al. The Pfam protein families database. Nucleic Acids Res 2004; 32(Suppl 1):D138–D141. [DOI] [PMC free article] [PubMed] [Google Scholar]
- 33. Larsen M, Lundegaard C, Lamberth K, Buus S, Lund O, Nielsen M. Large‐scale validation of methods for cytotoxic T‐lymphocyte epitope prediction. BMC Bioinformatics 2007; 8:424. [DOI] [PMC free article] [PubMed] [Google Scholar]
- 34. Quevillon E, Silventoinen V, Pillai S et al. InterProScan: protein domains identifier. Nucleic Acids Res 2005; 33(Suppl 2):W116–W120. [DOI] [PMC free article] [PubMed] [Google Scholar]
- 35. Rice P, Longden I, Bleasby A. EMBOSS: the European Molecular Biology Open Software Suite. Trends Genet 2000; 16:276–277. [DOI] [PubMed] [Google Scholar]
- 36. Herraez A. Biomolecules in the computer: Jmol to the rescue. Biochem Mol Biol Educ 2006; 34:255–261. [DOI] [PubMed] [Google Scholar]
- 37. Throsby M, Van Den Brink E, Jongeneelen M et al. Heterosubtypic neutralizing monoclonal antibodies cross‐protective against H5N1 and H1N1 recovered from human IgM+ memory B cells. PLoS One 2008; 3:3942. [DOI] [PMC free article] [PubMed] [Google Scholar]
- 38. Ekiert D, Bhabha G, Elsliger M et al. Antibody recognition of a highly conserved influenza virus epitope. Science 2009; 324:246–251. [DOI] [PMC free article] [PubMed] [Google Scholar]
- 39. Wang T, Tan G, Hai R et al. Broadly protective monoclonal antibodies against H3 influenza viruses following sequential immunization with different hemagglutinins. PLoS Pathog 2010; 6:e100796. [DOI] [PMC free article] [PubMed] [Google Scholar]
- 40. Duvvuri VRSK, Moghadas SM, Guo H et al. Original Article: Highly conserved cross‐reactive CD4+ T‐cell HA‐epitopes of seasonal and the 2009 pandemic influenza viruses. Influenza Other Respi Viruses 2010; 4:249–258. [DOI] [PMC free article] [PubMed] [Google Scholar]
- 41. Guindon S, Dufayard J‐F, Lefort V, Anisimova M, Hordijk W, Gascuel O. New algorithms and methods to estimate maximum‐likelihood phylogenies: assessing the performance of PhyML 3.0. Syst Biol 2010; 59:307–321. [DOI] [PubMed] [Google Scholar]
- 42. Zmasek CM, Eddy SR. ATV: display and manipulation of annotated phylogenetic trees. Bioinformatics 2001; 17:383–384. [DOI] [PubMed] [Google Scholar]
- 43. Edgar RC. MUSCLE: multiple sequence alignment with high accuracy and high throughput. Nucleic Acids Res 2004; 32:1792–1797. [DOI] [PMC free article] [PubMed] [Google Scholar]
- 44. Waterhouse AM, Procter JB, Martin DM, Clamp M, Barton GJ. Jalview Version 2 – a multiple sequence alignment editor and analysis workbench. Bioinformatics 2009; 25:1189–1191. [DOI] [PMC free article] [PubMed] [Google Scholar]
- 45. Matthews L, Gopinath G, Gillespie M, Reactome knowledgebase of human biological pathways and processes. Nucleic Acids Res 2009; 37(Database):D619–D622. [DOI] [PMC free article] [PubMed] [Google Scholar]
- 46. Krishnamoorthy M, Patel P, Dimitrijevic M, Dietrich J, Green M, Macken C. Tree Pruner: an efficient tool for selecting data from a biased genetic database. BMC Bioinformatics 2011; 12:51. [DOI] [PMC free article] [PubMed] [Google Scholar]
- 47. Crooks GE, Hon G, Chandonia JM, Brenner SE. WebLogo: a sequence logo generator. Genome Res 2004; 14:1188–1190. [DOI] [PMC free article] [PubMed] [Google Scholar]