Abstract
Here we present a retrograde loading technique that makes it possible for the first time to rapidly load a calcium indicator in the majority of retinal ganglion cells (RGCs) in salamander retina, and then to observe physiological activity of these dye-loaded cells. Dextran-conjugated calcium indicator, dissolved in water, was applied to the optic nerve stump. Following dye loading, the isolated retina was mounted on a microelectrode array to demonstrate that electrical activity and calcium activity were preserved, as the retina responded to electrical stimuli.
Keywords: Retrograde, Calcium, Imaging, Electrical stimulation, Retinal ganglion cells, Retina, Dextran
1. Introduction
In order to optimize the design of implantable retinal prostheses, we needed a method to measure the activity of retinal ganglion cells (RGCs) in wholemount retina interfaced with prototype microelectrode arrays (MEAs). Of particular interest were the spatial response properties from cells directly over the stimulating electrode. Given the number of cells over the microelectrode (dozens) and the physical presence of the stimulating microelectrode, traditional multi-electrode recording methods could not make these measurements. Calcium imaging is a powerful tool for measuring the simultaneous activity of a population of neurons, especially where precise spatial localization is desired relative to a stimulation site. However, calcium imaging in mature neurons is often prevented by the difficulty of delivering the dye to the cytosol of these cells.
Little staining is seen in the mature retina (Wong and Oakley, 1996). Membrane-permeant acetoxymethyl-ester (AM-ester) calcium probes can readily be loaded in some neurons of young animals, for example, cortical neurons in rats younger than P7 (Regehr and Tank, 1991). Neonatal ferrets P10 and younger take up AM-esters into retinal neurons (Wong and Oakley, 1996). Unfortunately, the retina is not fully developed in young animals (before eye opening; Young, 1985). Seeking an alternative mode of delivery, we pursued retrograde dye loading, similar to a technique previously described (Zhan and Troy, 1997) for neurobiotin labeling of RGCs.
Our method incorporates three improvements on Zhan’s technique: specialized glue improves assembly; the eyecup is held stable in a chamber that isolates the dye from the saline medium; the eyecup is continuously superfused with very high turnover to maintain viability, just as in a recording chamber. With these improvements and the use of a salamander retina model, we have successfully imaged calcium activity in the majority of retinal ganglion cells in a wholemount preparation.
Other investigators have used a more localized form of retrograde loading in the retina. A small portion of RGCs can be retrogradely stained by cutting a slit on the surface of the retina (ferret age P10–P30) with a super sharp blade and applying 1–3 μL of Fura-2 AM 1 μg/μL in DMSO (Wong and Oakley, 1996). Piercing the retina with a dye-laden syringe needle introduced dextran-conjugated calcium indicator into RGC axons (Baldridge, 1996). These previous methods for applying calcium indicators to RGC axons have only labeled a small population of cells affected by the local disruption of axons. Bath loading of AM-esters is difficult in the mature retina, and not selective to RGCs regardless of the loading conditions.
Thus, until now, no approach has stained a significant fraction of the RGCs with a calcium indicator in a mature retina. Here, we report a new in vitro retrograde loading approach that rapidly and selectively labels the majority of RGCs. When applied to the wholemount retina of larval tiger salamanders, which have fully developed retinas, we have been able to directly monitor electrical activity and correlate it with calcium activity in individual RGCs. This new method of studying electrical activation of retinal cells enables simultaneous measurement of multiple cells directly over the stimulating electrode, a measurement not possible by any other means. With different imaging equipment this loading technique could permit novel retina physiology experiments to study vision.
2. Materials and methods
2.1. Overview
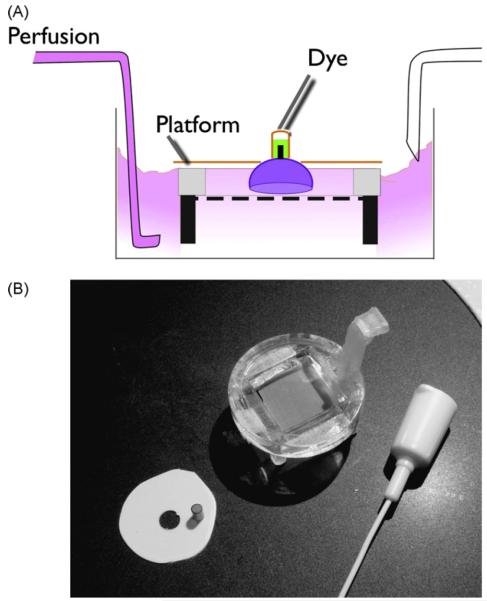
The optic nerve stump of the eyecup preparation is exposed to a solution of dye. A small segment of tubing to contain the dye is first glued to the back of the eye encompassing the optic nerve stump of the enucleated eye. The eyecup is held in a fixture keeping the retina submerged in oxygenated saline medium at near-physiologic conditions while the optic nerve and tubing with dye are kept above the fill level of saline.
2.2. Incubation assembly
The retrograde assembly (Fig. 1) is made from readily available materials. Tubing segments are cut from thin-wall polyethylene or polyimide. A collar, which is applied around the posterior portion of the eyecup, is made from polystyrene weighing boats by drilling a small hole in the boat and cutting out a disk about this hole. An incubation chamber can be made from nylon screen from a cell culture insert, an electroporation cuvette, and culture dishes. A tubing segment and a collar are glued with alkoxyethyl cyanoacrylate (Loctite 403, distributed by McMaster Carr) during preparation of the eyecup. The choice of this particular adhesive is important to avoid the vapor-deposition of cyanoacrylate (Wargacki et al., 2007), associated with common forms of this superglue.
Fig. 1.
The eye cup is held in a compact superfusion chamber during retrograde dye loading to the RGCs. (A) Dye dissolved in water is held on the optic nerve stump with a small segment of tubing. The eyecup is held inverted on a chair platform having a nylon screen. (B) The chair platform is shown next to the tubing segment and plastic collar that are glued onto the eyecup to form the retrograde assembly. A teflon syringe needle is used to dispense the fluorescent dye.
2.3. Retina preparation
Larval tiger salamander (Ambystoma tigrinum) eyes were hemisected with a razor blade, in a custom-made holding block, immediately after enucleation. Connective tissue was removed around the optic nerve stump, while submerged in calcium-free medium. The optic nerve was trimmed to 0.5 mm in length. The eyecup was then taken from the saline-filled dissection dish and placed retina-side-down on the lid of a culture dish. Excess saline was blotted away while holding the eyecup with fine forceps. Immediately, one face of the tubing segment was swabbed across a thin smear of glue, and placed onto the eyecup encompassing the optic nerve stump. Fluorescent dye (20 mM, 1.5 μL) was quickly pipetted into the tube to fill above the nerve ending. A thin layer of glue was applied to the perimeter of the hole in the collar, which was gently placed around the tubing segment onto the eyecup, and let dry 15 s. Gripping the collar, the assembly was transferred to the pre-wetted incubation platform and superfused at 5 mL/min in a volume of less than 3 mL, for a period of at least 2 h. All procedures were carried out at 23–24 °C. Mammalian retina preparations were similar, except that the tubing and collar were glued to the whole enucleated eye before hemisecting with dissection scissors.
Animal protocols were approved by the Institutional Animal Care and Use Committee at the University of Southern California. Larval Tiger salamanders (Charles D. Sullivan Co., Inc., Nashville, TN) were maintained at 8 °C until use, and euthanized by rapid decapitation and bilateral pithing of the spinal cord. Early post-natal Long Evans rats were rapidly decapitated. Adult Long Evans rats (Harlan, Indianapolis, IN) were deeply anesthetized with ketamine (80 mg/kg) and xylazine (8 mg/kg) by intramuscular injection, and rapidly decapitated.
2.4. Imaging
Calcium imaging was performed on an inverted epifluorescence microscope using a Nikon PlanApo 0.75 NA 20× objective, and an Andor Ixon electron multiplied CCD camera. Fluorescence filters were from Semrock, set # FITC-3540B. Transparent MEAs were fabricated by the authors at the University of Southern California Keck Center for Photonics. Arrays were composed of patterned indium-tin-oxide (ITO) on #1 cover glass substrates. An insulation layer of silicon-nitride was patterned over the ITO to open the electrode surfaces, and contact pads on the perimeter of the substrate.
2.5. Electrophysiology
Electrical stimulation thresholds of RGCs were measured via calcium imaging by delivering a sequence of progressively increasing charge-balanced biphasic pulses to a single electrode. Each stimulus event was a rapid burst of 40 biphasic pulses within 120 ms. The repetitive image acquisition period was 100 ms. The burst of pulses was intended to evoke a burst of spikes to bring calcium influx to a detectable level. We estimate that the concentration of indicator in the soma was roughly 5 μM, resulting in a very low calcium-binding ratio (see Section 4). To maximize signal strength we chose a high affinity calcium indicator that is bright and resists photobleaching, namely Oregon Green-488-BAPTA-1 dextran. Alternatively, a ratiometric indicator such as Fura-2 could be used to more accurately measure changes in calcium, rather than calcium influx.
Average pixel intensity of each cell was extracted with Meta-morph (regions of interest for each cell were slightly smaller than the soma diameter), and processed in Matlab to detect transient rises in the fluorescence, temporally correlated with a stimulus burst. Each stimulus burst was delivered 25 times on 2-s intervals. A dose response curve for each cell was fitted with a sigmoid to calculate threshold, where a stimulus has a 50% chance of evoking a calcium response within the 25 replicates of fixed amplitude.
In dual (optical/extracellular) recording experiments, a 10-μm electrode was stimulated by a train of 40 cathodic voltage pulses, 100-μs pulse width. Spikes were recorded on distant electrodes with an MEA1060-BC (Multichannel Systems, GmbH) amplifier. Stimulus artifact from a spike-free pulse was subtracted from other waveforms containing a spike according to Sekirnjak et al. (2006). Spikes were detected by setting a detection threshold at three times the RMS noise level. Singular value decomposition was applied to the set of spikes in Matlab, and two clusters were identified by separation of the waveforms by scores along the first two principal components as described (Lewicki, 1998).
2.6. Materials
Fluorescent dyes, Alexafluor-594 hydrazide salt (Alexa-594), Oregon Green-488-BAPTA-1 (OGB-1) hexapotassium salt, and Oregon Green-488-BAPTA-1 dextran 10 kDa, were purchased from Invitrogen (Carlsbad, CA). All other reagents were from Sigma–Aldrich (Saint Louis, MO). Superfusate for salamander contained (in mM): 110 NaCl, 2 KCl, 1.6 MgCl2 30 NaHCO3, 1.5 CaCl2, 0.01 EDTA, 10 glucose, equilibrated with 5% CO2 95% O2, adjusted to pH 7.40, and 270–275 mOsm. Dissection medium was identical except with additional MgCl2 substituted for CaCl2. Calcium was omitted during preparation of the eyecup to avoid calcium-dependent resealing of the optic nerve (McNeil, 2002; Yawo and Kuno, 1985). Superfusate for rat was Ames medium, buffered with 1.9 g/L NaHCO3, equilibrated with 5% CO2 95% O2, pH 7.40. Probenecid (2.5 mM) was sometimes added to the superfusate when using calcium indicators, and final pH adjusted to 7.40. Probenecid did not noticeably enhance staining for the salamander.
3. Results
Two hours of retrograde loading in the eyecup stained axons and many ganglion cell somata. At this point, the retina was isolated and mounted on the MEA recording chamber for complete filling of RGC somata from the reservoir of dye in the axons. This secondary incubation outside the eyecup also helped to reduce background fluorescence, possibly from dye that leaked from the optic disk. A total of 4–6 h was necessary to achieve adequate staining of somata at 2 mm from the optic disk. The RGC density (Fig. 2) stained with the calcium indicator was 1460 ± 270 cells/mm2 (mean±S.D.), which is consistent with thorough counts of 1400 cells/mm2 obtained by retrograde tracing, optic nerve sectioning, and recordings (Segev et al., 2004). Dendritic arbors of the RGCs were also stained, and calcium transients were prominent in the proximal dendrites of the most brightly stained RGCs. With two-photon imaging it may be possible to investigate synaptic connections in these labeled cells (Reid et al., 2001; Yuste and Denk, 1995).
Fig. 2.
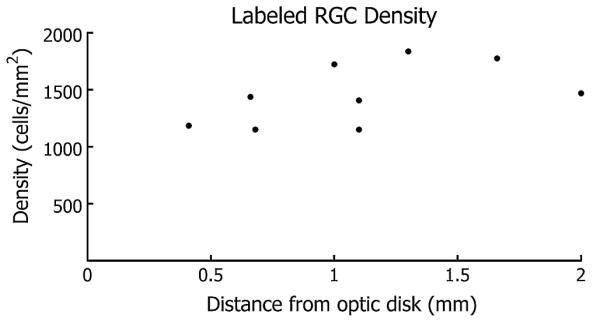
Salamander retina labeled with Oregon Green-BAPTA-1-dextran 10 kDa, RGC density as a function of position from the optic nerve. Fluorescing axon bundles obscure some somata with increasing proximity to the optic disk.
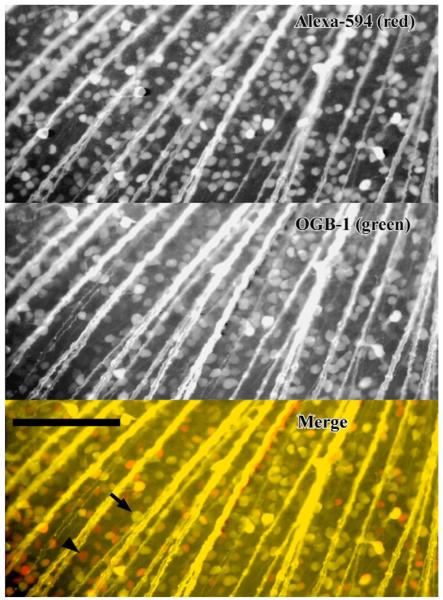
Double labeling (Fig. 3) with an equimolar mixture (15 mM final) of the fluorophore Alexa-594 hydrazide salt (759 g/mol) and the indicator OGB-1 dextran (10,000 g/mol) revealed greater brightness and 2.4 times greater contrast with Alexa-594. Cells labeled with OGB-1 dextran, whether bright or dim, were all co-labeled with Alexa-594. Cell density with Alexa-594 was 1450 cell/mm2 in Fig. 3. Therefore, only RGCs were stained with either dye, while some RGCs were weakly stained with OGB-1 dextran due to its slower diffusion. The standard deviation in background-subtracted intensity for somata (n = 386) was 0.70 and 0.53 normalized to the mean for OBG-1 dextran and Alexa-594, respectively. Staining was significantly more variable (p < 0.001, F-test) for OGB-1 dextran.
Fig. 3.
Salamander retina retrogradely stained with a mixture of Alexa-594 (top) and Oregon Green-BAPTA-1-dextran 10 kDa (middle). In the merged image (bottom), staining is brighter with unconjugated Alexa 594 (red cells); some red cells (arrow head) did not have visible staining with the calcium indicator, but all Oregon Green-labeled cells were co-stained with Alexa 594 (yellow cells, arrow). Scale bar 200 μm. (For interpretation of the references to colour in this figure legend, the reader is referred to the web version of the article.)
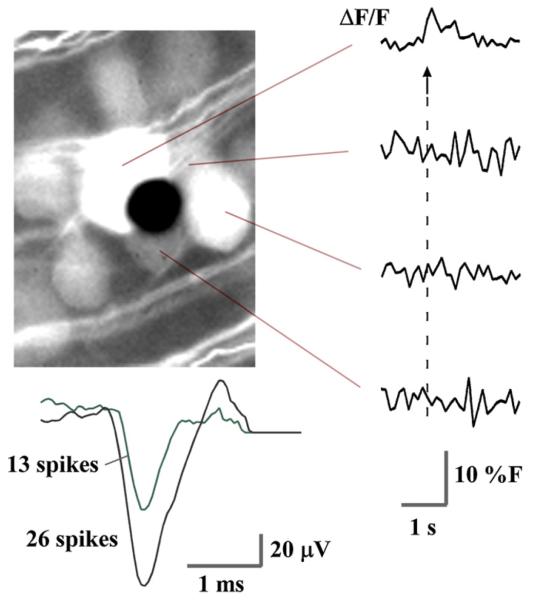
Calcium transients, recorded from the stained RGCs in the wholemount, were correlated with spiking activity in the same cells (Fig. 4). We stimulated RGC somata by nearby electrodes and by distant electrodes via antidromic propagation of the spike. Extracellular potentials were simultaneously recorded by 10-μm electrodes, along with the calcium signals. Unique spike waveforms were separated by principal components analysis. Stimulating with 40 pulses at near-threshold amplitude evoked spikes from two neurons (Fig. 4), while only one of the four neurons (Fig. 4, top trace) near the recoding electrode exhibited a calcium response. Single spikes did not elevate the calcium fluorescence signal above the noise, but eliciting a rapid burst of 20–40 spikes resulted in a strong fluorescence increase.
Fig. 4.
Calcium bursting was correlated with a rapid series of evoked spikes (arrow). Near the stimulation threshold, only one RGC shows a calcium response (top fluorescence trace), while the electrode (black dot) detects spikes from two neurons in the cluster of cells. Spike traces were separated by principal components analysis into 2 clusters of 13 and 26 spikes, and then averaged. Calcium traces are raw data.
Calcium signals rose to full magnitude within two acquisition frames (200 ms) of the stimulation onset, which lasted 120 ms. Fluorescence decayed with a time constant of 0.75 s ± S.E.M. (somata; n = 84) and 0.57 s ± 0.05 S.E.M. (axon bundles; n = 9).
Fluorescence signals were entirely abolished (118 somata, 12 axon bundles) within minutes of applying 1-mM CdCl2 to the superfusate (Fig. 5). Applying 1-μM tetrodotoxin (TTX) in a separate experiment abolished responses to electrical stimulation in over 80% of RGCs over a 200-μm electrode (n = 84). The remaining cells roughly doubled in threshold (×1.9 ± 0.1, mean±S.E.M.; n =16), and were located only on the electrode surface. One out of 9 axon bundles responded in the presence of TTX, with a 2.2-fold increase in threshold. Remnant calcium responses were likely due to depolarization suprathreshold for voltage-gated calcium channels, as the increase in threshold was consistent with the relative activation potentials for voltage-gated sodium and calcium currents in RGCs (Lipton and Tauck, 1987).
Fig. 5.
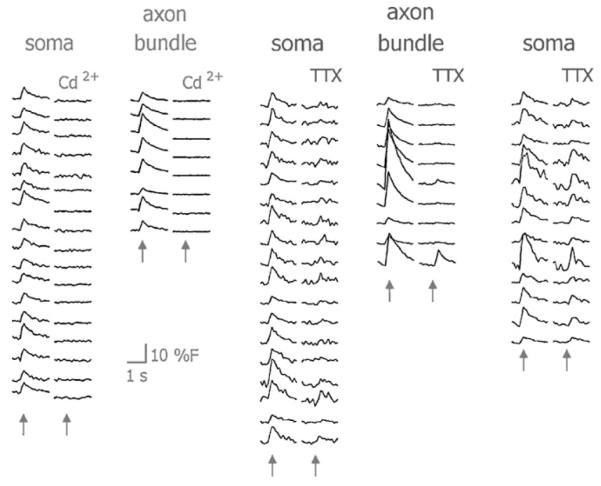
Left: cadmium abolished all calcium responses from axon bundles and somata. Middle: TTX abolished responses from most RGCs, and all axon bundles except for one (bottom trace). Right: persistent calcium responses with TTX doubled in threshold and decreased slightly in magnitude. Traces were averaged over 25 stimulus events. Arrows mark stimulus times.
3.1. Stimulation threshold mapping
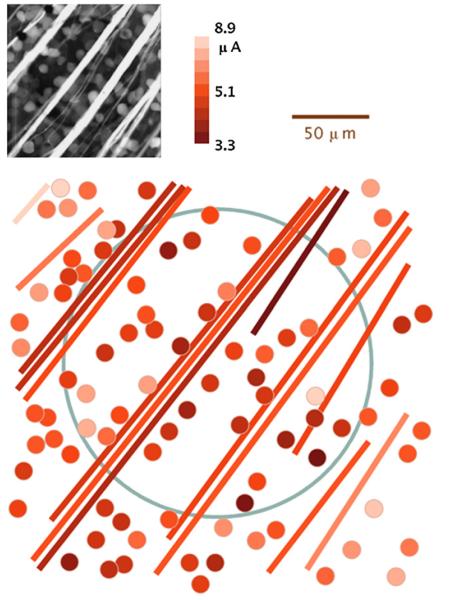
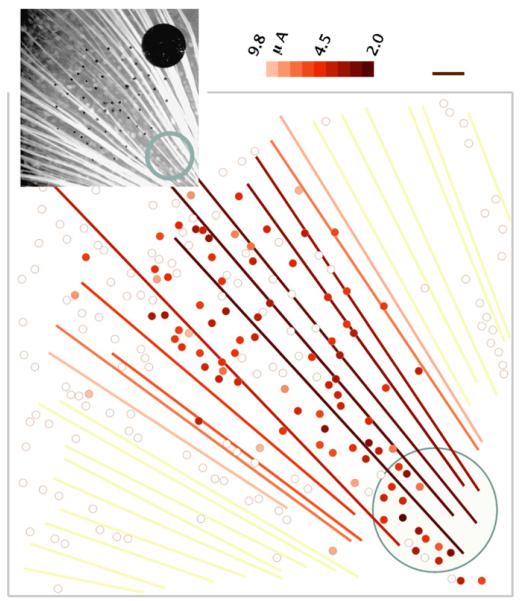
Threshold for every RGC near the stimulation site was calculated from the response of each cell to a range of pulse amplitudes. Average threshold on the electrode was 4.52±0.15 μA (mean±S.E.M.; n = 98) for a 400-μs cathodic-first biphasic pulse, corresponding to a charge of 1.8 nC and charge density of 5.8 μC/cm2 on the 200-μm electrode. This threshold is about sixfold lower than that required to stimulate cells 187 μm from the electrode in a previous study (Ahuja et al., 2008). Our average threshold charge is comparable to that in a study of 125-μm electrodes in rabbit retina (Jensen et al., 2005), which found thresholds of 0.22 nC for short latency and 2.2 nC for long latency activation of RGCs with 0.5-ms pulses. Mapping the thresholds over the stimulation site (Figs. 6 and 7) revealed heterogeneity in RGC threshold over the surface of the electrode and a trend toward increased threshold for cells farther from the electrode. Axon bundles could be easily stimulated in addition to somata. Axon bundle stimulation was marked by a strong fluorescence increase from the bundle and a streak of soma responses peripheral to the stimulating electrode (Fig. 7).
Fig. 6.
Threshold map for somata (dots) and axon bundles (lines) over a transparent electrode (blue outline), stimulated by 400-μs, cathodic-first biphasic pulses. (For interpretation of the references to colour in this figure legend, the reader is referred to the web version of the article.)
Fig. 7.
Threshold map showing a streak of antidromic stimulation from a 200-μm electrode (blue outline), 400-μs pulse width. Color indicates threshold current. Small black dots are 10-μm electrodes. Scale bar 50 μm. (For interpretation of the references to colour in this figure legend, the reader is referred to the web version of the article.)
3.2. Choice of animal model
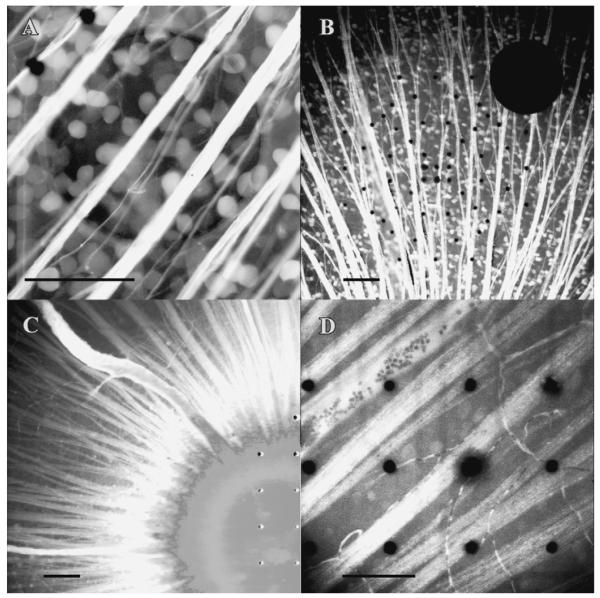
The quality of staining with calcium indicators was affected by the choice of animal model and the age of the animal (Fig. 8). We have achieved satisfactory results in salamanders (Fig. 8A and 9) and in rats less than a week of age. The salamander retina is fully developed in the larval stage, and thus we chose this as a model for retinal stimulation. After eye opening in the rat, neither the potassium salt nor the dextran-conjugate of OGB-1 stained the retina beyond the optic disk. Adding 2.5-mM probenecid to the perfusate slightly improved staining in the rat. We also attempted to improve dye retention by mixing probenecid with OGB-1-dextran 10 kDa before applying it to the optic nerve stump, which yielded only marginal improvement. There appears to be an export mechanism in adult rat RGCs unabated by probenecid and dextran conjugation at 10 kDa.
Fig. 8.
(A) Salamander RGCs stained with Oregon Green-BAPTA-1-dextran 10 kDa, on a microelectrode array. The ITO electrode (200-μm) is centered in the field of view, with two 10-μm plated electrodes in the upper left. (B–D) Rat retina stained with Oregon Green-BAPTA-1-dextran 10 kDa, at age P6, eye opening, and P45, respectively. The inability of the mature mammalian retina to retain the indicator is illustrated by the paucity of stained somata in (C) versus (B). Probenecid (2.5 mM) was added to the superfusate in (B–D). Potassium probenecid was added to the retrograde dye solution in (C) (10 mM) and in (D) (60 mM). Scale bars 100 μm.
Fig. 9.
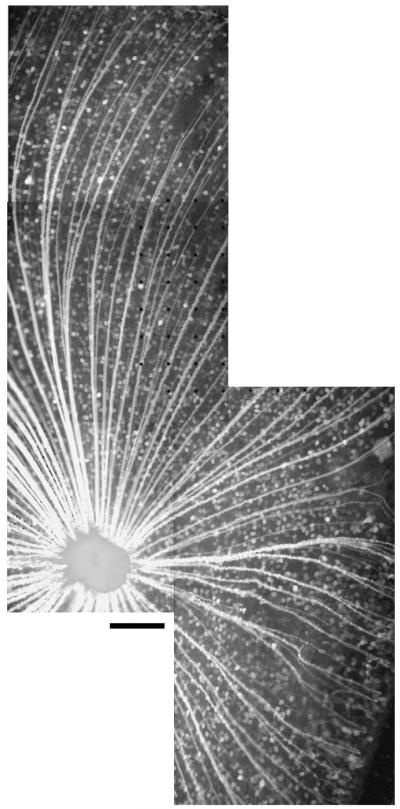
Wholemount stitched image of a salamander retina stained with Oregon Green-BAPTA-1-dextran 10 kDa. Scale bar 200 μm.
4. Discussion
Calcium imaging in the mature retina is not trivial, due to the difficulty in using AM-ester conjugates. Other investigators have observed that Müller cells, pericytes, and endothelial cells preferentially stain with calcium indicators (Wong, 1998), and thus the difficulty in labeling RGCs in older animals with AM-ester calcium indicators has been attributed to reduced uptake in older neurons. To bypass membrane permeability in RGCs, we considered retrograde dye loading. Unfortunately, we have found that when the unconjugated potassium salt form of OGB-1 is retrogradely loaded via the optic nerve stump, it is excluded from RGC somata. In contrast, less highly charged tracer dyes were not.
We then hypothesized that the main reason for the poor staining is that the dye is pumped out of the cells, due to its being a highly negatively charged organic anion. Indeed, addition of probenecid (Di Virgilio et al., 1988; Khamdang et al., 2004), an organic anion transport blocker, did improve retention of the calcium indicator in axons and somata. Unfortunately, probenecid was only partially effective, as enough dye was externalized to the make background fluorescence very high compared to the intracellular fluorescence.
These observations led us to investigate the use of dextran-conjugated dyes, which should not be pumped out of the cytoplasm. The dextran conjugate of OGB-1 successfully stained RGCs in the salamander retina and young rat retina, but not in the mature rat retina.
Dextran conjugates are readily taken up by cells at an injection site and make excellent neural pathway tracers (Reiner et al., 2000), conveyed by diffusion (Fritzsch, 1993). In retrograde tracer studies, the axon uptake site was typically remote form the retina (Dacey et al., 2003; Drager and Olsen, 1981; Sarthy et al., 1983; Yan et al., 1999), necessitating a survival period of several days to stain cell bodies. Retrograde loading in vitro stains more cells on a shorter time scale than injection to cortical projections of RGCs.
We estimated the concentration of dye reaching the soma by solving the diffusion equation in one-dimension
The axon length was 2 mm, terminated by a constant concentration of 20 mM on the cut end. The opposite end of the axon was terminated by the soma with a radius of 6 μm. Concentration of the dye was considered uniform through the soma volume, since its diameter is far less than the length of the axon. The concentration inside the soma φsoma is the time integral of diffusive flux J into the soma, scaled by the soma volume V and axon area A, and thus the boundary condition can be expressed as:
The diffusion constant for OBG-1 dextran was assumed to be 15 μm2/s (Seksek et al., 1997). The finite element model was solved using COMSOL Multiphysics ver 3.2 (COMSOL, Burlington, MA). After 4 h of retrograde loading, the somatic concentration reached 3.6 μM and 13 μM for axon diameters of 0.5 μm and 1.0 μm, respectively.
Assuming a resting calcium level ([Ca2]i) of 75 nM and indicator concentration ([BT]) of 5 μM, the binding ratio for OGB-1 (kd = 0.17 μM) is κB = 14, given by (Neher, 1995)
The time course of the fluorescence signal is probably not being altered by OGB-1, assuming the endogenous calcium-binding ratio is much larger than 14. In mouse RGCs the endogenous calcium-binding ratio is 87–122, with a time constant of 1.7 s (Mann et al., 2005), and a calcium extrusion rate of 52 s−1. Our time constant was 0.75 s, leading us to believe that in salamander the endogenous binding ratio is lower and/or the extrusion rate is higher than in mouse.
Using this dye loading method, visual processing in the retina could be studied with high spatiotemporal resolution by two-photon microscopy. Parallel imaging of many cells would be a natural advancement of prior multiphoton studies (Denk and Detwiler, 1999) involving a single labeled cell. The infrared excitation source would not interact with photoreceptors, thus permitting optical stimulation. Such an experiment could be implemented on an inverted two-photon microscope, with images presented to the photoreceptors via the condenser or a water immersion objective above the retina.
Work remains to be done for mature mammalian retinas. New inhibitors of organic anion transporters may be needed, or transgenic animals that do not express the pertinent transporters into maturity may be required. In addition to calcium imaging, the retrograde technique may find application in counting RGCs in glaucoma models. For cell counting, a nuclear stain may be more appropriate than tracer dyes because the axon bundles can easily obscure cells near to the optic disk.
The retrograde loading method presented here is a rapid means to complete labeling of RGCs with calcium indicators. We have demonstrated that our retrograde loading process preserves electrophysiological activity, and moreover that neuronal activity can be observed in virtually all RGCs in a mature retina, with unambiguous identification of cell locations. We are using threshold maps, as shown in this article, to study how electrical stimulation interacts with the retina to produce a response in the ganglion cells.
Acknowledgements
We thank AP Sampath, Chris Sekirnjak, Bruce Brown, and Cheryl Craft for helpful advice. M. Behrend is supported by the Fannie and John Hertz Foundation. We are grateful for generous support from the Barbara Smith Rose family and the Chow family and friends. This work supported by the National Science Foundation grant #EEC-0310723, the WM Keck Foundation, and the Albaugh trust.
References
- Ahuja AK, Behrend MR, Kuroda M, Humayun MS, Weiland JD. An in vitro model of a retinal prosthesis. IEEE Trans Biomed Eng. 2008;55:1744–53. doi: 10.1109/tbme.2008.919126. [DOI] [PMC free article] [PubMed] [Google Scholar]
- Baldridge WH. Optical recordings of the effects of cholinergic ligands on neurons in the ganglion cell layer of mammalian retina. J Neurosci. 1996;16:5060–72. doi: 10.1523/JNEUROSCI.16-16-05060.1996. [DOI] [PMC free article] [PubMed] [Google Scholar]
- Dacey DM, Peterson BB, Robinson FR, Gamlin PD. Fireworks in the primate retina: in vitro photodynamics reveals diverse LGN-projecting ganglion cell types. Neuron. 2003;37:15–27. doi: 10.1016/s0896-6273(02)01143-1. [DOI] [PubMed] [Google Scholar]
- Denk W, Detwiler PB. Optical recording of light-evoked calcium signals in the functionally intact retina. Proc Natl Acad Sci USA. 1999;96:7035–40. doi: 10.1073/pnas.96.12.7035. [DOI] [PMC free article] [PubMed] [Google Scholar]
- Di Virgilio F, Steinberg TH, Swanson JA, Silverstein SC. Fura-2 secretion and sequestration in macrophages. A blocker of organic anion transport reveals that these processes occur via a membrane transport system for organic anions. J Immunol. 1988;140:915–20. [PubMed] [Google Scholar]
- Drager UC, Olsen JF. Ganglion cell distribution in the retina of the mouse. Invest Ophthalmol Visual Sci. 1981;20:285–93. [PubMed] [Google Scholar]
- Fritzsch B. Fast axonal diffusion of 3000 molecular weight dextran amines. J Neurosci Methods. 1993;50:95–103. doi: 10.1016/0165-0270(93)90060-5. [DOI] [PubMed] [Google Scholar]
- Jensen RJ, Ziv OR, Rizzo JF., III Thresholds for activation of rabbit retinal ganglion cells with relatively large, extracellular microelectrodes. Invest Ophthalmol Vis Sci. 2005;46:1486–96. doi: 10.1167/iovs.04-1018. [DOI] [PubMed] [Google Scholar]
- Khamdang S, Takeda M, Shimoda M, Noshiro R, Narikawa S, Huang XL, et al. Interactions of human- and rat-organic anion transporters with pravastatin and cimetidine. J Pharmacol Sci. 2004;94:197–202. doi: 10.1254/jphs.94.197. [DOI] [PubMed] [Google Scholar]
- Lewicki MS. A review of methods for spike sorting: the detection and classification of neural action potentials. Network (Bristol, England) 1998;9:R53–78. [PubMed] [Google Scholar]
- Lipton SA, Tauck DL. Voltage-dependent conductances of solitary ganglion cells dissociated from the rat retina. J Physiol. 1987;385:361–91. doi: 10.1113/jphysiol.1987.sp016497. [DOI] [PMC free article] [PubMed] [Google Scholar]
- Mann M, Haq W, Zabel T, Guenther E, Zrenner E, Ladewig T. Age-dependent changes in the regulation mechanisms for intracellular calcium ions in ganglion cells of the mouse retina. Eur J Neurosci. 2005;22:2735–43. doi: 10.1111/j.1460-9568.2005.04475.x. [DOI] [PubMed] [Google Scholar]
- McNeil PL. Repairing a torn cell surface: make way, lysosomes to the rescue. J Cell Sci. 2002;115:873–9. doi: 10.1242/jcs.115.5.873. [DOI] [PubMed] [Google Scholar]
- Neher E. The use of fura-2 for estimating Ca buffers and Ca fluxes. Neuropharmacology. 1995;34:1423–42. doi: 10.1016/0028-3908(95)00144-u. [DOI] [PubMed] [Google Scholar]
- Regehr WG, Tank DW. Selective fura-2 loading of presynaptic terminals and nerve cell processes by local perfusion in mammalian brain slice. J Neurosci Methods. 1991;37:111–9. doi: 10.1016/0165-0270(91)90121-f. [DOI] [PubMed] [Google Scholar]
- Reid CA, Fabian-Fine R, Fine A. Postsynaptic calcium transients evoked by activation of individual hippocampal mossy fiber synapses. J Neurosci. 2001;21:2206–14. doi: 10.1523/JNEUROSCI.21-07-02206.2001. [DOI] [PMC free article] [PubMed] [Google Scholar]
- Reiner A, Veenman CL, Medina L, Jiao Y, Del Mar N, Honig MG. Pathway tracing using biotinylated dextran amines. J Neurosci Methods. 2000;103:23–37. doi: 10.1016/s0165-0270(00)00293-4. [DOI] [PubMed] [Google Scholar]
- Sarthy PV, Curtis BM, Catterall WA. Retrograde labeling, enrichment, and characterization of retinal ganglion cells from the neonatal rat. J Neurosci. 1983;3:2532–44. doi: 10.1523/JNEUROSCI.03-12-02532.1983. [DOI] [PMC free article] [PubMed] [Google Scholar]
- Segev R, Goodhouse J, Puchalla J, Berry MJ., II Recording spikes from a large fraction of the ganglion cells in a retinal patch. Nat Neurosci. 2004;7:1154–61. doi: 10.1038/nn1323. [DOI] [PubMed] [Google Scholar]
- Sekirnjak C, Hottowy P, Sher A, Dabrowski W, Litke AM, Chichilnisky EJ. Electrical stimulation of mammalian retinal ganglion cells with multielectrode arrays. J Neurophysiol. 2006;95:3311–27. doi: 10.1152/jn.01168.2005. [DOI] [PubMed] [Google Scholar]
- Seksek O, Biwersi J, Verkman AS. Translational diffusion of macromolecule-sized solutes in cytoplasm and nucleus. J Cell Biol. 1997;138:131–42. doi: 10.1083/jcb.138.1.131. [DOI] [PMC free article] [PubMed] [Google Scholar]
- Wargacki SP, Lewis LA, Dadmun MD. Understanding the chemistry of the development of latent fingerprints by superglue fuming. J Forensic Sci. 2007;52:1057–62. doi: 10.1111/j.1556-4029.2007.00527.x. [DOI] [PubMed] [Google Scholar]
- Wong RO. Calcium imaging and multielectrode recordings of global patterns of activity in the developing nervous system. Histochem J. 1998;30:217–29. doi: 10.1023/a:1003251504594. [DOI] [PubMed] [Google Scholar]
- Wong RO, Oakley DM. Changing patterns of spontaneous bursting activity of on and off retinal ganglion cells during development. Neuron. 1996;16:1087–95. doi: 10.1016/s0896-6273(00)80135-x. [DOI] [PubMed] [Google Scholar]
- Yan Q, Wang J, Matheson CR, Urich JL. Glial cell line-derived neurotrophic factor (GDNF) promotes the survival of axotomized retinal ganglion cells in adult rats: comparison to and combination with brain-derived neurotrophic factor (BDNF) J Neurobiol. 1999;38:382–90. doi: 10.1002/(sici)1097-4695(19990215)38:3<382::aid-neu7>3.0.co;2-5. [DOI] [PubMed] [Google Scholar]
- Yawo H, Kuno M. Calcium dependence of membrane sealing at the cut end of the cockroach giant axon. J Neurosci. 1985;5:1626–32. doi: 10.1523/JNEUROSCI.05-06-01626.1985. [DOI] [PMC free article] [PubMed] [Google Scholar]
- Young RW. Cell differentiation in the retina of the mouse. Anat Rec. 1985;212:199–205. doi: 10.1002/ar.1092120215. [DOI] [PubMed] [Google Scholar]
- Yuste R, Denk W. Dendritic spines as basic functional units of neuronal integration. Nature. 1995;375:682–4. doi: 10.1038/375682a0. [DOI] [PubMed] [Google Scholar]
- Zhan XJ, Troy JB. An efficient method that reveals both the dendrites and the soma mosaics of retinal ganglion cells. J Neurosci Methods. 1997;72:109–16. doi: 10.1016/s0165-0270(96)02172-3. [DOI] [PubMed] [Google Scholar]


