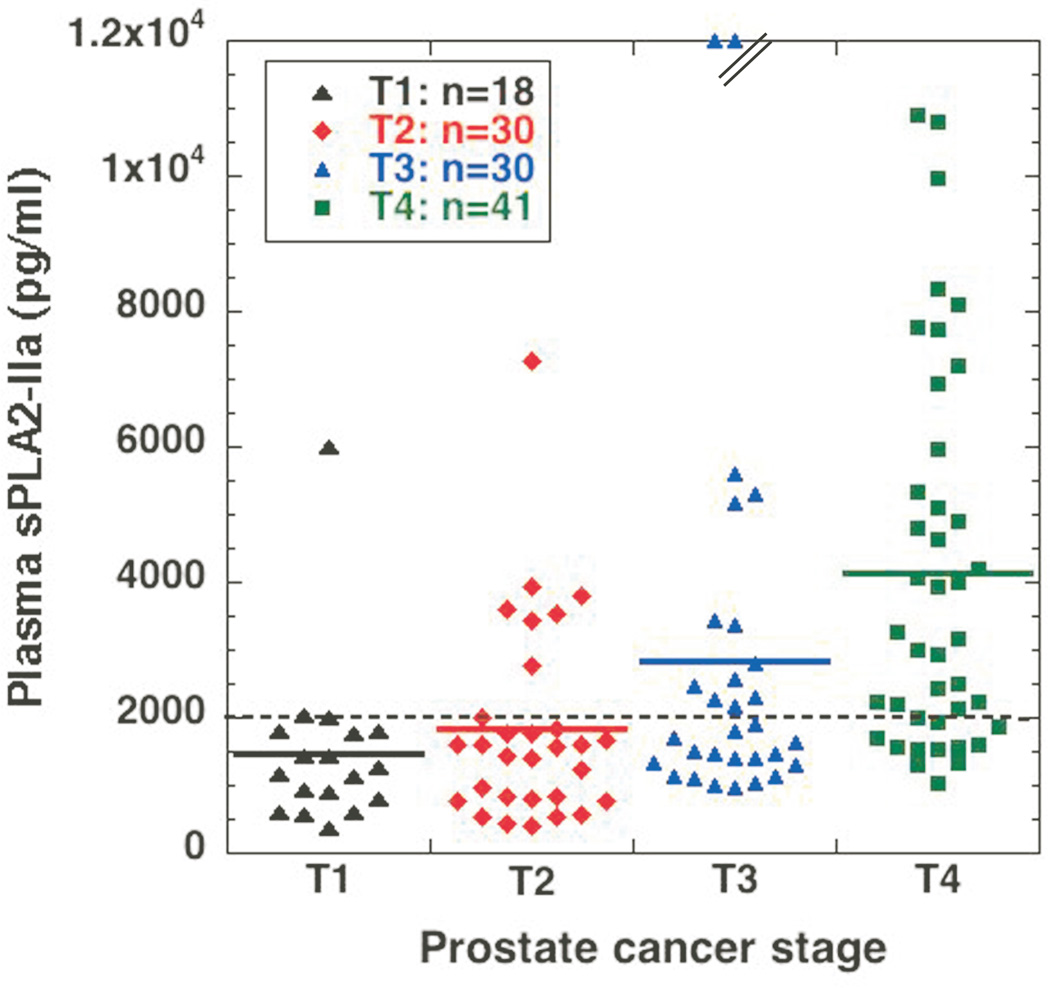
Fig. 1. Determination of plasma sPLA2-IIa in prostate cancer patients.
Plasma samples from prostate cancer patients were diluted ten times and then subjected to ELISA analysis in duplicate for each sample. The average was calculated as pg/ml based on the standard curve of each experiment. Two samples from stage T3 prostate cancer are above the scale. The dotted line indicates 2.0 ng/ml cutoff value.

