

Abstract
Performance in visual tasks is limited by the low-level mechanisms that sample the visual field. It is well documented that contrast sensitivity and spatial resolution decrease as a function of eccentricity and that those factors impair performance in “higher level” tasks, such as visual search. Performance also varies consistently at isoeccentric locations in the visual field. Specifically, at a fixed eccentricity, performance is better along the horizontal meridian than the vertical meridian, and along the lower than the upper vertical meridian. Whether these asymmetries in visual performance fields are confined to the vertical meridian or extend across the whole upper versus lower visual hemifield has been a matter of debate. Here, we measure the extent of the upper versus lower asymmetry. Results reveal that this asymmetry is most pronounced at the vertical meridian and that it decreases gradually as the angular distance (polar angle) from the vertical meridian increases, with eccentricity held constant. Beyond 30° of polar angle from the vertical meridian, the upper to lower asymmetry is no longer reliable. Thus, the vertical meridian is uniquely asymmetric and uniquely insensitive. This pattern of results is consistent with early anatomical properties of the visual system and reflects constraints that are critical to our understanding of visual information processing.
Keywords: Performance fields, Vertical meridian asymmetry, Upper versus lower asymmetry, Horizontal vertical anisotropy, Spatial vision, Contrast sensitivity
1. Introduction
While typing at your computer, you may remain fixated on the screen while reaching for your coffee cup on your desk’s surface or taking a book off of the shelf. You are able to use the information in your peripheral visual field to guide your actions. Similarly, when looking for your keys on your desk, you can fixate on individual items, moving from location to location until you find them. To pick the next location of fixation, you must again use information outside the focus of your gaze, where sensitivity and acuity are diminished. Interacting with objects that are not at the center of your gaze requires making decisions based on degraded information that is available in the peripheral visual field. Indeed, the peripheral visual field is limited: contrast sensitivity and spatial resolution (e.g., Seiple et al., 2004; Virsu & Rovamo, 1979), acuity (Carrasco, Williams, & Yeshurun, 2002; Golla et al., 2004; Seiple et al., 2004; Yeshurun & Carrasco, 1999), and texture segmentation (Gurnsey, Pearson, & Day, 1996; Kehrer, 1989; Yeshurun & Carrasco, 1998) are all impaired with increasing eccentricity. Furthermore, as eccentricity increases crowding (e.g., Bouma, 1970; Pelli, Palomares, & Majaj, 2004; Toet & Levi, 1992) and positional uncertainty (e.g., Michel & Geisler, 2011) become worse. These perceptual limitations serve as an initial bottleneck that constrains later perceptual processes, such as visual search in fixating observers (e.g., Carrasco, Evert, & Katz, 1995; Carrasco & Frieder, 1997; Carrasco, Giordano, & McElree, 2006; Geisler & Chou, 1995), as well as when observers are permitted to make eye movements (Najemnik & Geisler, 2005, 2008, 2009).
Given that the effect of eccentricity on performance is well documented, many experimenters place stimuli at isoeccentric locations to mitigate perceptual differences (e.g., Cameron et al., 2004; Carrasco & McElree, 2001; Carrasco et al., 2003; Eckstein, 1998; Moher et al., 2011; Palmer, Verghese, & Pavel, 2000). However, differences in performance at isoeccentric locations can be quite pronounced, even at parafovea. The shape of the visual performance field, with eccentricity held constant, is characterized by a Horizontal–Vertical Anisotropy (HVA), in which performance is better in the East1 and West relative to the North and South, and a vertical meridian asymmetry (VMA), in which performance is better in the South than in the North. These performance fields emerge in contrast sensitivity and spatial resolution tasks (Altpeter, Mackeben, & Trauzettel-Klosinski, 2000; Anderson, Wilkinson, & Thibos, 1992; Cameron, Tai, & Carrasco, 2002; Carrasco, Talgar, & Cameron, 2001; Carrasco, Williams, & Yeshurun, 2002; Low, 1943a, 1943b; Lundh, Lennerstrand, & Derefeldt, 1983; Mackeben, 1999; Millodot & Lamont, 1974; Montaser-Kouhsari & Carrasco, 2009; Pointer & Hess, 1989; Pointer & Hess, 1990; Regan & Beverley, 1983; Rijsdijk, Kroon, & van der Wildt, 1980; Robson & Graham, 1981; Rovamo et al., 1982; Seiple et al., 2004; Silva et al., 2008; Silva et al., 2010; Skrandies, 1985; Talgar & Carrasco, 2002), as well as in visual search tasks (Carrasco, Giordano, & McElree, 2004; Chaikin, Corbin, & Volkmann, 1962; Kristjánsson & Sigurdardottir, 2008; Kröse & Julesz, 1989; Najemnik & Geisler, 2008, 2009; Pretorius & Hanekom, 2007; Rezec & Dobkins, 2004). Both the HVA and the VMA also exist in the rate of information accrual at isoeccentric locations: information accrual is faster along the horizontal than the vertical meridian, and it is faster along the lower than the upper vertical meridian (Carrasco, Giordano, & McElree, 2004).
Both the HVA and the VMA become more pronounced as target eccentricity, target spatial frequency, and the number of distracting stimuli increases (Cameron, Tai, & Carrasco, 2002; Carrasco, Giordano, & McElree, 2004; Carrasco, Talgar, & Cameron, 2001). These differences are apparent regardless of stimulus orientation and do not depend on whether the stimuli are presented binocularly or monocularly (Carrasco, Talgar, & Cameron, 2001). Furthermore, observers report differences in subjective appearance for stimuli appearing at different isoeccentric locations. Specifically, perceived contrast is higher along the lower than the upper vertical meridian (Fuller, Rodriguez, & Carrasco, 2008) and perceived spatial frequency is higher along the horizontal than the vertical meridian (Edgar & Smith, 1990; Montaser-Kouhsari & Carrasco, 2009). Furthermore, luminance defined stimuli fade faster along the vertical than the horizontal meridian and fade faster in upper than in lower visual field locations (Sakaguchi, 2003). Finally, these asymmetries in perceptual performance are also observed in motion perception (Fuller & Carrasco, 2009), as well as in tasks involving visual short-term memory (Montaser-Kouhsari & Carrasco, 2009) and memory for scenes (Previc & Intraub, 1997). Finally, crowding is more pronounced along the upper than the lower vertical meridian (He, Cavanagh, & Intriliagator, 1996).
1.1. What is the source of these asymmetries in sensitivity?
At the level of the retina, cone density is highest along the horizontal meridian, which may be an anatomical correlate of the HVA. Regarding the VMA, there is also a slight upper to lower asymmetry with more cones in the superior than in the inferior portions of the retina, which process the lower and the upper visual field, respectively (Curcio et al., 1987, 1990). The distribution of ganglion cells in the retina also follows this relation and has a greater asymmetry than at the level of the cone mosaic (Curcio & Allen, 1990; Perry & Cowey, 1985).
In the LGN, the magnocellular layers are relatively symmetric at any given eccentricity, whereas the parvocellular layers are asymmetric. In the parvocellular layers, more space is dedicated to the representation of the horizontal meridian and there is slightly more space dedicated to the lower than to the upper visual field (Connolly & Van Essen, 1984). This relative asymmetry of the parvocellular layers may be responsible for the interaction between visual performance fields and spatial frequency. Specifically, parvocellular units tend to be sensitive to higher spatial frequencies, whereas magnocellular units tend to be sensitive to lower frequency stimuli. Therefore, visual information with a higher spatial frequency might be processed in the asymmetric parvocellular layers, leading to increasingly asymmetric performance fields as spatial frequency increases.
Finally, in cortex, asymmetries in the representation of the visual field have been reported at the level of V1 (Tootell et al., 1988; Van Essen, Newsome, & Maunsell, 1984; but see Adams & Horton, 2003, who found no upper versus lower asymmetry in squirrel monkey V1) and MT (Maunsell & Van Essen, 1987), with more cortical space dedicated to horizontal meridian than the vertical meridian and more space dedicated to the lower than the upper visual field. These cortical asymmetries are possible correlates of the HVA and the VMA, respectively. It should be noted, however, that most of these anatomical studies refer to asymmetries between the whole upper versus whole lower visual hemifields and are not constrained to the vertical meridian. In this sense, our knowledge of visual performance fields departs from our knowledge of the anatomy of the visual system, as behavioral studies report that the upper to lower asymmetry applies to the vertical meridian but not to the intercardinal locations (Cameron, Tai, & Carrasco, 2002; Carrasco, Giordano, & McElree, 2004; Carrasco, Talgar, & Cameron, 2001).
Only one report has found a unique physiological basis for the VMA: an fMRI study in humans found that for high- but not low-spatial frequencies the amplitude of the BOLD response is smaller along the upper than the lower vertical meridian and that this difference disappears when the stimuli are presented at the intercardinal locations (Liu, Heeger, & Carrasco, 2006). Two other reports have provided evidence for greater insensitivity closer to the vertical meridian at a fixed eccentricity: In non-human primates, an electrophysiological study found that in V1 there is a greater representation of the visual field within ±45° of the horizontal meridian relative to positions within ±45° of the vertical meridian (Van Essen, Newsome, & Maunsell, 1984; but see Adams & Horton, 2003). Finally, a neuroanatomical study of the macaque LGN found an overemphasis of the representation within ±45° of the horizontal meridian (Connolly & Van Essen, 1984).
These studies provide clear anatomical evidence for the HVA and limited evidence for the VMA. Most of the anatomical data suggest that upper versus lower visual field differences should not be restricted to the vertical meridian, but behavioral studies that have compared performance along the vertical meridian to performance at the 45° intercardinal locations have found no upper to lower asymmetry at the 45° intercardinal locations (e.g., Cameron, Tai, & Carrasco, 2002; Carrasco, Giordano, & McElree, 2004; Carrasco, Talgar, & Cameron, 2001). This apparent discrepancy between the anatomy and the behavior may be due to the fact that the relation between anatomical and behavioral asymmetries is complex. Different cell populations can have different spatial properties from each other (i.e., lowpass or bandpass), which can lead to differential sensitivity. If neurons with dissimilar spatial properties represent different regions of space, then a lower cell density is not sufficient for a claim of diminished sensitivity. Thus, it can only be hypothesized that lower cell densities might lead to diminished performance.
Some authors have suggested that visual performance fields result from different properties of attentional orienting across the visual field (e.g., Altpeter, Mackeben, & Trauzettel-Klosinski, 2000; He, Cavanagh, & Intriliagator, 1996; Intriligator & Cavanagh, 2001; Mackeben, 1999). However, when selective attention has been explicitly manipulated and performance is compared across cued and neutral trials, cueing alters sensitivity across the visual field, but both the HVA and the VMA remain (Cameron, Tai, & Carrasco, 2002; Carrasco, Talgar, & Cameron, 2001; Carrasco, Williams, & Yeshurun, 2002; Kristjánsson & Sigurdardottir, 2008; Mackeben, 1999; Talgar & Carrasco, 2002). In contrast, with respect to the speed of information accrual, attention ameliorates the differences across the performance field, speeding information accrual more where that rate is the slowest (North) and least where the rated is the fastest (East and West; Carrasco, Giordano, & McElree, 2004). Thus, whereas attention modulates the speed of information accrual as a function of isoeccentric location, it does not so with regard to sensitivity.
Based on the evidence presented thus far, we argue that the most parsimonious explanation for visual field asymmetries in sensitivity lies in the anatomical organization of the early visual system. Indeed, performance measures in acuity, contrast sensitivity, and letter identification tasks are highly correlated with known ganglion cell densities at both eccentric and isoeccentric locations (Seiple et al., 2004). Along similar lines, visual performance fields depend on the retinotopic location of the stimulus and not the external frame of reference, further suggesting a link between the anatomy of the early visual system and performance asymmetries (Corbett & Carrasco, 2011).
1.2. What is the extent of the VMA?
With respect to the previously discussed behavioral findings, one key issue has gone unresolved: is the VMA an indicator of a general upper versus lower visual hemifield asymmetry or is the vertical meridian uniquely asymmetric? A number of reports suggest that performance is asymmetric along the vertical meridian and that no upper to lower asymmetry exists at 45° intercardinal locations (Cameron, Tai, & Carrasco, 2002; Carrasco, Giordano, & McElree, 2004; Carrasco, Talgar, & Cameron, 2001; Fuller & Carrasco, 2009; Liu, Heeger, & Carrasco, 2006). Others have reported upper versus lower hemifield differences either with stimuli on the vertical meridian alone (He, Cavanagh, & Intriliagator, 1996; Rubin, Nakayama, & Shapley, 1996), with performance averaged across the vertical and the intercardinal locations (Nazir, 1992), stimuli at intercardinal locations (McAnany & Levine, 2007), or with stimuli that occupy large portions of the upper versus lower visual hemifields (Graham et al., 1999; Levine & McAnany, 2005; Vecera, Vogel, & Woodman, 2002). With one exception (McAnany & Levine, 2007), it is possible that whole upper versus lower visual hemifield differences in the abovementioned reports are driven by asymmetric performance at the vertical meridian alone. Some authors have also reported no upper versus lower visual field asymmetry (e.g., Carrasco, Evert, Chang, & Katz, 1995) or only a small asymmetry (Graham et al., 1999) when averaging across the whole upper versus the whole lower visual field. Such averaging may have obscured the presence of an upper to lower asymmetry restricted to the vertical meridian (as discussed by Carrasco, Giordano, and McElree (2004) and Talgar and Carrasco (2002)).
Measuring the conspicuity of objects across eccentricity as well as at isoeccentric locations provides a framework for how people process information in the periphery (e.g., Engel, 1971), facilitating models of visually guided behavior (e.g., Najemnik & Geisler, 2005; Najemnik & Geisler, 2008, 2009). Assessing the visual performance field (how performance varies at eccentric and isoeccentric locations) is critical not only for our understanding of visual processing, but also for designing interfaces intended to convey information, as well as for experimental design. Moreover, measuring performance degradations in the periphery and at isoeccentric locations allows us to link changes in the anatomy of the visual system to behavior. In this sense, documenting performance constraints in the periphery can facilitate our understanding of “high level” tasks such as visual search, as well as how the visual system performs the computations necessary for a given task. Finally, these measurements can serve as a sensitivity benchmark, which can inform future experiments examining performance in a variety of situations (e.g., with varying states of adaptation, learning, or attentional deployment).
The present study investigated the spatial extent of the upper versus lower visual field asymmetry by characterizing the relation between asymmetric sensitivity and proximity to the vertical meridian in degrees of polar angle. Fig. 1 depicts a number of possible patterns of asymmetry for the upper versus lower visual field sensitivity as a function of angular distance from the vertical meridian. By characterizing the change in sensitivity as a function of position for the upper and lower visual fields, we can characterize the asymmetries in visual performance fields and better understand the factors that limit performance in the periphery.
Fig. 1.

Four possible patterns for upper and lower visual field sensitivity as a function of angular distance from the vertical meridian. Sensitivity is the reciprocal of the contrast necessary to reach 75% performance in the orientation discrimination task. (A) One possibility is a constant upper to lower asymmetry where the vertical meridian plays no role. (B) Alternatively, there may be a constant upper to lower asymmetry where performance is worst at the vertical meridian. (C) Conversely, it is possible that there is no upper versus lower asymmetry, with an upper to lower difference that is restricted to the vertical meridian. (D) Finally, it may be that the vertical meridian is the most asymmetric and insensitive portion of the visual field and that the asymmetry decreases as a function of angular distance from the vertical meridian.
2. Experiment
2.1. Methods
2.1.1. Participants
Fourteen paid volunteers (Eight females; mean age ~27) participated in this experiment. Five were experienced psychophysical observers and all but one (author, JA) were naïve with respect to the purpose of this study. All participants had normal or corrected- to-normal vision. The Institutional Review Board at New York University approved the experimental procedures and all participants gave informed consent.
2.1.2. Apparatus
All stimuli were generated and presented using Matlab (Mathworks, Natick, MA) and the Psychophysics Toolbox (Brainard, 1997; Pelli, 1997) on an Apple iMac computer and were displayed on a 21″CRT monitor (1280 × 960 at 100 Hz). The display was calibrated using a Photo Research (Chatsworth, CA) PR650 Spectra- Colorimeter to generate linear lookup tables with 10-bit color specification for this experiment. The maximum luminance of the monitor was set to ~28 cd/m2. Observers viewed the display at a distance of 57 cm through a circular aperture (Diameter = 29°), with their head position stabilized with a chin rest.
2.1.3. Stimuli
Each trial consisted of three displays: fixation, stimulus, and response. Across all three displays, there was a fixation point (0.2° × 0.2°; <1 cd/m2) and a set of four placeholders. The placeholders indicated potential stimulus locations and consisted of four arcs (35° polar angle; ~0.03° wide; <1 cd/m2) around an imaginary circle subtending 4.25° of visual angle. In a given block, each placeholder was centered at one of twenty polar angles relative to the horizontal meridian (0°, 22.5°, 45°, 60°, 75°, 90°, 105°, 120°, 135°, 157.5°, 180°, 202.5°, 225°, 240°, 255°, 270°, 285°, 300°, 315°, and 337.5°; following the mathematical convention 0° corresponds to East; 90° to North; 180° to West; 270° to South, etc.) at 6° of eccentricity from the central fixation point. The stimulus display consisted of the fixation point, four placeholders, and four Gabor patches (sinusoidal gratings in a Gaussian envelope, 1° at half height; 6 cycles/°). Three of the Gabor patches were vertical, whereas the fourth (the target) was oriented at ±15° from vertical. The locations tested were blocked such that only four locations were tested simultaneously per session, one in each quadrant (Group 1: 0°, 90°, 180°, and 270°; Group 2: 45°, 135°, 225°, and 315°; Group 3: 22.5°, 157.5°, 202.5°, and 337.5°; Group 4: 60°, 105°, 240°, and 285°; Group 5: 75°, 120°, 255°, and 300°). Individual groups were tested on different days in a randomized fashion. Pilot data confirmed that locations near the vertical meridian exhibited the most change as a function of angular distance from the vertical meridian. Therefore, we sampled the area within ±45° of the vertical meridian more densely (Groups 4 and 5). Pilot data also confirmed that different distances in polar angle between locations within each group (45° in Groups 3–5 versus 90° in Groups 1 and 2) had no effect on threshold. Note that testing all stimulus locations simultaneously would have resulted in crowding and contaminated our measurements.
On each trial, the four Gabor patches had the same contrast, which was set on a trial-to-trial basis by a staircase procedure. The response display consisted of the fixation point, placeholders and a response cue (0.15° × 1°; <1 cd/m2) that indicated the location of the target Gabor. The response cue was introduced to eliminate spatial uncertainty (e.g., Eckstein, Shimozaki, & Abbey, 2002; Ling & Carrasco, 2006; Lu & Dosher, 2000; Pestilli, Viera, & Carrasco, 2007). The mean luminance of the display was set to ~14 cd/m2.
2.3. Procedure
Fig. 2 depicts the trial sequence. Observers began each trial with 500 ms of fixation, followed by a 40 ms stimulus presentation, and then the presentation of the response cue for a 2000 ms response window. Observers were instructed to indicate whether the Gabor denoted by the response cue was tilted to the left or to the right. Observers were informed that the response cue was 100% valid with respect to target location. Observer responses terminated the response window, at which point auditory feedback was given and a 400 ms inter-trial interval began. Observers participated in five 1-h sessions. During each session, one of the five abovementioned groups was tested. Observers were given one block of practice, followed by four blocks of the main experiment. The practice block familiarized the observer with the locations presented during that session. During the experimental blocks, stimulus contrast was controlled by a series of interleaved 2-down 1-up and 3-down 1-up staircases (Levitt, 1971) with either high or low starting contrasts for a total of four possible staircase types (increment rule × starting contrast). In a given block, one rule by contrast pairing was selected in pseudo-random fashion for each of the four locations. Each block consisted of 200 trials, with 50 trials for each of the four staircases, thus each location within a block was tested 50 times. Each observer completed 4000 trials of the experiment (20 locations × 4 staircases × 50 trials per staircase).
Fig. 2.

Trial sequence. Observers performed a 2AFC orientation discrimination on Gabor stimuli. Note that only four locations were present on a given trial and that only four of the possible locations are represented by this figure. Note also that the Gabor tilt angle, as well as the size of the place-holders, fixation point, and response cue have been exaggerated for clarity.
2.3.1. Analysis
Psychometric functions were fit to the data from each location with a four-parameter Weibull function
where ψ is the proportion of correct responses in the orientation discrimination task, x is the contrast of the target, α is the location parameter, β is the slope, and γ and λ are lower and upper asymptotes, respectively. Fits were performed using maximum likelihood estimation. Goodness of fit was evaluated with a deviance score, which is the log-likelihood ratio between a fully saturated, zero residual model and the data model. A score above the critical chi-square value indicates a significant deviation between the fit and the data (Wichmann & Hill, 2001a, 2001b). In all conditions, for all observers none of the deviance scores for the fits exceeded the critical chi-square value.
For each location, the contrast necessary to reach 75% orientation discrimination performance was extracted from the fitted function. The reciprocal of that contrast value is the sensitivity measure.
3. Results
3.1. Cardinal locations
Fig. 3a shows the average raw difference in performance on the horizontal meridian (East and West) and the vertical meridian (North and South), as well as the difference between the average performance in the South and the North. Both the Horizontal–Vertical Anisotropy (HVA) and the vertical meridian asymmetry (VMA) are reflected in Fig. 3. To assess the HVA, we compared mean sensitivity along the vertical meridian with mean sensitivity along the horizontal meridian (Mean sensitivities: North: 2.89; South: 4.45; East: 5.42; West: 6.18). We found a reliable HVA with a magnitude of ~63% better performance along the horizontal than the vertical meridian (t(13) = 5.8386; p < 0.0001; d = 1.56). The VMA was also significant, with a magnitude of ~65% better sensitivity along the lower than the upper vertical meridian (t(13) = 7.4992; p < 0.0001; d = 2.00). We found no reliable difference between the West (left) and East (right) positions along the horizontal meridian (t(13) = 1.1957; p > 0.1). Given the number of comparisons in this study, we have applied a Bonferroni correction, setting the critical alpha value to 0.0055.
Fig. 3.
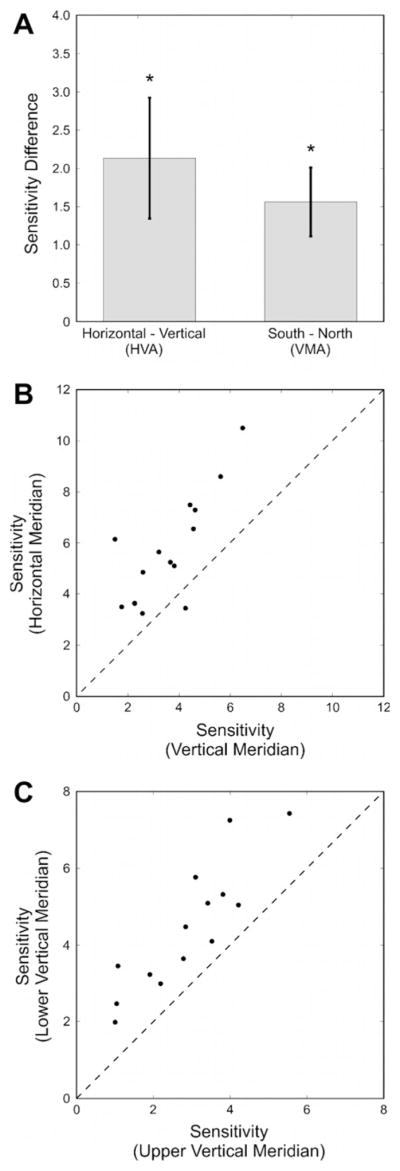
(a) HVA and VMA across observers. The HVA as the raw difference between averaged sensitivity (1/threshold) on the horizontal meridian and the vertical meridian and the VMA as the difference between sensitivity (1/threshold) along the lower and the upper vertical meridian. Values greater than zero indicate higher performance along the horizontal meridian and higher performance along the lower than the upper vertical meridian, respectively. Error bars represent 95% confidence intervals of the difference. (b) HVA for individual observers. The HVA for each observer is depicted as the sensitivity along the horizontal meridian as a function of sensitivity along the vertical meridian. Points above the diagonal indicate that sensitivity is lower along the vertical meridian than the horizontal meridian. (c) VMA for individual observers. The VMA for each observer is depicted as the sensitivity along the lower vertical meridian as a function of sensitivity along the upper vertical meridian. Points above the diagonal indicate that sensitivity is lower along the upper vertical meridian than the lower vertical meridian.
In Fig. 3b, we plot sensitivity for individual observers for the horizontal (East and West) and vertical (North and South) meridians: data points along the unity line would indicate no anisotropy; points above the diagonal denote higher sensitivity for locations along the horizontal than the vertical meridian. As can be seen, all but one observer2 have better performance along the horizontal than the vertical meridian, the HVA. Similarly, in Fig. 3c, we plot sensitivity for individual observers for the lower (South) and upper (North) vertical meridian. All data points are above the diagonal line indicating higher sensitivity for locations along the lower than the upper vertical meridian, the VMA. Whereas there is substantial variability in baseline sensitivity across observers, the HVA and the VMA are consistently present.
3.2. Upper versus lower visual field asymmetry
To rule out the possibility of a systematic difference between the left and the right visual hemifields, we performed a paired t-test on the averaged data from the left and right visual hemifields. There was no reliable difference between the two hemifields (t(13) = 1.1065; p > 0.1). As a result, all further analyses were conducted on data collapsed across the left and right hemifields.
Fig. 4 illustrates the change in performance in the upper and lower visual hemifields as a function of angular distance from the vertical meridian, as well as a fit to the data using linear regression. To assess the relation between visual hemifield and angular distance from the vertical meridian, we conducted a repeated-measures ANOVA (2 hemifields × 5 angles). There was a significant main effect of hemifield (F(1,13) = 102.598; p < 0.001; ); the upper visual hemifield was less sensitive than the lower visual hemifield. Furthermore, there was a significant effect of angular position (F(4,52) = 23.73; p < 0.001; ), which indicates that sensitivity was diminished at positions that were closer to the vertical meridian. Importantly, the interaction between hemifield and angular position was significant (F(4,52) = 4.713; p = 0.003; ) indicating that the difference between upper and lower was more pronounced at the vertical meridian and decreased with distance from the vertical meridian. This pattern was confirmed by a significant linear contrast of the interaction (F(1,13) = 22.947; p < 0.001; ), illustrating that the raw difference (upper minus lower locations) can be well described by a line. The effect of angular distance from the vertical meridian was also well characterized by a linear function (F(1,13) = 40.043; p < 0.001; ). Thus, the averaged data from the upper and lower visual fields were fit with a linear regression (Fig. 4). The change in sensitivity as a function of angular distance from the vertical meridian was well described by a linear function in both the upper (R2 = 0.957; p < 0.001) and lower (R2 = 0.731; p = 0.0299) visual fields.
Fig. 4.

Sensitivity (1/threshold) as a function of angular distance from the vertical meridian for the upper and lower visual hemifields, as well as a fit to both sets of data using linear regression. Error bars represent ±1 standard error of the mean.
Planned comparisons revealed that the two visual hemifields remained reliably different until 30°, and that there was only a marginal difference at 45°. Table 1 summarizes the angles, t-statistics, p-values, and Cohen’s d values for the planned comparisons.
Table 1.
The angles, t-statistics, p-values, and Cohen’s d values for the paired t-test on the sensitivity in the upper and lower visual hemifields as a function of angular distance from the vertical meridian. For example, 0° is the comparison between the North and the South. We have applied a Bonferroni correction, setting the critical alpha value to 0.0055.
| Angle from vertical (°) | t-Statistic (d.f. = 13) | p-Value | Cohen’s d |
|---|---|---|---|
| 0 | 7.4992 | p < 0.0001 | 2.000 |
| 15 | 6.1069 | p < 0.0001 | 1.632 |
| 30 | 5.9646 | p < 0.0001 | 1.5941 |
| 45 | 3.2540 | p = 0.0063 | 0.8696 |
| 67.5 | 1.5170 | p > 0.1 | N/A |
4. Discussion
Fig. 3a illustrates the average raw difference between the South and the North (VMA) and between the average performance on the horizontal meridian and the vertical meridian (HVA). This figure clearly shows the characteristics of previously reported performance fields, suggesting distinctly higher sensitivity about the horizontal axis relative to the vertical. Similarly, the VMA itself is readily apparent. Fig. 4 captures both of these facts about the visual performance field and provides a more complete picture of how performance varies at isoeccentric locations: the vertical meridian is uniquely asymmetric and uniquely insensitive.
The first aspect of note in Fig. 4 is that there is not a constant upper versus lower visual field asymmetry. The change in performance as a function of angular distance from the vertical meridian is well defined by a line in both the upper and lower visual fields. The slopes, however, are not parallel; the slope is steeper for the upper than the lower visual field. This finding is consistent with a study that demonstrated that perceptual filling-in changes more rapidly in the upper than the lower visual field as a function of polar angle (Sakaguchi, 2003). Moreover, the two lines cease to be reliably different from one another beyond 30°. These results, consistent with previous studies (e.g., Cameron, Tai, & Carrasco, 2002; Carrasco, Giordano, & McElree, 2004; Carrasco, Talgar, & Cameron, 2001), indicate that stimuli along the horizon line enjoy privileged processing relative to locations along other meridians of the visual field, and that sensitivity at 45° in the four quadrants is similar and intermediate to performance at the vertical and horizontal meridians (e.g., Cameron, Tai, & Carrasco, 2002; Carrasco, Giordano, & McElree, 2004; Carrasco, Talgar, & Cameron, 2001; Fuller & Carrasco, 2009).
A second noteworthy aspect of Fig. 4 is the gradient of sensitivity in both visual fields has a minimum at the vertical meridian, indicating that the vertical meridian is uniquely insensitive. A third aspect depicted in this figure is that the intermediate level of performance at the intercardinal location increases to levels obtained along the horizontal meridian as distance from the horizontal decreases. This pattern of results is analogous to the situation depicted in Fig. 1D, wherein sensitivity becomes higher and performance in both hemifields becomes more similar as the angular distance from the vertical meridian increases.
Taken together these data support previous notions of visual performance fields (e.g., Carrasco, Talgar, & Cameron, 2001) and the conspicuity area. Previous measurements of the conspicuity area (e.g., Engel, 1971; Pretorius & Hanekom, 2007) have suggested that the visual performance field is simply an ellipse. The HVA derived from the present data illustrates the horizontal elongation of the elliptical performance field; however, an elliptical model cannot capture the robust VMA. Note that measurements of the conspicuity area have utilized high contrast stimuli of variable spatial content in a detection task (squares of 0.6° and 1.2°, respectively). The fundamental frequency of such stimuli would have been relatively low. Therefore, those authors may have not found a VMA because it disappears at lower spatial frequencies where there is still a reliable HVA (e.g., Cameron, Tai, & Carrasco, 2002; Carrasco, Talgar, & Cameron, 2001; Liu, Heeger, & Carrasco, 2006).
Fig. 4 also shows an upper to lower visual field asymmetry and how that asymmetry changes over space. Points in the upper visual field are reliably less sensitive than points in the lower visual field within 30° of the vertical meridian. It is clear that what has been considered to be a general upper versus lower visual field asymmetry (e.g., He, Cavanagh, & Intriliagator, 1996; Levine & McAnany, 2005; McAnany & Levine, 2007; Previc, 1990; Rubin, Nakayama, & Shapley, 1996) should be defined as a gradient.
Whereas previous reports have indicated that there is no significant upper versus lower asymmetry at 45° (e.g., Cameron, Tai, & Carrasco, 2002; Carrasco, Giordano, & McElree, 2004; Carrasco, Talgar, & Cameron, 2001), and performance has been collapsed across the four intercardinal isoeccentric locations because no differences have emerged at those locations in contrast sensitivity (Ling & Carrasco, 2006; Talgar, Pelli, & Carrasco, 2004) or in acuity (Montagna, Pestilli, & Carrasco, 2009), we found a marginal asymmetry at 45° in the present study. Note, however, that the magnitude of this marginal asymmetry at 45° is less than half the magnitude of the asymmetry at the vertical meridian.
What function, then, can describe the relation between the upper versus lower asymmetry and the angular distance from the vertical meridian? The relation between the average normalized difference between an upper and lower visual field location and the angular distance from vertical is satisfactorily defined by a linear function. Despite some individual variability (see also, Cameron, Tai, & Carrasco, 2002; Carrasco, Talgar, & Cameron, 2001; Mackeben, 1999; Popple & Levi, 2005; Regan & Beverley, 1983), the pattern of canonical asymmetries (VMA and HVA; Fig. 3b and c), as well as improved performance as stimuli are moved closer to the horizontal meridian is present in all observers. Thus, the linear relation between asymmetry and angular distance from the vertical meridian is a helpful generalization for describing human performance at isoeccentric locations.
Differences in sensitivity at isoeccentric locations in the spatial (e.g., Carrasco, Talgar, & Cameron, 2001) and temporal (e.g., Carrasco, Giordano, & McElree, 2004) domains complicate a standard method of assessing perceptual performance as well as the effects of attention on perception: testing sensitivity at a fixed eccentricity. In visual search, typical patterns of performance (i.e., set-size effects on RT) in feature and conjunction searches can be explained by target eccentricity (Carrasco et al., 1995). Indeed, search patterns that have been attributed to attention may be explained by simple perceptual limitations at eccentric locations. Ruling out perceptual explanations, then, can allow for a more complete understanding of the factors that impact search performance (e.g., Carrasco & Frieder, 1997; Carrasco, McLean, Katz, & Frieder, 1998; Geisler & Chou, 1995; Verghese & Nakayama, 1994). To combat these effects, many (including ourselves) have presented stimuli at a fixed eccentricity in order to get around “low level” sensory factors (e.g., Cameron et al., 2004; Carrasco & McElree, 2001; Carrasco et al., 2003; Eckstein, 1998; Moher et al., 2011; Palmer, Verghese, & Pavel, 2000). However, simply constraining eccentricity does not eliminate differences in sensory limitations.
Indeed, differences in performance at isoeccentric locations can be as pronounced as those differences across eccentricities. For example, sensitivity nearly doubles when changing the stimulus location from 10° to 5° of eccentricity (Virsu & Rovamo, 1979, Figure 2C). In the present study, with stimuli of a similar spatial frequency, sensitivity nearly doubles when changing the stimulus location from the North to the horizontal meridian at a fixed eccentricity. Moreover, in the temporal domain, there are similar differences that result from changing the stimulus location. With respect to eccentricity, processing speed is ~22% slower at 4° than 9° of eccentricity (Carrasco et al., 2003). With eccentricity held constant at 4°, processing speed is ~14% slower at the North location than the horizontal meridian (and these isoeccentric differences are more pronounced at farther eccentricities, Carrasco, Giordano, & McElree, 2004). These examples illustrate that location, in general, rather than eccentricity, in particular, is a major limiting factor in visual perception. These location-dependent differences in sensitivity and temporal information processing have significant perceptual consequences and will need to be accounted for in comprehensive neurophysiological and computational models of visual information processing.
Finally, these behavioral findings are in agreement with anatomical findings in macaque LGN (Connolly & Van Essen, 1984) and V1 (Van Essen, Newsome, & Maunsell, 1984; but see Adams & Horton, 2003). Both studies suggest a greater representation of the area of the visual field within ±45° of the horizontal meridian, but neither study addresses why the vertical meridian would be uniquely insensitive. It is possible that the gradient suggested in previous anatomical reports (Connolly & Van Essen, 1984; Van Essen, Newsome, & Maunsell, 1984) simply continues, arriving at minimal sensitivity at the vertical midline. Another possibility is that the splitting of the visual field about the midline leads to a more noisy representation of stimuli presented there. Specifically, receptive fields that represent information on the vertical midline must integrate information from both visual fields by means of long distance connections across the corpus callosum (e.g., Rajimehr & Tootell, 2009). At the present time, any anatomical explanation for uniquely poor performance on the vertical meridian remains speculative. Although it is clear that the anatomical representation and behavioral sensitivity are highest along the horizontal meridian and that the area closer to the vertical meridian is uniquely underrepresented and insensitive, the present study indicates that there is a gradient of asymmetry that reaches its maximum at the vertical meridian, which has not been characterized anatomically.
5. Conclusion
This study demonstrates that there is not a general upper versus lower visual field asymmetry. Instead, performance at the vertical meridian is uniquely asymmetric whereas performance around the horizontal meridian is relatively homogenous, relative to neighboring regions. The upper versus lower field asymmetry decreases as the angular distance from vertical increases. This gradient of asymmetry is linear, on average, with no significant asymmetry beyond 30°.
The asymmetric quality of the visual field at isoeccentric locations is quite striking: the vertical meridian is roughly 63% as sensitive as the horizontal meridian and the upper vertical meridian is about 65% as sensitive as the lower vertical meridian. Many observers were at chance performance along the upper vertical meridian with stimulus contrasts that led to near-ceiling performance along the horizontal meridian. Thus, assuming that performance is equivalent at isoeccentric locations is grossly inaccurate. Instead, the quality of visual perception differs tremendously across eccentricities and at isoeccentric locations. With respect to a better understanding of visual processing, measurements of visual field asymmetry at eccentric and isoeccentric locations can be linked with known anatomical factors (e.g., ganglion cell density) in order to generate testable models of how information processing works in the periphery. These changes in quality follow predictable patterns and should be kept in mind when modeling visual performance as well as when designing experiments.
The characterization of visual performance fields has profound implications for ergonomic and human factors applications. With respect to interface design, these measurements can permit the optimization of displays for speed and accuracy. Specifically, the placement of critical information, as well as the spatio-temporal properties of that information, can be adjusted to create more usable displays. Such interfaces are critical for drivers, pilots, radiologists, air traffic controllers, and many others.
Acknowledgments
This work has been supported by R01 EY016200 to M.C. We thank all of the members of the Carrasco lab, as well as the anonymous reviewers, for their valuable comments and feedback.
Footnotes
For ease of comprehension, we refer to isoeccentric locations using compass terminology, specifying position along the cardinal meridians.
The unusual result for this observer emerged because performance at one of the horizontal locations was substantially lower than at the other three locations.
References
- Adams DL, Horton JC. A precise retinotopic map of primate striate cortex generated from the representation of angioscotomas. Journal of Neuroscience. 2003;23(9):3771–3789. doi: 10.1523/JNEUROSCI.23-09-03771.2003. [DOI] [PMC free article] [PubMed] [Google Scholar]
- Altpeter E, Mackeben M, Trauzettel-Klosinski S. The importance of sustained attention for patients with maculopathies. Vision Research. 2000;40(10–12):1539–1547. doi: 10.1016/s0042-6989(00)00059-6. [DOI] [PubMed] [Google Scholar]
- Anderson RS, Wilkinson MO, Thibos LN. Psychophysical localization of the human visual streak. Optometry and Vision Science. 1992;69(3):171–174. doi: 10.1097/00006324-199203000-00001. [DOI] [PubMed] [Google Scholar]
- Bouma H. Interaction effects in parafoveal letter recognition. Nature. 1970;226(5241):177–178. doi: 10.1038/226177a0. [DOI] [PubMed] [Google Scholar]
- Brainard DH. The psychophysics toolbox. Spatial Vision. 1997;10(4):433–436. [PubMed] [Google Scholar]
- Cameron EL, Tai JC, Carrasco M. Covert attention affects the psychometric function of contrast sensitivity. Vision Research. 2002;42(8):949–967. doi: 10.1016/s0042-6989(02)00039-1. [DOI] [PubMed] [Google Scholar]
- Cameron EL, Tai JC, Eckstein MP, Carrasco M. Signal detection theory applied to three visual search tasks-identification, yes/no detection and localization. Spatial Vision. 2004;17(4–5):295–325. doi: 10.1163/1568568041920212. [DOI] [PubMed] [Google Scholar]
- Carrasco M, Evert DL, Chang I, Katz SM. The eccentricity effect: Target eccentricity affects performance on conjunction searches. Perception & Psychophysics. 1995;57(8):1241–1261. doi: 10.3758/bf03208380. [DOI] [PubMed] [Google Scholar]
- Carrasco M, Frieder KS. Cortical magnification neutralizes the eccentricity effect in visual search. Vision Research. 1997;37(1):63–82. doi: 10.1016/s0042-6989(96)00102-2. [DOI] [PubMed] [Google Scholar]
- Carrasco M, Giordano AM, McElree B. Temporal performance fields: Visual and attentional factors. Vision Research. 2004;44(12):1351–1365. doi: 10.1016/j.visres.2003.11.026. [DOI] [PubMed] [Google Scholar]
- Carrasco M, McElree B. Covert attention accelerates the rate of visual information processing. Proceedings of the National Academy of Sciences of the United States of America. 2001;98(9):5363–5367. doi: 10.1073/pnas.081074098. [DOI] [PMC free article] [PubMed] [Google Scholar]
- Carrasco M, McElree B, Desinova K, Giordano AM. Speed of visual processing increases with eccentricity. Nature Neuroscience. 2003;6(7):699–700. doi: 10.1038/nn1079. [DOI] [PMC free article] [PubMed] [Google Scholar]
- Carrasco M, McLean TL, Katz SM, Frieder KS. Feature asymmetries in visual search: Effects of display duration, target eccentricity, orientation, and spatial frequency. Vision Research. 1998;38(3):347–374. doi: 10.1016/s0042-6989(97)00152-1. [DOI] [PubMed] [Google Scholar]
- Carrasco M, Talgar CP, Cameron EL. Characterizing visual performance fields: Effects of transient covert attention, spatial frequency, eccentricity, task and set size. Spatial Vision. 2001;15(1):61–75. doi: 10.1163/15685680152692015. [DOI] [PMC free article] [PubMed] [Google Scholar]
- Carrasco M, Williams PE, Yeshurun Y. Covert attention increases spatial resolution with or without masks: Support for signal enhancement. Journal of Vision. 2002;2(6):467–479. doi: 10.1167/2.6.4. [DOI] [PubMed] [Google Scholar]
- Chaikin JD, Corbin HH, Volkmann J. Mapping a field of short-time visual search. Science. 1962;138:1327–1328. doi: 10.1126/science.138.3547.1327. [DOI] [PubMed] [Google Scholar]
- Connolly M, Van Essen D. The representation of the visual field in parvicellular and magnocellular layers of the lateral geniculate nucleus in the macaque monkey. The Journal of Comparative Neurology. 1984;226(4):544–564. doi: 10.1002/cne.902260408. [DOI] [PubMed] [Google Scholar]
- Corbett JE, Carrasco M. Visual performance fields: Frames of reference. PLoS ONE. 2011;6(9):1–10. doi: 10.1371/journal.pone.0024470. [DOI] [PMC free article] [PubMed] [Google Scholar]
- Curcio CA, Allen KA. Topography of ganglion cells in human retina. The Journal of Comparative Neurology. 1990;300(1):5–25. doi: 10.1002/cne.903000103. [DOI] [PubMed] [Google Scholar]
- Curcio CA, Sloan KR, Kalina RE, Hendrickson AE. Human photoreceptor topography. The Journal of Comparative Neurology. 1990;292(4):497–523. doi: 10.1002/cne.902920402. [DOI] [PubMed] [Google Scholar]
- Curcio CA, Sloan KR, Packer O, Hendrickson AE, Kalina RE. Distribution of cones in human and monkey retina: Individual variability and radial asymmetry. Science. 1987;236(4801):579–582. doi: 10.1126/science.3576186. [DOI] [PubMed] [Google Scholar]
- Eckstein MP. The lower visual search efficiency for conjunctions is due to noise and not serial attentional processing. Psychological Science. 1998;9(2):111–118. [Google Scholar]
- Eckstein MP, Shimozaki SS, Abbey CK. The footprints of visual attention in the Posner cueing paradigm revealed by classification images. Journal of Vision. 2002;2:25–45. doi: 10.1167/2.1.3. [DOI] [PubMed] [Google Scholar]
- Edgar GK, Smith AT. Hemifield differences in perceived spatial frequency. Perception. 1990;19(6):759–766. doi: 10.1068/p190759. [DOI] [PubMed] [Google Scholar]
- Engel FL. Visual conspicuity, directed attention and retinal locus. Vision Research. 1971;11(6):563–576. doi: 10.1016/0042-6989(71)90077-0. [DOI] [PubMed] [Google Scholar]
- Fuller S, Carrasco M. Perceptual consequences of visual performance fields: The case of the line motion illusion. Journal of Vision. 2009;9(4):13, 1–17. doi: 10.1167/9.4.13. [DOI] [PMC free article] [PubMed] [Google Scholar]
- Fuller S, Rodriguez RZ, Carrasco M. Apparent contrast differs across the vertical meridian: Visual and attentional factors. Journal of Vision. 2008;8(1):16, 1–16. doi: 10.1167/8.1.16. [DOI] [PMC free article] [PubMed] [Google Scholar]
- Geisler WS, Chou KL. Separation of low-level and high-level factors in complex tasks: Visual search. Psychological Review. 1995;102(2):356–378. doi: 10.1037/0033-295x.102.2.356. [DOI] [PubMed] [Google Scholar]
- Golla H, Ignashchenkova A, Haarmeier T, Thier P. Improvement of visual acuity by spatial cueing: A comparative study in human and non-human primates. Vision Research. 2004;44(13):1589–1600. doi: 10.1016/j.visres.2004.01.009. [DOI] [PubMed] [Google Scholar]
- Graham N, Rico M, Offen S, Scott W. Texture segregation shows only a very small lower-hemifield advantage. Vision Research. 1999;39(6):1171–1175. doi: 10.1016/s0042-6989(98)00170-9. [DOI] [PubMed] [Google Scholar]
- Gurnsey R, Pearson P, Day D. Texture segmentation along the horizontal meridian: Nonmonotonic changes in performance with eccentricity. Journal of Experimental Psychology: Human Perception and Performance. 1996;22(3):738–757. doi: 10.1037//0096-1523.22.3.738. [DOI] [PubMed] [Google Scholar]
- He S, Cavanagh P, Intriliagator J. Attentional resolution and the locus of visual awareness. Nature. 1996;383(6598):334–337. doi: 10.1038/383334a0. [DOI] [PubMed] [Google Scholar]
- Intriligator J, Cavanagh P. The spatial resolution of visual attention. Cognitive Psychology. 2001;43(3):171–216. doi: 10.1006/cogp.2001.0755. [DOI] [PubMed] [Google Scholar]
- Kehrer L. Central performance drop on perceptual segregation tasks. Spatial Vision. 1989;4:45–62. doi: 10.1163/156856889x00040. [DOI] [PubMed] [Google Scholar]
- Kristjánsson A, Sigurdardottir HM. On the benefits of transient attention across the visual field. Perception. 2008;37(5):747–764. doi: 10.1068/p5922. [DOI] [PubMed] [Google Scholar]
- Kröse BJA, Julesz B. The control and speed of shifts of attention. Vision Research. 1989;29(11):1607–1619. doi: 10.1016/0042-6989(89)90142-9. [DOI] [PubMed] [Google Scholar]
- Levine MW, McAnany JJ. The relative capabilities of the upper and lower visual hemifields. Vision Research. 2005;45(21):2820–2830. doi: 10.1016/j.visres.2005.04.001. [DOI] [PubMed] [Google Scholar]
- Levitt H. Transformed up-down methods in psychoacoustics. Journal of the Acoustical Society of America. 1971;49(2):467–477. [PubMed] [Google Scholar]
- Ling S, Carrasco M. When sustained attention impairs perception. Nature Neuroscience. 2006;9(10):1243–1245. doi: 10.1038/nn1761. [DOI] [PMC free article] [PubMed] [Google Scholar]
- Liu T, Heeger DJ, Carrasco M. Neural correlates of the visual vertical meridian asymmetry. Journal of Vision. 2006;6(11):1294–1306. doi: 10.1167/5.1.1. [DOI] [PMC free article] [PubMed] [Google Scholar]
- Low FN. The peripheral visual acuity of 100 subjects. American Journal of Physiology. 1943a;140:83–88. doi: 10.1152/ajplegacy.1946.146.1.21. [DOI] [PubMed] [Google Scholar]
- Low FN. Studies on peripheral visual acuity. Science. 1943b;97(2530):586–587. doi: 10.1126/science.97.2530.586. [DOI] [PubMed] [Google Scholar]
- Lu ZL, Dosher BA. Spatial attention: Different mechanisms for central and peripheral temporal precues? Journal of Experimental Psychology: Human Perception and Performance. 2000;26(5):1534–1548. doi: 10.1037//0096-1523.26.5.1534. [DOI] [PubMed] [Google Scholar]
- Lundh BL, Lennerstrand G, Derefeldt G. Central and peripheral normal contrast sensitivity for static and dynamic sinusoidal gratings. Acta Ophthalmologica. 1983;61(2):171–182. doi: 10.1111/j.1755-3768.1983.tb01410.x. [DOI] [PubMed] [Google Scholar]
- Mackeben M. Sustained focal attention and peripheral letter recognition. Spatial Vision. 1999;12(1):51–72. doi: 10.1163/156856899x00030. [DOI] [PubMed] [Google Scholar]
- Maunsell JH, Van Essen DC. Topographic organization of the middle temporal visual area in the macaque monkey: Representational biases and the relationship to callosal connections and myeloarchitectonic boundaries. Journal of Comparative Neurology. 1987;266(4):535–555. doi: 10.1002/cne.902660407. [DOI] [PubMed] [Google Scholar]
- McAnany JJ, Levine MW. Magnocellular and parvocellular visual pathway contributions to visual field anisotropies. Vision Research. 2007;47(17):2327–2336. doi: 10.1016/j.visres.2007.05.013. [DOI] [PubMed] [Google Scholar]
- Michel M, Geisler WS. Intrinsic position uncertainty explains detection and localization performance in peripheral vision. Journal of Vision. 2011;1(1):18, 1–18. doi: 10.1167/11.1.18. [DOI] [PMC free article] [PubMed] [Google Scholar]
- Millodot M, Lamont A. Peripheral visual acuity in the vertical plane. Vision Research. 1974;14:1497–1498. doi: 10.1016/0042-6989(74)90031-5. [DOI] [PubMed] [Google Scholar]
- Moher J, Abrams J, Egeth HE, Yantis S, Stuphorn V. Distractor probability modulates oculomotor capture: Trial-by-trial adjustments of top-down set. Psychonomic Bulletin & Review. 2011;19(5):897–903. doi: 10.3758/s13423-011-0118-5. [DOI] [PMC free article] [PubMed] [Google Scholar]
- Montagna B, Pestilli F, Carrasco M. Attention trades off spatial acuity. Vision Research. 2009;49(7):735–745. doi: 10.1016/j.visres.2009.02.001. [DOI] [PMC free article] [PubMed] [Google Scholar]
- Montaser-Kouhsari L, Carrasco M. Perceptual asymmetries are preserved in short-term memory tasks. Attention, Perception And Psychophysics. 2009;71(8):1782–1792. doi: 10.3758/APP.71.8.1782. [DOI] [PMC free article] [PubMed] [Google Scholar]
- Najemnik J, Geisler WS. Eye movement statistics in humans are consistent with an optimal search strategy. Journal of Vision. 2008;8(3):4, 1–14. doi: 10.1167/8.3.4. [DOI] [PMC free article] [PubMed] [Google Scholar]
- Najemnik J, Geisler WS. Optimal eye movement strategies in visual search. Nature. 2005;434(7031):387–391. doi: 10.1038/nature03390. [DOI] [PubMed] [Google Scholar]
- Najemnik J, Geisler WS. Simple summation rule for optimal fixation selection in visual search. Vision Research. 2009;49(10):1286–1294. doi: 10.1016/j.visres.2008.12.005. [DOI] [PubMed] [Google Scholar]
- Nazir TA. Effects of lateral masking and spatial precueing on gapresolution in central and peripheral vision. Vision Research. 1992;32(4):771–777. doi: 10.1016/0042-6989(92)90192-l. [DOI] [PubMed] [Google Scholar]
- Palmer J, Verghese P, Pavel M. The psychophysics of visual search. Vision Research. 2000;40:1227–1268. doi: 10.1016/s0042-6989(99)00244-8. [DOI] [PubMed] [Google Scholar]
- Pelli DG. The VideoToolbox software for visual psychophysics: Transforming numbers into movies. Spatial Vision. 1997;10(4):437–442. [PubMed] [Google Scholar]
- Pelli DG, Palomares M, Majaj NJ. Crowding is unlike ordinary masking: Distinguishing feature integration from detection. Journal of Vision. 2004;4(12):1136–1169. doi: 10.1167/4.12.12. [DOI] [PubMed] [Google Scholar]
- Perry VH, Cowey A. The ganglion cell and cone distributions in the monkey’s retina: Implications for central magnification factors. Vision Research. 1985;25(12):1795–1810. doi: 10.1016/0042-6989(85)90004-5. [DOI] [PubMed] [Google Scholar]
- Pestilli F, Viera G, Carrasco M. How do attention and adaptation affect contrast sensitivity? Journal of Vision. 2007;7(7):9, 1–12. doi: 10.1167/7.7.9. [DOI] [PMC free article] [PubMed] [Google Scholar]
- Pointer JS, Hess RF. The contrast sensitivity gradient across the human visual field: With emphasis on the low spatial frequency range. Vision Research. 1989;29(9):1133–1151. doi: 10.1016/0042-6989(89)90061-8. [DOI] [PubMed] [Google Scholar]
- Pointer JS, Hess RF. The contrast sensitivity gradient across the major oblique meridians of the human visual field. Vision Research. 1990;30(3):497–501. doi: 10.1016/0042-6989(90)90090-8. [DOI] [PubMed] [Google Scholar]
- Popple AV, Levi DM. Location coding by the human visual system: Multiple topological adaptations in a case of strabismic amblyopia. Perception. 2005;34(1):87–107. doi: 10.1068/p5345. [DOI] [PubMed] [Google Scholar]
- Pretorius LL, Hanekom JJ. An accurate method for determining the conspicuity area associated with visual targets. Human Factors. 2007;48(4):774–784. doi: 10.1518/001872006779166370. [DOI] [PubMed] [Google Scholar]
- Previc FH. Functional specialization in the lower and upper visual field in humans: Its ecological origins and neurophysiological implications. Behavioral and Brain Sciences. 1990;13(3):519–575. [Google Scholar]
- Previc FH, Intraub H. Vertical biases in scene memory. Neuropsychologia. 1997;35(12):1513–1517. doi: 10.1016/s0028-3932(97)00091-2. [DOI] [PubMed] [Google Scholar]
- Rajimehr R, Tootell BH. Does retinotopy influence cortical folding in primate visual cortex? Journal of Neuroscience. 2009;29(36):11149–11152. doi: 10.1523/JNEUROSCI.1835-09.2009. [DOI] [PMC free article] [PubMed] [Google Scholar]
- Regan D, Beverley KI. Visual fields described by contrast sensitivity, by acuity, and by relative sensitivity to different orientations. Investigative Ophthalmology & Visual Science. 1983;24(6):754–759. [PubMed] [Google Scholar]
- Rezec AA, Dobkins KR. Attentional weighting: A possible account of visual field asymmetries in visual search? Spatial Vision. 2004;17(4–5):269–293. doi: 10.1163/1568568041920203. [DOI] [PubMed] [Google Scholar]
- Rijsdijk JP, Kroon JN, van der Wildt GJ. Contrast sensitivity as a function of position on the retina. Vision Research. 1980;20(3):235–241. doi: 10.1016/0042-6989(80)90108-x. [DOI] [PubMed] [Google Scholar]
- Robson JG, Graham N. Probability summation and regional variation in contrast sensitivity across the visual field. Vision Research. 1981;21(3):409–418. doi: 10.1016/0042-6989(81)90169-3. [DOI] [PubMed] [Google Scholar]
- Rovamo RJ, Virsu V, Laurinen P, Hyvärinen L. Resolution of gratings oriented along and across meridians in peripheral vision. Investigative Ophthalmology and Visual Science. 1982;23(5):666–670. [PubMed] [Google Scholar]
- Rubin N, Nakayama K, Shapley R. Enhanced perception of illusory contours in the lower versus upper visual hemifields. Science. 1996;271(5249):651–653. doi: 10.1126/science.271.5249.651. [DOI] [PubMed] [Google Scholar]
- Sakaguchi Y. Visual field anisotropy revealed by perceptual filling-in. Vision Research. 2003;43(19):2029–2038. doi: 10.1016/s0042-6989(03)00305-5. [DOI] [PubMed] [Google Scholar]
- Seiple W, Holopigian K, Szlyk JP, Wu C. Multidimensional visual field maps: Relationships among local psychophysical and local electrophysiological measures. Journal of Rehabilitation Research and Development. 2004;41(3A):359–372. doi: 10.1682/jrrd.2003.07.0111. [DOI] [PubMed] [Google Scholar]
- Silva MF, Mateus C, Reis A, Nunes S, Fonseca P, Castelo-Branco M. Asymmetry of visual sensory mechanisms: Electrophysiological, structural, and psychophysical evidences. Journal of Vision. 2010;10(6):26, 1–11. doi: 10.1167/10.6.26. [DOI] [PubMed] [Google Scholar]
- Silva MF, Maia-Lopes S, Mateus C, Guerriero M, Sampaio J, Faria P, et al. Retinal and cortical patterns of spatial anisotropy in contrast sensitivity tasks. Vision Research. 2008;48(1):127–135. doi: 10.1016/j.visres.2007.10.018. [DOI] [PubMed] [Google Scholar]
- Skrandies W. Human contrast sensitivity: Regional retinal differences. Human Neurobiology. 1985;4(2):97–99. [PubMed] [Google Scholar]
- Talgar CP, Carrasco M. Vertical meridian asymmetry in spatial resolution: Visual and attentional factors. Psychonomic Bulletin & Review. 2002;9(4):714–722. doi: 10.3758/bf03196326. [DOI] [PubMed] [Google Scholar]
- Talgar CP, Pelli DG, Carrasco M. Covert attention enhances letter identification without affecting channel tuning. Journal of Vision. 2004;4(1):22–31. doi: 10.1167/4.1.3. [DOI] [PubMed] [Google Scholar]
- Toet A, Levi DM. The two-dimensional shape of spatial interaction zones in the parafovea. Vision Research. 1992;32(7):1349–1357. doi: 10.1016/0042-6989(92)90227-a. [DOI] [PubMed] [Google Scholar]
- Tootell RB, Switkes E, Silverman MS, Hamilton SL. Functional anatomy of macaque striate cortex. II. Retinotopic organization. Journal of Neuroscience. 1988;8(5):1531–1568. doi: 10.1523/JNEUROSCI.08-05-01531.1988. [DOI] [PMC free article] [PubMed] [Google Scholar]
- Van Essen DC, Newsome WT, Maunsell JH. The visual field representation in striate cortex of the macaque monkey: Asymmetries, anisotropies, and individual variability. Vision Research. 1984;24(5):429–448. doi: 10.1016/0042-6989(84)90041-5. [DOI] [PubMed] [Google Scholar]
- Vecera SP, Vogel EK, Woodman GF. Lower region: A new cue for figure-ground assignment. Journal of Experimental Psychology: General. 2002;131(2):194–205. doi: 10.1037//0096-3445.131.2.194. [DOI] [PubMed] [Google Scholar]
- Verghese P, Nakayama K. Stimulus discriminability in visual search. Vision Research. 1994;34(18):2453–2467. doi: 10.1016/0042-6989(94)90289-5. [DOI] [PubMed] [Google Scholar]
- Virsu V, Rovamo J. Visual resolution, contrast sensitivity, and the cortical magnification factor. Experimental Brain Research. 1979;37(3):475–494. doi: 10.1007/BF00236818. [DOI] [PubMed] [Google Scholar]
- Wichmann FA, Hill NJ. The psychometric function: I. Fitting, sampling, and goodness of fit. Perception & Psychophysics. 2001a;63(8):1293–1313. doi: 10.3758/bf03194544. [DOI] [PubMed] [Google Scholar]
- Wichmann FA, Hill NJ. The psychometric function: II. Bootstrap-based confidence intervals and sampling. Perception & Psychophysics. 2001b;63(8):1314–1329. doi: 10.3758/bf03194545. [DOI] [PubMed] [Google Scholar]