Abstract
No reliable non-invasive glucose monitoring devices are currently available. We implemented a mid-infrared (MIR) photoacoustic (PA) setup to track glucose in vitro in deep epidermal layers, which represents a significant step towards non-invasive in vivo glucose measurements using MIR light. An external-cavity quantum-cascade laser (1010–1095 cm−1) and a PA cell of only 78 mm3 volume were employed to monitor glucose in epidermal skin. Skin samples are characterized by a high water content. Such samples investigated with an open-ended PA cell lead to varying conditions in the PA chamber (i.e., change of light absorption or relative humidity) and cause unstable signals. To circumvent variations in relative humidity and possible water condensation, the PA chamber was constantly ventilated by a 10 sccm N2 flow. By bringing the epidermal skin samples in contact with aqueous glucose solutions with different concentrations (i.e., 0.1–10 g/dl), the glucose concentration in the skin sample was varied through passive diffusion. The achieved detection limit for glucose in epidermal skin is 100 mg/dl (SNR=1). Although this lies within the human physiological range (30–500 mg/dl) further improvements are necessary to non-invasively monitor glucose levels of diabetes patients. Furthermore spectra of epidermal tissue with and without glucose content have been recorded with the tunable quantum-cascade laser, indicating that epidermal constituents do not impair glucose detection.
OCIS codes: (110.5125) Photoacoustics; (140.5965) Semiconductor lasers, quantum cascade; (170.1470) Blood or tissue constituent monitoring; (170.6510) Spectroscopy, tissue diagnostics
1. Introduction
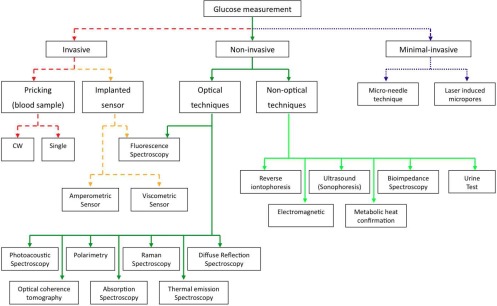
Diabetes mellitus is a widespread human disease with worldwide 346 million persons concerned and an estimated 3.4 million deaths due to high blood glucose level per year [1]. Currently no treatment exists or is under development which could possibly cure this illness in the near future. The therapy of diabetes mellitus so far consists in monitoring the blood glucose (BG) level of a patient to avoid the danger of hypo- and hyperglycemia and to assist in adjusting the diet and medical treatment. To monitor the blood sugar level as accurate as possible frequent measurements are required. Until today this involves puncturing the fingertip with a lancing device to obtain a drop of blood. The blood sample is placed on a test strip and usually analyzed via an electrochemical reaction. This expensive procedure is uncomfortable especially if frequently performed, it bears the risk of infections and does not represent a continuous measurement technique, which would be ideal for glycemic control [2]. Hence a non-invasive glucose sensor would greatly increase the quality of life of diabetes patients. Despite intensive research towards a non-invasive glucose monitoring method since more than 25 years still no reliable commercial sensor exists, which circumvents the need of blood sample taking. An overview of the broad research activity and numerous companies involved in this area is given in review articles [3–6]. Figure 1 summarizes the vast field of glucose measurement techniques and distinguishes three different categories: invasive, minimal invasive and non-invasive approaches. Optical techniques like polarimetry [7, 8], Raman spectroscopy [9, 10], diffuse reflection spectroscopy [11, 12], absorption spectroscopy [13–15], thermal emission spectroscopy [16, 17], fluorescence spectroscopy [18, 19] and photoacoustic (PA) spectroscopy [20–22] have been used to sense glucose with respect to non-invasive monitoring.
Fig. 1.
Overview of possible techniques and active research areas for in-vivo glucose measurements.
Most of the optical attempts use near-infrared (NIR) light because it can penetrate up to several mm into human tissue. Unfortunately, glucose absorption in this wavelength region is weak and interferes strongly with other blood and tissue components [23–25], which hampered a breakthrough to non-invasive glucose monitoring. Attempts using NIR PA spectroscopy [21, 22, 26–29] mainly employ pulsed lasers as excitation sources.
On the contrary, glucose shows strong characteristic absorption and interferes less with other tissue components in the mid-infrared (MIR) spectral region [5]. However, MIR light only penetrates up to 100 μm into human skin due to the strong water absorption [30, 31]. As a consequence glucose has to be sensed within the interstitial fluid (ISF) of the epidermis since blood capillaries are not reached. Metabolites and proteins diffuse into the ISF on their way from capillaries to cells. This leads to a strong correlation of BG levels and ISF glucose concentration within the physiological range as confirmed in clinical trails [32]. In the ISF small-to-moderate sized molecules, like glucose (or ethanol), are present in the same proportion as in blood. Hence a frequent calibration with blood measurements is not necessary [33]. The diffusion process leads to a delayed increase of the glucose concentration in the ISF, which is stated to be between 5 to 15 minutes [13, 34]. In general the outer skin layers have a greater time delay and smaller glucose concentration maxima. Concerning the correlation for decreasing glucose concentration some uncertainty persists, but there is most likely no time delay due to the high glucose clearance from epidermal ISF [35]. The outer most layer of the skin, the stratum corneum (SC) - consisting of cell remains (i.e. dead cells) - acts as a barrier to protect the human body from mechanical, chemicals or microbiological impacts from the surrounding [36]. Moreover the SC is responsible to prevent transepidermal water loss. This layer is only 10 – 20 μm thick (except at the sole of foot and the palm, where it can reach up to several mm), has a water content of approximately 10 % [31, 37] and contains marginal amounts of glucose. Thus in vivo glucose sensing has to involve skin layers deeper than the SC. For in vitro studies of blood samples or homogeneous tissue phantoms, the penetration depth is not important since glucose can be detected at the surface. In such experiments glucose concentrations can be readily tracked using MIR light. Some research groups employed a quantum cascade laser (QCL) or a FTIR spectrometer to perform transmission measurements with glucose detection limits of 13.8 mg/dl (in whole blood) [38], 9.4 mg/dl [39] and 4 mg/dl [13] (both in aqueous solution). Unfortunately, these sensitive measurements are hardly convertible to in vivo sensing and therefore of little benefit to non-invasive glucose sensing. Guo et al. used wavelength-modulated differential laser photothermal radiometry with two QCLs at 9.5 and 10.4 μm (i.e., on and off a glucose absorption peak) to measure glucose concentrations (0 – 440 mg/dl) in an homogeneous aqueous phantom [17]. With a pulsed CO2 laser and a PA detection Christison et al. measured glucose concentrations in aqueous solutions and whole-blood (18 – 450 mg/dl) [40]. These two approaches have the potential of adapting from a laboratory setup to a small-sized portable sensor in the future. However, both approaches sense glucose concentrations at the sample surface and not in deep epidermal layers as required for in vivo studies. An attempt to apply MIR PA measurements to in vivo glucose sensing was recently reported by Lilienfeld-Toal at al. [41, 42] but could only indicate a qualitative correlation between BG and ISF glucose concentration.
We developed a laser PA detection scheme using an external-cavity quantum cascade laser (tuning range 1010 – 1095 cm−1) as light source and a small-volume PA cell for detection. This setup bears the potential to shrink from a table size apparatus to a handheld device. When investigating epidermal skin samples having a high water content, challenges are the detection of a weak PA signal due to glucose on a strong water background and humidity variations in the PA chamber due to the evaporation of water. To stabilize the conditions in the PA chamber (i.e., to maintain a constant relative humidity) for sensitive measurements, a constant N2 flow is applied to ventilate the cell. Here we report on the performance of this setup by measuring glucose concentration changes through the SC in human epidermis in vitro. This is a significant step compared to former measurements since it demonstrates the tracking of glucose by MIR light not only at the surface but in lower epidermal skin layers. Furthermore by tuning the QCL a spectrum of human epidermis with and without the presence of glucose could be recorded.
2. Photoacoustic signal generation
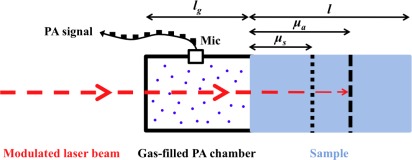
The PA signal generation in solid samples has been described mathematically first by Rosencwaig and Gersho. Using an indirect PA detection, namely a detection of the generated PA signal in a strongly absorbing solid in a gas-filled PA chamber adjacent to the solid surface is described by their thermal piston model [43]. Depending on the optical and thermal properties of the solid sample with respect to its length l, this model distinguishes six different cases. The most important case for our application (l > μa > μs) is pictured in Fig. 2. Here μa = 1/α denotes the absorption length in the sample (α: absorption coefficient at the employed wavelength λ), denotes the thermal diffusion length with the thermal diffusivity Ds and the modulation frequency f of the incident radiation. Hence the thermal diffusion length μs can be controlled by f.
Fig. 2.
Definition of lengths used to distinguish between the different cases in the Rosencwaig Gersho model. lg denotes the length of the gas-filled PA chamber, l the sample length, μa=1/α the optical absorption length and μs the thermal diffusion length. In this figure a length ratio of l > μa > μs is pictured, as occurring in the samples investigated in this work. The periodical PA signal is detected with a microphone (Mic).
For our case (l > μa > μs) the PA signal amplitude APA is given by [44]
| (1) |
where γ=Cp/Cv is the ratio of specific heats of the coupling gas at constant pressure and volume, P0 and T0 are the ambient pressure and temperature, respectively, I0 is the incident laser intensity (beam radius r), Dg is the thermal diffusivity of the coupling gas, ks the thermal conductivity of the solid and V0 the volume of the PA cell.
According to Eq. (1) a temperature change in the PA chamber directly translates to a 1/T0-dependence of the generated pressure amplitude APA. A variation of the relative humidity (RH) in the coupling gas, however, only indirectly influences the PA signal via Dg. At room temperature a coupling gas exchange from water-saturated air to pure N2 causes an estimated increase of Dg of 5.3 %, i.e., of APA of 28 %, whereas a change from dry air to a pure N2 atmosphere causes an increase of APA by only 2.8 %. The variation of the specific heat ratio γ by a change of the composition of the coupling gas can be neglected as it contributes <1% to the total signal change. At higher RH the scattering and the absorption of light in the coupling gas might also increase. However, these contributions depend strongly on the cell geometry - particularly the length of the gas-filled PA chamber lg (see Fig. 2) and the microphone position - and the excitation wavelength.
For a biological sample like human skin considered here, which is characterized by a high water content, the penetration of MIR light is small due to the strong water absorption in this wavelength region. Hence the sample length l is usually larger than the optical penetration depth μa (i.e., l > μa). By adjusting the modulation frequency f one can vary the thermal diffusion length of the sample μs and restrict the discussion to the case where Eq. (1) holds. Hence, the signal amplitude APA recorded in the PA cell with a microphone shows the dependence
| (2) |
i.e., the PA signal directly scales with the incident intensity and the absorption coefficient of the sample.
3. Experimental setup
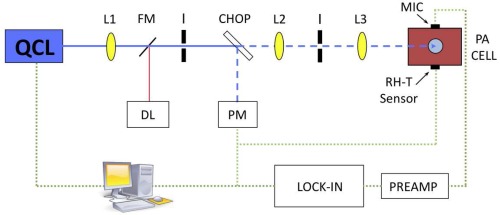
The PA setup is pictured in Fig. 3. An external-cavity quantum cascade laser (EC-QCL) (Daylight Solutions DLS-TLS-001-PL) is employed as excitation source. The EC-QCL is tunable in 0.9 cm−1 wavenumber steps from 1010 – 1095 cm−1 via the external grating. Fine tuning can be obtained by changing the temperature of the QCL chip. The QCL covers a range of glucose absorption in the MIR, with two strong absorption peaks at 1034 and 1080 cm−1. The maximal average laser power lies between 20 mW (at 1010 cm−1) and 130 mW (at 1055 cm−1) depending on the emission wavelength. Normally the sample was irradiated with 30 to 40 mW average power during measurements. A mechanical chopper (New Focus Model 3501) modulates the continuous-wave (cw) laser light, which is focused by several anti-reflection coated ZnSe lenses into the PA cell. The beam passes the PA chamber and is absorbed in the sample sealing the cell. This leads to the generation of an acoustic wave in the coupling gas which is sensed with an electret microphone (Knowles FG-23329-P07). The microphone has a diameter of only 2.59 mm, a flat frequency response from 100 Hz to 10 kHz and a sensitivity of 53 dB (relative to 1.0 V/0.1 Pa). The small microphone diameter allows a compact cell design with a small volume V0 which is favorable in terms of signal amplitude (see Eq. (2)) and sensor size. The detected PA signal is pre-amplified and measured with a lock-in amplifier (Stanford Research SR830) before being stored in a computer. The temperature and the RH are recorded simultaneously with a simple sensor (Sensirion SHT21, 3 mm x 3 mm x 1.1 mm) with an accuracy of ± 0.4 K and ± 3 %, respectively, to monitor the conditions inside the PA chamber.
Fig. 3.
Setup for photoacoustic measurements: QCL = quantum cascade laser, FM = flipping mirror, L = lens, I = Iris, DL = diode laser (for alignment tasks), CHOP = chopper, PM = power meter, MIC= microphone and RH-T = relative humidity-temperature sensor.
3.1. Photoacoustic cell design
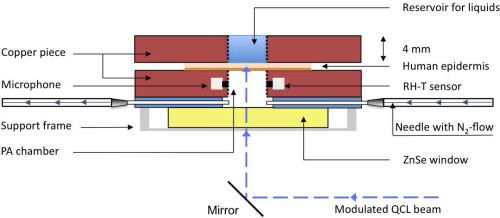
A special PA cell which allows measurements on human skin samples in contact with aqueous glucose solution has been developed. The transversal cross section of the PA cell with the attached sample and reservoir for liquids is depicted in Fig. 4. The PA cell and the sample reservoir are constructed out of a copper block (4 x 25 x 35 mm). The PA chamber has a volume V of only 78.5 mm3 (radius r = 2.5 mm and h = 4 mm), is polished and gold-coated on the inner surface to minimize spurious PA signals due to absorption on the cell walls. The laser beam passes perpendicularly through an anti-reflection coated ZnSe window, which seals the PA cell on the bottom side. The ZnSe window is pressed on a thin rubber sheet into which two thin needles (length = 19 mm and inner diameter = 0.4 mm) have been introduced. One of the needles is connected via silicon tubes to a mass flow controller (MKS Instruments, Multi Gas Controller 647B) providing a constant flow of N2 to the cell. The other needle is left open. This guarantees stable conditions in the PA chamber, necessary for precise measurements. At half height the microphone and the temperature and RH sensor are connected through cylindrical holes (length = 1 mm, diameter = 1 mm) to the PA chamber. On the sample side the PA chamber is separated from the reservoir for liquids by a 70 – 100 μm thick human epidermal skin sample. To allow measurements of other samples, which do not provide a rigid closure of the PA cell or if measuring without N2 ventilation is preferred, the cell can be sealed with a thin chemical vapor deposition (CVD) diamond window (Diamond Materials). The diamond window assures stable conditions in the PA chamber and due to the favorable thermal and optical properties of diamond strong PA signals of the sample are obtained. A detailed description of the diamond-window closed cell can be found elsewhere [20, 45].
Fig. 4.
Schematic of the PA cell and the attachable reservoir for liquids. The PA cell is closed directly by the sample itself (i.e., human skin sample). N2 ventilation is needed, if the PA chamber is closed with a sample containing volatile components.
3.2. Preparation of epidermal skin sample
Epidermal sheets were isolated from forskins obtained from the University Childrens Hospital of Zurich after routine circumcisions. All patients (and/or their parents) gave their written consent for this study in accordance with the Ethics Commission of the Canton Zurich (notification no. StV-12/06). Foreskins were cut into approximately 2 cm2 pieces and digested for 15–18 hours at 4°C in 12 U/ml dispase in Hanks buffered salt solution containing 5 mg/ml gentamycin. Thereafter, the epidermis and the dermis could be easily separated using forceps. Epidermal sheets were stored in a transport medium (DMEM with 1% penicillin/streptomycin) until further application.
4. Results and Discussion
4.1. RH dependence in PA measurements
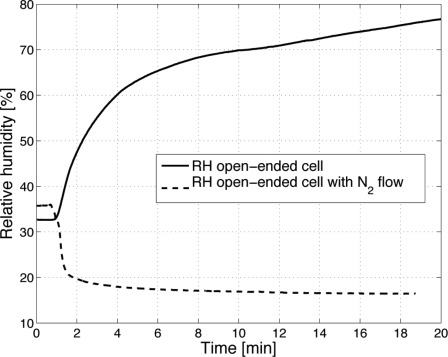
If biological samples with a high water content are investigated with an open-ended PA cell the evaporation of water causes a steady increase in RH until saturation is reached. This results in water condensation within the PA chamber and makes sensitive measurements impossible. In Fig. 5 the RH evolution in the PA chamber during a measurement without laser irradiation of an epidermal skin sample is shown. Even though the SC has a low permeability for water, the RH reaches a level of over 70 % within less than 10 min and still rises further. With laser irradiation the RH increase is even more pronounced [20]. In vivo this process is even accelerated due to the transpiration of the human body. If a constant N2 flow (10 standard cubic centimeters per minute (sccm)) is applied to the PA chamber the RH falls within 2 min to less than 20 % and stabilizes at a low level (see Fig. 5).
Fig. 5.
Relative humidity (RH) evolution in the PA chamber after placing it on an epidermal skin sample. In the open-ended PA cell (solid line) the RH constantly increases, until it finally leads to condensation. With N2 ventilation the RH decreases below 20 % and stabilizes.
The N2 ventilation causes an increase of the pressure in the PA chamber. For N2 flow rates between 0 and 40 sccm the pressure dependence is linear. At atmospheric pressure a 10 sccm rise in the flow rate results in an approximately 1 % increase in the PA signal amplitude, which has to be taken into account for quantitative measurements.
4.2. Diffusion of glucose into epidermal skin
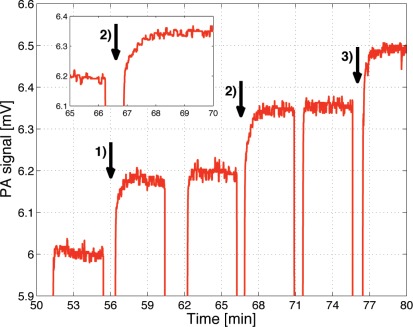
For the investigation of glucose penetration into epidermal skin the PA chamber is directly closed with the skin sample (see Fig. 4). The epidermal skin is fixed on the cell with the stratum corneum towards the PA chamber and the liquid reservoir placed on the lower epidermal layers. To induce varying glucose concentration in the epidermal skin sample, differently concentrated solutions (i.e., D-(+)-glucose (Sigma Aldrich) dissolved in distilled water) were placed in the sample reservoir (see Fig. 4). The lower epidermal skin layers are in direct contact with the solution. Like in vivo, an exchange of constituents (here mainly water and glucose) occurs through passive diffusion. In Fig. 6 consecutive PA measurements using different glucose concentrations are shown. The measurements were performed at 1034 cm−1 (absorption peak of glucose) with a modulation frequency of 137 Hz, 30 mW average power and an integration time of 1 s. Each time the sample solution was exchanged, the laser beam was blocked and the PA signal fell to zero. Immediately after replacing the sample solution the shutter was reopened. The arrows (numbered 1) - 3)) indicate a 1 g/dl increase of the glucose concentration of the consecutive samples. For higher concentration the PA signal is larger as expected but after increasing the concentration, approximately 90 seconds are needed to reach a stable signal as can be seen in the inset of Fig. 6. This is due to the time the glucose needs to diffuse from the sample solution into the epidermal skin. It indicates that the time delay between BG and ISF glucose concentration in vivo should be small (5–15 min as stated in literature [13, 34]). Once a steady glucose concentration profile is obtained within the epidermal skin sample a stable PA signal is measured.
Fig. 6.
Time dependence of the PA signal for consecutive sample solutions with different glucose concentration. During sample exchange, the laser beam was blocked, which leads to the sharp signal decrease. The arrows mark positions where the glucose concentration of the consecutive sample solution was increased by 1 g/dl compared to the previous one. The inset implies that a time of approximately 90 s is necessary to establish a stable glucose concentration profile within the epidermal skin sample.
If the glucose concentration is increased shortly after reopening the shutter the PA signal is still on the same level as before, which shows that the signal contribution from the glucose solution itself is negligibly small. A rough estimation of the optical penetration depth of skin at 1034 cm−1 - assuming water to be the main absorbing component with a 10 % water content in a 20 μm thick SC and a 60 % water content in the lower epidermal layer - yields 45 μm. This is an upper limit of the penetration since other absorbing components have been neglected. It confirms that the generated PA signal almost entirely originates from the epidermal skin sample (70 – 100 μm thick) and not from the underlying glucose solution (i.e., l > μa > μs as required for Eq. (2)).
4.3. Glucose detection in epidermal skin samples
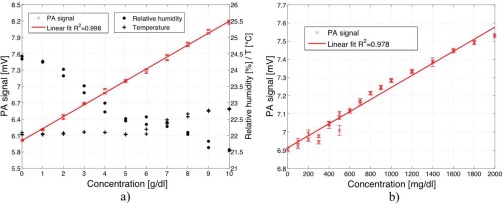
According to the procedure described in section 4.2 different glucose concentrations were generated in the epidermal skin sample. In Fig. 7 a) the dependence of the PA signal on glucose concentration in the epidermal skin sample is pictured. The data points 2 – 7 (i.e., up to 3 g/dl) correspond to the signals displayed in Fig. 6 and were obtained after averaging for each sample solution. A low modulation frequency (i.e., 137 Hz) was chosen to ensure a long thermal diffusion length to access not only optical but also thermal information from deeper skin layers (see Section 2). The PA signal linearly depends on the glucose concentration within the large concentration range of 0 to 10 g/dl, indicating that even for the highest concentration the requirements for Eq. (2) (i.e., l > μa > μs) still hold. This would not be the case in pure water since the optical absorption length for water is 17 μm (absorption coefficient of water at 1034 cm−1: α1034 = 590 cm−1) which is smaller than its thermal diffusion length for a modulation frequency of 137 Hz (μs = 19 μm) even without added glucose. Due to a water content of only 10 % in the SC and of approximately 60 % in the other epidermal layers the optical absorption length might be up to 45 μm as discussed in section 4.2, resulting in the observed linear dependence of the PA signal on the glucose concentration.
Fig. 7.
a) PA signal dependence on glucose concentration in a human epidermal skin sample (0 – 10 g/dl). A simultaneous measurement of RH (•) and temperature (+) allows to compensate PA signal changes due to a variation of these parameters. Compensation for these drifts leads to an improved correlation between the PA signal and the glucose concentration (R2=0.998). b) PA signal dependence on glucose concentration in a human epidermal skin sample for lower concentrations (0 – 2000 mg/dl).
The RH and the temperature in the PA chamber were monitored simultaneously with the measurement of the PA signal as shown in Fig. 7 a). Thanks to the N2 ventilation variations in RH are small. Nevertheless fluctuations occur especially when long time measurements are performed. Recording the RH and temperature enables to compensate PA signal amplitude fluctuations caused by a variation of these parameters (see Section 2). Since the PA cell length is rather short (i.e., 4 mm) and the water-vapor absorption within the tuning range of the QCL is weak (except at 1066 cm−1) the contribution of the gas absorption is negligible. If the level of RH is well below saturation the effect of MIR scattered light around 10 μm is small especially since the microphone is connected via a tube with the PA chamber. For the PA cell geometry used in this work a somewhat larger PA signal increase with increasing RH is experimentally observed compared to the one predicted solely from the parameter change of Dg and γ. Including the mathematical compensation for RH and temperature drifts improves the correlation between the PA signal and the glucose concentration leading to a R2 of 0.998 (see Fig. 7 a)).
Figure 7 b) shows PA signals for lower glucose concentration (0 – 2000 mg/dl), i.e., including the physiological range of 30 – 500 mg/dl. The error-bars correspond to twice the standard deviation (± σ) using a lock-in integration time of 1 s. This yields a detection limit for glucose in epidermal skin samples of 100 mg/dl with signal-to-noise ratio (SNR) of 1. The detection limit is not restricted by the sensitivity of the PA device itself as previous measurements imply [20] but mainly caused by the mechanical instability of the thin epidermis. A small pressure change in the PA chamber or a variation of the liquid amount in the reservoir alters the position of the epidermis slightly (i.e., upwards or downwards bending) and causes fluctuations in the generated PA signal. Once the solution is placed in the reservoir the PA signal fluctuations are very small. Only for long time measurements during which a significant part of the water evaporates into the surrounding and hence alters the water amount in the reservoir, drifts of the PA signal are observed. These measurements demonstrate the ability of the MIR PA technique to detect glucose within deep epidermal skin layers.
4.4. Spectra of epidermal skin samples
The tuning capability of the EC-QCL enables the recording of a PA spectrum from 1010 to 1095 cm−1. This covers two strong glucose absorption peaks at 1034 and 1080 cm−1. When tuning the EC-QCL by rotating the grating, the cavity length is not maintained and mode-hops occur approximately every 0.9 cm−1. Fine tuning is obtained by adjusting the temperature of the QCL chip with a thermoelectric cooler.
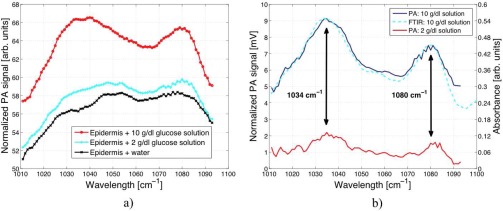
For the measurements pictured in Fig. 8 a) distilled water, 2 g/dl and 10 g/dl aqueous glucose solutions were successively placed in the liquid reservoir. After the completion of the diffusion process a stable PA signal was obtained. The EC-QCL was then tuned via the external grating in steps of 1 cm−1 to record a PA spectrum. Due to the wavelength-dependent QCL output intensity the PA signal is power normalized. The spectrum of the epidermal skin in contact with water shows four unresolved absorption peaks at 1032, 1048, 1052 and 1076 cm−1. In the 1010 to 1095 cm−1 fingerprint region covered by the QCL nucleic acids, carbohydrated lipids and proteins show characteristic C-O-P, C-O-C and C-C vibrations [46]. By comparing the measured peak positions to the FTIR spectra of SC reported by Garidel [36] the absorption peak at 1076 cm−1 can be assigned to the symmetric stretch between 1070 – 1080 cm−1. Its exact position significantly depends on the presence of cations and hydration effects. Additional IR contributions arise from the ν(CC) skeletal trans conformation (1077 cm−1) and cis conformation (1032 cm−1) [47, 48]. The double peaks at 1048 and 1052 cm−1 might be caused by a C-OP stretch (1047 cm−1 [36]) and albumin absorption (1052 cm−1 [42]). However the exact assignment of the vibrational modes is difficult since in literature the focus usually lies on the stronger absorption peaks like the amide I and amide II absorption at 1650 and 1550 cm−1, respectively, which can be used for example to determine the water content of the SC [49, 50]. The subtraction of the pure water and epidermal skin spectrum from the spectra with 2 and 10 g/dl glucose in Fig. 8 a) reveals the glucose spectrum with its two prominent absorption peaks at 1034 and 1080 cm−1 (see Fig. 8 b)). For comparison a FTIR attenuated total reflection (ATR) spectrum of a corresponding glucose solution (with subtracted water background) recorded with a resolution of 1 cm−1 is pictured in Fig. 8 b). This shows good agreement with the PA spectrum and demonstrates the possibility of recording a glucose spectrum in a human epidermal skin sample.
Fig. 8.
a) PA spectrum of a human epidermal skin sample in contact with water x, 2 g/dl (
 ) and 10 g/dl glucose solution (
 ). b) PA spectrum of different glucose concentrations (2 and 10 g/dl) in human epidermal skin samples with subtracted water and skin background. A comparison of a FTIR attenuated total reflection spectrum of glucose shows a good correlation with the PA measurement.
5. Conclusion
The N2 ventilated PA cell has proven to provide stable measurement conditions for the investigation of biological samples with high water content. Measurements on human epidermal skin samples showed that RH decreases within less than 2 min from room RH to below 20 %.
Different glucose concentrations were generated in the epidermal skin sample by passive diffusion from a glucose solution in contact with the lower epidermal layers. This process takes approximately 90 s, which confirms that in in vivo measurements a short time delay between BG and ISF glucose concentration is expected. Due to the construction of the human epidermis the outer most layer, the SC, contains negligible glucose concentrations. Hence by placing the PA cell on the SC it is necessary to measure glucose through the 10 – 20 μm thick SC. Our PA setup is able to sense glucose through the SC in the lower epidermal skin layers with a detection limit of 100 mg/dl (SNR=1). It is currently limited by the mechanical stability of the thin skin sample (<100 μm). These measurements represent a significant step towards in vivo glucose sensing since they prove the feasibility of tracking glucose in vitro within lower epidermal layers despite the limited penetration depth of MIR light into human skin. Epidermal skin samples as used in our study match in vivo conditions rather well and the measurements thus demonstrate that possible spectral interferences with other epidermal constituents do not significantly disturb the glucose detection.
The obtained detection limit of glucose in epidermal skin lies within the physiological range (30 – 500 mg/dl) but is still too high for in vivo glucose monitoring of diabetes patients. For in vivo measurements the sensor has to be placed directly on the human skin which then provides a rigid seal of the PA cell. A lower detection could thus be expected. Earlier measurements with a similar PA cell yielded a detection limit of 33 mg/dl (SNR=1) yet in aqueous solutions [20]. If this detection limit of glucose could be reached in vivo the sensitivity would be very close to the ± 20 mg/dl accuracy needed for an FDA approval of the sensor. However, in vivo measurements bear additional problems caused by blood pulsation, movements of the patient or different skin types which renders in vivo glucose sensing more challenging. First in vivo measurements with the presented sensor showed, in addition to the laser-induced PA signal, a periodic signal caused by blood pulsation (0.8–1.2 Hz) [45]. This periodic signal is weak and visible only if short lock-in integration times (∼ 3 ms) are employed. Since lock-in integrations times of typically 1 s are used for glucose sensing, blood pulsation only minimally affects the measurements.
To improve the current glucose detection limit of the sensor simple measurements using a reference wavelength (i.e., with no glucose absorption) or an out-of-phase excitation at a reference wavelength could be envisaged. Both approaches reduce problems caused by long-term drift whereas the second technique - successfully employed in photothermal radiometry [17] - also eliminates the large inherent background signal from the sample itself.
Acknowledgments
The authors gratefully acknowledge the financial support from GlucoMetrix NIB & Non Invasive Diagnostic GmbH and ETH Zurich.
References and links
- 1.WHO, “Diabetes,” http://www.who.int/mediacentre/factsheets/fs312/en/
- 2.Renard E., “Monitoring glycemic control: the importance of self-monitoring of blood glucose,” Am. J. Med. 118, 12S–19S (2005) 10.1016/j.amjmed.2005.07.052 [DOI] [PubMed] [Google Scholar]
- 3.do Amaral C. E. F., Wolf B., “Current development in non-invasive glucose monitoring,” Med. Eng. Phys. 30, 541–549 (2008). 10.1016/j.medengphy.2007.06.003 [DOI] [PubMed] [Google Scholar]
- 4.Khalil O. S., “Spectroscopic and clinical aspects of noninvasive glucose measurements,” Clin. Chem. 45, 165–177 (1999). [PubMed] [Google Scholar]
- 5.Khalil O. S., “Non-invasive glucose measurement technologies: An update from 1999 to the dawn of the millennium,” Diabetes Technol. Ther. 6, 660–697 (2004). 10.1089/dia.2004.6.660 [DOI] [PubMed] [Google Scholar]
- 6.McNichols R. J., Coté G. L., “Optical glucose sensing in biological fluids: an overview,” J. Biomed. Opt. 5, 5–16 (2000). 10.1117/1.429962 [DOI] [PubMed] [Google Scholar]
- 7.Chou C., Han C., Kuo W., Huang Y., Feng C., Shyu J., “Noninvasive glucose monitoring in vivo with an optical heterodyne polarimeter,” Appl. Opt. 37, 3553–3557 (1998). 10.1364/AO.37.003553 [DOI] [PubMed] [Google Scholar]
- 8.Malik B. H., “Real-time, closed-loop dual-wavelength optical polarimetry for glucose monitoring,” J. Biomed. Opt. 15, 017002 (2010). 10.1117/1.3290819 [DOI] [PMC free article] [PubMed] [Google Scholar]
- 9.Enejder A. M. K., Scecina T. G., Oh J., Hunter M., Shih W., Sasic S., Horowitz G. L., Feld M. S., “Raman spectroscopy for noninvasive glucose measurements,” J. Biomed. Opt. 10, 031114 (2005). 10.1117/1.1920212 [DOI] [PubMed] [Google Scholar]
- 10.Lambert J. L., Pelletier C. C., Borchert M., “Glucose determination in human aqueous humor with Raman spectroscopy,” J. Biomed. Opt. 10, 031110 (2005). 10.1117/1.1914843 [DOI] [PubMed] [Google Scholar]
- 11.Marbach R., Koschinsky T., Gries F. A., Heise H. M., “Noninvasive blood glucose assay by near-infrared diffuse reflectance spectroscopy of the human inner lip,” Appl. Spectrosc. 47, 875–881 (1993). 10.1366/0003702934415354 [DOI] [Google Scholar]
- 12.Maruo K., Tsurugi M., Tamura M., Ozaki Y., “In vivo noninvasive measurement of blood glucose by near-infrared diffuse-reflectance spectroscopy,” Appl. Spectrosc. 57, 1236–1244 (2003). 10.1366/000370203769699090 [DOI] [PubMed] [Google Scholar]
- 13.Vrancic C., Fomichova A., Gretz N., Herrmann C., Neudecker S., Pucci A., Petrich W., “Continuous glucose monitoring by means of mid-infrared transmission laser spectroscopy in vitro,” Analyst 136, 1192–1198 (2011). 10.1039/c0an00537a [DOI] [PubMed] [Google Scholar]
- 14.Gabriely I., Wozniak R., Mevorach M., Kaplan J., Aharon Y., Shamoon H., “Transcutaneous glucose measurement using near-infrared spectroscopy during hypoglycemia,” Diabetes Care 22, 2026–2032 (1999). 10.2337/diacare.22.12.2026 [DOI] [PubMed] [Google Scholar]
- 15.Spanner G., Niessner R., “New concept for the non-invasive determination of physiological glucose concentrations using modulated laser diodes.” Fresenius J. Anal. Chem. 355, 327–328 (1996). [DOI] [PubMed] [Google Scholar]
- 16.Malchoff C. D., Shoukri K., Landau J. I., Buchert J. M., “A novel noninvasive blood glucose monitor,” Diabetes Care 25, 2268–2275 (2002). 10.2337/diacare.25.12.2268 [DOI] [PubMed] [Google Scholar]
- 17.Guo X., Mandelis A., Matvienko A., Sivagurunathan K., Zinman B., “Wavelength-modulated differential laser photothermal radiometry for blood glucose measurements,” J. Phys. Conf. Ser. 214, 012025 (2010). 10.1088/1742-6596/214/1/012025 [DOI] [Google Scholar]
- 18.Ballerstadt R., Evans C., Gowda A., McNichols R., “In vivo performance evaluation of a transdermal near-infrared fluorescence resonance energy transfer affinity sensor for continuous glucose monitoring,” Diabetes Technol. Ther. 8, 296–311 (2006). 10.1089/dia.2006.8.296 [DOI] [PubMed] [Google Scholar]
- 19.March W., Lazzaro D., Rastogi S., “Fluorescent measurement in the non-invasice contact lens glucose sensor,” Diabetes Technol. Ther. 8, 312–317 (2006). 10.1089/dia.2006.8.312 [DOI] [PubMed] [Google Scholar]
- 20.Kottmann J., Rey J. M., Sigrist M. W., “New photoacoustic cell design for studying aqueous solutions and gels,” Rev. Sci. Instrum. 82, 084903 (2011). 10.1063/1.3622154 [DOI] [PubMed] [Google Scholar]
- 21.Spanner G., Niessner R., “Noninvasive determination of blood constituents using an array of modulated laser diodes and a photoacoustic sensor head.” Fresenius J. Anal. Chem. 354, 306–310 (1996). [DOI] [PubMed] [Google Scholar]
- 22.Zhao Z., “Pulsed photoacoustic techniques and glucose determination in human blood and tissue,” Ph.D. thesis (University of Oulu, 2002).
- 23.Hazen K. H., Arnold M. A., Small G. W., “Measurement of glucose in water first-overtone near-infrared spectra,” Appl. Spectrosc. 52, 1597–1605 (1998). 10.1366/0003702981943103 [DOI] [Google Scholar]
- 24.Olesberg J. T., Arnold M. A., Mermelstein C., Schmitz J., “Tunable laser diode system for noninvasive blood glucose measutements.” Appl. Spectrosc. 59, 1480–1484 (2005). 10.1366/000370205775142485 [DOI] [PubMed] [Google Scholar]
- 25.Burmeister J. J., Arnold M. A., “Evaluation of measurement sites for noninvasive blood glucose sensing with near-infrared transmission spectroscopy,” Clin. Chem. 45, 1621–1627 (1999). [PubMed] [Google Scholar]
- 26.Duncan A., Hannigan J., Freeborn S. S., MacKenzie H. A., “A portable non-invasive blood glucose monitor,” in The 8th International Conference on Solid-State Sensors and Actuators, 1995 and Eurosensors IX. Transducers ’95 (1995), pp. 455–458 10.1109/SENSOR.1995.721845 [DOI] [Google Scholar]
- 27.Ashton H., MacKenzie H. A., Rae P., Shen Y. C., Spiers S., Lindberg J., “Blood glucose measurements by photoacoustics,” in Proceedings of the 10th International Conference on Photoacoustic and Photothermal Phenomena, Vol. 463 of AIP Conference Proceedings (AIP, 1999), pp. 570–572257955916794109
- 28.MacKenzie H. A., Ashton H., Spiers S., Shen Y., “Advances in photoacoustic noninvasive glucose testing,” Clin. Chem. 45, 1587–1595 (1999). [PubMed] [Google Scholar]
- 29.Quan K. M., Christison G. B., MacKenzie H. A., Hodgson P., “Glucose determinaton by a pulsed photoa-coustic techinque: an experimental study using a gelatin-based tissue phantom.” Phys. Med. Biol. 38, 1911–1922 (1993). 10.1088/0031-9155/38/12/014 [DOI] [PubMed] [Google Scholar]
- 30.Downing H. D., Williams D., “Optical constants of water in the infrared,” J. Geophys. Res. 80, 1656–1661 (1975). 10.1029/JC080i012p01656 [DOI] [Google Scholar]
- 31.Duck F. A.Physical Properties of Tissue (Academic, London, 1990). [Google Scholar]
- 32.Gebhart S., Faupel M., Fowler R., Kapsner C., Lincoln D., McGee V., Pasqua J., Steed L., Wangsness M., Xu F., Vanstory M., “Glucose sensing in transdermal body fluid collected under continuous vacuum pressure via micropores in the stratum corneum,” Diabetes Technol. Ther. 5, 159–166 (2003). 10.1089/152091503321827812 [DOI] [PubMed] [Google Scholar]
- 33.Venugopal M., Feuvrel K. E., Mongin D., et al. , “Clinical evaluation of a novel interstitial fluid sensor system for remote continuous alcohol monitoring.” IEEE Sensors J. 8, 71–80 (2008). 10.1109/JSEN.2007.912544 [DOI] [Google Scholar]
- 34.Huang Y., Fang J., Wu P., Chen T., Tsai M., Tsai Y., “Noninvasive glucose monitoring by back diffusion via skin: chemical and physical enhancements,” Biol. Pharm. Bull. 26, 983–987 (2003). 10.1248/bpb.26.983 [DOI] [PubMed] [Google Scholar]
- 35.Groenendaal W., Schmidt K. A., von Basum G., van Riel N. A. W., Hilbers P. A. J., “Modeling glucose and water dynamics in human skin,” Diabetes Technol. Ther. 10, 283–293 (2008). 10.1089/dia.2007.0290 [DOI] [PubMed] [Google Scholar]
- 36.Garidel P., “Mid-FTIR-microspectroscopy of stratum corneum single cells and stratum corneum tissue,” Phys. Chem. Chem. Phys. 4, 5671–5677 (2002). 10.1039/b207478h [DOI] [Google Scholar]
- 37.Madison K. C., “Barrier function of the skin: ”La raison d’être” of the epidermis,” J. Invest. Dermatol. 121, 231–241 (2003). 10.1046/j.1523-1747.2003.12359.x [DOI] [PubMed] [Google Scholar]
- 38.Vonach R., “Application of mid-infrared transmission spectrometry to the direct determination of glucose in whole blood,” Appl. Spectrosc. 52, 820–822 (1998). 10.1366/0003702981944553 [DOI] [Google Scholar]
- 39.Brandstetter M., Genner A., Anic K., Lendl B., “Tunable external cavity quantum cascade laser for simultaneous determination of glucose and lactate in aqueous phase,” Analyst 135, 3260–3265 (2010). 10.1039/c0an00532k [DOI] [PubMed] [Google Scholar]
- 40.Christison G. B., MacKenzie H. A., “Laser photoacoustic determination of physiological glucose concentrations in human whole blood,” Med. Biol. Eng. Comput. 31, 284–290 (1993). 10.1007/BF02458048 [DOI] [PubMed] [Google Scholar]
- 41.von Lilienfeld-Toal H., Weidenmüller M., Xhelaj A., Mäntele W., “A novel approch to non-invasive glucose measurement by mid-infrared spectroscopy: The combination of quantum cascade lasers (QCL) and photoacoustic detection,” Vib. Spectrosc. 38, 209–215 (2005). 10.1016/j.vibspec.2005.02.025 [DOI] [Google Scholar]
- 42.Pleitez M., von Lilienfeld-Toal H., Mäntele W., “Infrared spectroscopic analysis of human interstitial fluid in vitro and in vivo using FT-IR spectroscopy and pulsed quantum cascade lasers (QCL): Establishing a new approach to non invasive glucose measurement,” Spectrochim. Acta A 85, 61–65 (2012). 10.1016/j.saa.2011.09.007 [DOI] [PubMed] [Google Scholar]
- 43.Rosencwaig A., Gersho A., “Theory of photoacoustic effect with solids,” J. Appl. Phys. 47, 64–69 (1976). 10.1063/1.322296 [DOI] [Google Scholar]
- 44.Tam A. C., “Applications of photoacoustic sensing techniques,” Rev. Mod. Phys. 58, 381–431 (1986). 10.1103/RevModPhys.58.381 [DOI] [Google Scholar]
- 45.Kottmann J., Rey J. M., Sigrist M. W., “New photoacoustic cell with diamond window for mid-infrared investigations on biological samples,” Proc. SPIE 8223, 8223–44 (2012). [Google Scholar]
- 46.Günzler H., Gremlich H. U., IR-Spektroskopie (Wiley-VCH, 2003). [Google Scholar]
- 47.Barry R. W., Edwards H. G. M., Williams A. C., “Fourier transform Raman and infrared vibrational study of human skin: Assignment of spectral bands,” J. Raman Spectrosc. 23, 641–645 (1992). 10.1002/jrs.1250231113 [DOI] [Google Scholar]
- 48.Lucassen G. W., van Veen G. N. A., Jansen J. A. J., “Band analysis of hydrated human skin stratum corneum attenuated total reflectance fourier transform infrared spectra in vivo,” J. Biomed. Opt. 3, 267–280 (1998). 10.1117/1.429890 [DOI] [PubMed] [Google Scholar]
- 49.Potts R. O., Guzek B. G., Harris R. R., McKie J. E., “A noninvasive, in vivo technique to quantitatively measure water concentration of the stratum corneum using attenuated total-reflectance Infrared spectroscopy,” Arch. Dermatol. Res. 277, 489–495 (1985). 10.1007/BF00510068 [DOI] [PubMed] [Google Scholar]
- 50.Gloor M., Hirsch G., Willebrand U., “On the use of infrared spectroscopy for the in vivo measurement of the water content of the horny layer after application of dermatologic Ointments,” Arch. Dermatol. Res. 271, 305–313 (1981). 10.1007/BF00409459 [DOI] [PubMed] [Google Scholar]


