Abstract
In spectral-domain optical coherence tomography (SD-OCT), data samples are collected nonuniformly in the wavenumber domain, requiring a measurement re-sampling process before a conventional fast Fourier transform can be applied to reconstruct an image. This re-sampling necessitates extra computation and often introduces errors in the data. Instead, we develop an inverse imaging approach to reconstruct an SD-OCT image. We make use of total variation (TV) as a constraint to preserve the image edges, and estimate the two-dimensional cross-section of a sample directly from the SD-OCT measurements rather than processing for each A-line. Experimental results indicate that compared with the conventional method, our technique gives a smaller noise residual. The potential of using the TV constraint to suppress sensitivity falloff in SD-OCT is also demonstrated with experiment data.
OCIS codes: (110.4500) Optical coherence tomography, (110.1758) Computational imaging, (100.3190) Inverse problems, (100.3020) Image reconstruction-restoration
1. Introduction
Compared with other biomedical imaging technologies, optical coherence tomography (OCT) has the advantages of a relatively high resolution but a relatively low set-up cost, making it a very successful imaging modality to migrate from research to industry products [1, 2, 3]. To date, OCT technology has been through three generations: time-domain OCT (TD-OCT), spectral-domain OCT (SD-OCT), and swept-source OCT (SS-OCT) [4, 5]. Resolution of an OCT system has been improved from 10 ∼ 20μm to several μm. Data acquisition speed has also increased from 2 A-lines per second in 1991 to 480,000 A-lines per second in 2011 [6]. The applications of OCT also extend from ophthalmology to other areas such as endoscopy, coronary atherosclerosis, dermatology, dental, pulmonary medicine, gynecology, and urology [2,7]. Among the three kinds of OCT systems, SD-OCT and SS-OCT have the advantage of a higher signal-to-noise ratio (SNR) and a higher sensitivity at a large depth position compared to TD-OCT [8, 9].
In an SD-OCT system, the measurements are collected uniformly in wavelength λ. This is because the measurement device, a spectrometer, operates by tuning to different wavelengths. On the other hand, in reconstructing the image, we use a Fourier transform of the measurement with respect to the wavenumber k, where k = 2π/λ. Therefore, the measurements are in fact nonuniform samples in k-space [10]. Customarily, the SD-OCT measurements undergo a resampling process to generate a uniformly-spaced data in k-space, where the resampling is achieved through linear, or cubic, interpolations [10, 11]. However, these methods need to face various challenges, such as improving system sensitivity falloff along the depth direction, increasing system local SNR, or suppressing sidelobe artifacts [12, 13].
An alternative to the re-sampling process is recently developed, which makes use of the non-uniform discrete Fourier transform (NUDFT) for SD-OCT signal reconstruction [12, 13, 14]. NUDFT is a modified version of the discrete Fourier transform, aiming to compute DFT directly on those signal points that are not uniformly sampled [15, 16]. It has been shown that with NUDFT, the reconstructed signal in SD-OCT presents less sensitivity falloff at the deeper position [13]. However, this gain comes at the expense of a slower computation speed. Fast versions of NUDFT are developed with GPU programming [12], but they tend to sacrifice some reconstruction quality. Other approaches to deal with the nonuniformly sampling issue include the development of a more sophisticated linear-in-wavenumber (linear-k) spectrometer [17] for measurement collection.
In this paper, we present a purely computational alternative by using inverse imaging [18]. We model the SD-OCT system with a set of linear equations, and by solving an inverse problem we can also directly reconstruct a cross-section of the sample instead of estimating each Aline independently. Because of the ill-posedness of the inverse problem, we need to impose a regularization term in the optimization function. In this work, we use the total variation (TV) norm in the regularization [19, 20, 21], which is known to enhance the edges in the images and reduce the background noise [22, 23].
The paper is organized as follows. In Section 2, we develop the model of the SD-OCT system. Then, in Section 3, we discuss the TV method used for signal reconstruction. In Section 4, experimental results are presented to demonstrate the feasibility and advantages of our technique. Concluding remarks are then given in Section 5.
2. SD-OCT system modeling
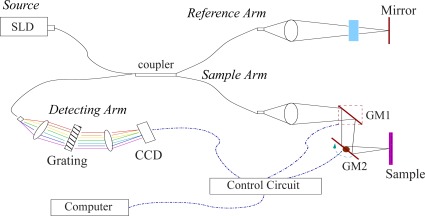
Fig. 1 shows an SD-OCT system. A low coherence Superluminescent Diode (SLD) is used as an illumination source. Most of the source light is split equally through the coupler into a reference arm and a sample arm. Then, the reflected beams from a reference mirror and the beams reflected from the sample are coupled again into a detecting arm for signal detection. In the detecting arm, a spectrometer consisting of a grating and a line-scan CCD is used for collecting measurements. During a detector exposure, each pixel of the CCD collects a measurement corresponding to one source wavelength. With all pixels of the CCD, the data for one A-line along a sample’s axial direction are collected. To obtain all A-line data of a sample, two galvano mirrors, labeled GM1 and GM2, are used to scan through the sample’s transversal plane.
Fig. 1.
The SD-OCT system diagram.
Let Ĩ(k) be the system measurement as a function of the wavenumber k, and G(k) the source power spectrum. The SD-OCT system measurements for one A-line is [10]
| (1) |
where pr is the reflective ratio of the reference mirror (normally we take pr = 1), ps(z) is the reflective ratio of the sample varying with depth value z, as is the sample refractive index (also assumed to be unity), and . Eq. (1) consists of three terms. The first term corresponds to the reflected light from the reference mirror, the second term records the interference between the reflected lights from the mirror and the sample, while the third term is the cross-interference between the reflected lights from different sample layers. Of the three, the second term is the most important, and from it we aim to reconstruct the sample signal ps(z).
Conventionally, the signal ps(z) is further assumed to be symmetric with respect to z = 0, and therefore it can be estimated from measurements Ĩ(k) using the fast Fourier transform (FFT) [13]. On the other hand, we note that if the source spectrum G(k) can be estimated independently, we can substract (since pr = 1) from Eq. (1) and represent the last term as an error e(k), which is usually small compared with the other two terms. Thus, the SD-OCT measurement is simplified to
| (2) |
In the discrete domain, this measurement can be written as
| (3) |
where we have discretized to N sections in the axial direction, and m ∈ {0,1,...,M – 1} denotes the mth pixel of the line-scan CCD camera. The value of N is not required to be the same as M, which is different from the FFT or NUDFT methods. However, the largest N should be limited by the largest detectable depth, which is determined by the spectrometer’s spectral resolution. Writing Eq. (3) into a matrix formulation, we have
| (4) |
where Hm,n = 2G(km) cos (2kmzn).
To write the above compactly, we use y = [I(k0) I(k1) ... I(kM−1)]T, x = [ps(z0) ps(z1) ... ps(zN−1)]T, and e = [e(k0) e(k1) ··· e(kM−1)]T to represent the SD-OCT measurement vector, one A-line sample signal, and the detection error vector, respectively. Matrix H is defined as the SD-OCT system impulse response matrix with Hm,n in the (m,n)th position. Using these notations, we can write the measurement process as y = Hx + e. This formulation represents the basic idea for the FFT and NUDFT methods as well. Furthermore, the SD-OCT measurements for L number of A-lines can be represented as
| (5) |
where matrices Y and E are of size M × L, and X is of size N × L. Each column of these quantities represents the measurement for one A-line.
3. Signal reconstruction using TV regularization
From Eq. (5), our task is to reconstruct X given the observation Y and the system H. This is an inverse problem. We solve it by minimizing the Frobenius norm [24] (which is equivalent to the ℓ2 norm for a vector) for signal fidelity together with a total variation regularization, i.e.
| (6) |
where α > 0 is a penalty parameter, and ||X||TV is the total variation of X defined as
| (7) |
with (∇nX)n,l = Xn+1,l − Xn,l if n < N − 1 and is zero when n = N − 1, and (∇l X)n,l = Xn,l+1 − Xn,l if l < L − 1 and is zero when l = L − 1.
Several approaches exist to solve this minimization problem. In our work, we make use of the augmented Lagrangian technique, which has shown to be a fast converging TV method [25], and with results comparable to other TV minimization techniques [26]. We incorporate an additional intermediate matrix U such that we solve for
| (8) |
where α1 > 0 and α2 > 0 are two predefined positive penalty parameters. We then use an alternating minimization algorithm where each iteration consists of the following two steps: (using the superscript (i) to denote the ith step)
| (9) |
Conjugate gradient (CG) and Chambolle’s projection algorithms are used to search for X(i) and U(i), respectively. Details about these two algorithms can be found in [26, 27, 28, 29]. Note that the usage of the matrix U does not change the minimization problem in Eq. (6), but is there to improve the convergence. In addition, we use the difference between X(i) and U(i) as a stop criteria for the iterative algorithm. The parameters α1 and α2 are used to balance the measurement error and the TV regularization penalty in Eq. (8). Large α1 and α2 values are for the case of a high measurement error. However, if they are set at very big values, the images will be significantly smoothed in the reconstruction process.
4. Experimental results
Our SD-OCT system is equipped with a SLD source with the center wavelength of 850 nm, a bandwidth of 50 nm, and a Gaussian-shaped power spectrum. In air, the system has a depth resolution of 6.38μm, and a maximum detectable depth of 2.42 mm. The mirror in the reference arm is silver-coated with a two-inch diameter. System measurements are collected using a customized spectrometer consisting of a one-inch volume-phase holographic (VPH) grating and a line-scan camera. As depicted in Fig. 1, the camera and the galvano mirrors are controlled by a computer.
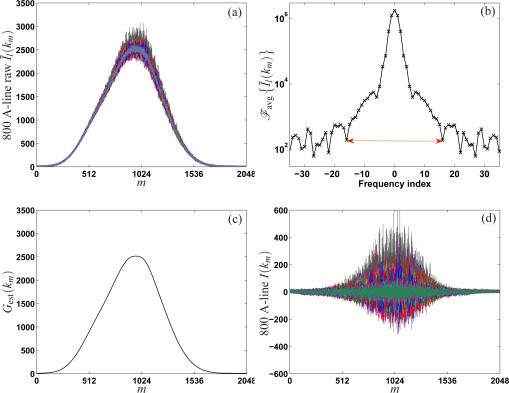
In the first experiment, 800 A-lines with 2048 samples per A-line are collected for a cross-sectional image of a metal plate sample. This metal plate represents defective industry elements with air cavities inside. Fig. 2(a) presents these raw measurements. To reconstruct the sample signal, first we need to estimate the source power spectrum G(km) from the raw data. We note that the raw measurements, denoted Ĩl(km), resemble a Gaussian-shaped low-frequency signal modulated by high-frequency components. The former originates from the SLD source power spectrum G(km), while the high-frequency components are the interference signals represented by the second and third terms in Eq. (1), together with detector noise. These can be suppressed by a lowpass filter when our objective is to estimate G(km).
Fig. 2.
(a) Raw measurements Ĩl (km), where each A-line is represented by a different color. (b) The averaged Fourier transform of Ĩl(km). (c) The estimated source power spectrum. (d) I(km) after adjustment.
To reduce the detector noise, we first average the 800 A-lines we acquired. Because the Fourier transform of a Gaussian function is also Gaussian, the cut-off frequencies of the low-pass filter are chosen as the first pair of zero points in the averaged transform result. We then obtain the estimated source power spectrum, Gest(km), from the inverse Fourier transform of the filtered signal. Fig. 2(b) and (c) present the averaged transformation and the spectrum estimation, respectively. Subtracting the latter from the system raw measurements, we have the 800 “adjusted” A-line measurements I(km) as plotted in Fig. 2(d). For each A-line, I(km) can now be deemed a linear combination of ps(zn) using Eq. (3).
Next, we note that I(km) also has an envelope of a Gaussian function due to G(km). However, the envelope is not symmetric with respect to zero, which seems to contradict the symmetry of the cosine function in H of Eq. (5). In fact, this is caused by several factors. Chief among them is the interference between different sample layers ps(zn), represented by the third term of Eq. (1). We can re-write this term as
| (10) |
where the values of ps(z) are real. This nonnegative term shifts the measurement envelope towards the positive side with respect to zero. Other factors causing the asymmetric envelope include the detector noise, quantization error in data acquisition, and detector nonlinear responsivity. All of these limit the reconstruction performance of the TV regularization.
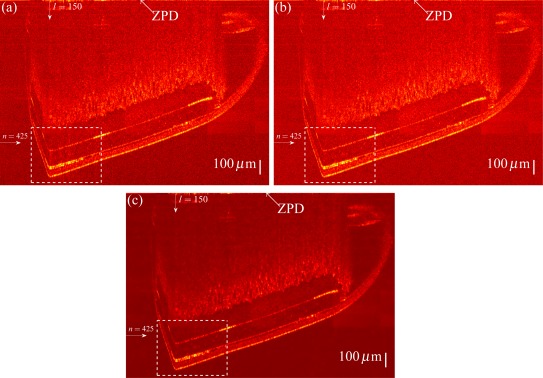
At this point, we compare three different methods to reconstruct the sample signal. The first is the conventional FFT method where the measurements for each A-line are resampled before the transformation. The second uses the NUDFT, where the reconstructed signal for one A-line is obtained by multiplying the measurement vector y with a matrix Ĥ, with elements Ĥm,n = exp (−jkmzn) [12, 13, 14]. The third uses the TV regularization detailed in the previous section. We choose α1 = 20 and α2 = 100. Totally 80 iterations are used for the algorithm defined in Eq. (9). The cross-sectional sample reconstructions using these three methods are presented in Fig. 3. The horizontal and vertical directions are the A-line (l) and the index of the depth (n), respectively.
Fig. 3.
Reconstruction using (a) the FFT, (b) the NUDFT, and (c) the TV regularization.
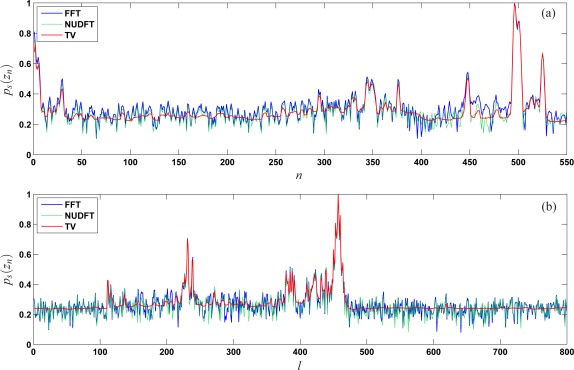
When we compare the NUDFT with the FFT, the former improves the reconstruction quality, especially in the large depth area marked by the white dash lines. However, with TV regularization, the reconstructed image preserves the sample signal and presents much less noise residue, delivering a better SNR than the other two existing methods. Note that SNR here refers to the difference between the desired sample signal ps(z) and any remaining error in the reconstruction. Because or the signal from the reference mirror has been subtracted from the system raw measurement Ĩ(km), this SNR is different from the value obtained by comparing the reconstruction using a mirror sample and the signal by simply detecting the reflection from the reference arm [9]. To have a better visualization of these results, we plot the signals for the A-line at l = 150 in Fig. 4(a), and at the depth position n = 425 in (b). The smoothness of the results corresponding to the TV regularization suggests that it minimizes fluctuations in the signal.
Fig. 4.
One line of the reconstructed signals using FFT, NUDFT, and TV along (a) the axial direction and (b) the transversal directions.
Furthermore, the TV method discussed in this paper focuses on improving OCT system reconstruction performance. The gain demonstrated here comes at the expense of computation speed. In our Matlab code for the FFT, NUDFT, and TV methods, the computation time using the TV method to reconstruct an image consisting of 1000 A-lines with 2048 measurements per A-line is slightly shorter than 35 minutes. For the same image, it takes about half a minute using either the FFT or NUDFT method. We observe roughly the same order of computation time in the following experiments.
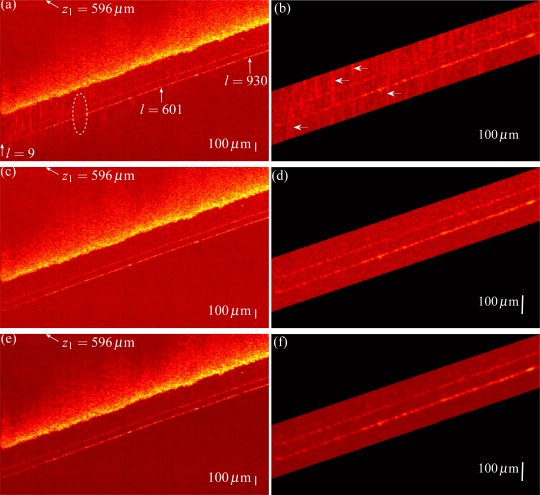
In a second experiment, we investigate the effect of the TV regularization to an important SD-OCT system property, namely, sensitivity falloff. We obtain the data for a cross-section of a silver plate and reconstruct using the three methods discussed above. We capture 1000 A-line, each with 2048 measurements. The parameters α1 and α2 for the TV regularization are still α1 = 20 and α2 = 100. We use 100 iterations to obtain the reconstruction result. Fig. 5 presents the reconstructed signals and their zoomed-in views.
Fig. 5.
Reconstructions using (a) the FFT, (c) the NUDFT, and (e) the TV regularization. Zoomed-in views of the reconstructions using (b) the FFT, (d) the NUDFT, and (f) the TV regularization.
A general trend in Fig. 5 is that as the depth value zn increases, as evident from the slanted lines approaching the left, errors such as the vertical line segment indicated by the arrows in Fig. 5(b) appear in the reconstruction. This is because the wavenumber k is inversely proportional to the wavelength λ, and therefore a uniformly-spaced λ corresponds to fewer measurements in the region where k is large. As a result, more reconstruction error exists in a larger depth. The situation is considerably better with NUDFT and TV. If we compare Fig. 5(c) with (e), we see that the reconstruction using the TV regularization presents much less noise residue than using NUDFT, consistent with the earlier experiment.
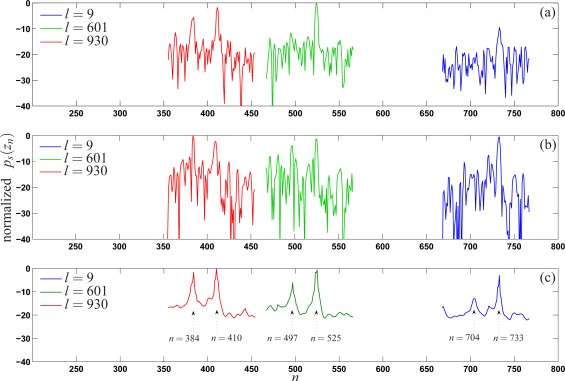
Now to study sensitivity falloff, we make use of Fig. 5(b), (d), and (f), and pick 3 A-lines where the two slanted lines appear in various depths. The lines we selected are at l = 9 (for deep in the sample), l = 601 (intermediate), and l = 930 (shallow). Notice that in these images, we masked out the places far from the two slanted lines. For example, for l = 9, we only selected n from about 660 to 760; for l = 601, roughly for 460 < n < 560; and for l = 930, around 350 < n < 450. The 3 A-lines for the different methods are presented in Fig. 6. As shown in (c) for the TV regularization, two peaks corresponding to the two layers in the sample can be observed clearly in the reconstruction, whether for deep, intermediate, or shallow regions. In contrast, for FFT and NUDFT, the two peaks corresponding to the intermediate and deep regions are difficult to be identified. We locate the value of n for each peak in Fig. 6(c). Then ps(zn) at these locations using the three methods are summarized in Table 1. Note that, n = 384, 497, and 704 are for the first sample layer, while the other three are for the second layer. As expected, generally ps(zn) becomes smaller as n increases or the depth is enlarged. For example, for the first layer, as n increases from 384 to 704, the normalized ps(zn) decreases from −5.60 dB to −21.68 dB in the FFT method, from 0 dB to −16.23 dB in the NUDFT method, and from −1.68 dB to −12.91 dB in the TV method. However, the difference between the minimum and maximum ps(zn) varies with the three schemes. The smallest is the 12.91 dB in the TV method, which is 3.32 dB smaller than that for NUDFT (16.23 dB) and 7.71 dB smaller than that for FFT (20.62 dB).
Fig. 6.
Zoom-in reconstructed signals at l = 9, 601, and 930 using (a) the FFT, (b) the NUDFT, (c) the TV regularization.
Table 1.
Normalized peak values (dB) of the reconstructed signal in Fig. 6.
| FFT | NUDFT | TV | ||
|---|---|---|---|---|
| l = 930 | n = 384 | −5.60 | 0 | −1.68 |
| n = 410 | −3.54 | −2.33 | 0 | |
| l = 601 | n = 497 | −14.59 | −3.87 | −6.12 |
| n = 525 | −1.06 | −1.37 | −0.60 | |
| l = 9 | n = 704 | −21.68 | −16.23 | −12.91 |
| n = 733 | −9.50 | −0.52 | −3.05 | |
| min – max (dB) | −20.62 | −16.23 | −12.91 | |
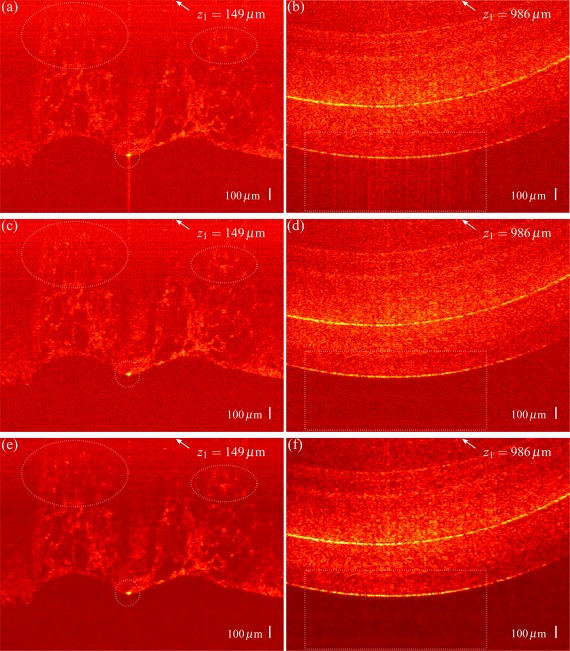
In Fig. 7, we present the reconstruction results obtained using the three methods for an orange flesh and a pearl sample. The former is located at a small depth position, while the pearl sample has a large depth. We still use 100 iterations in the TV method. The parameters used in the method are α1 = 20 and α2 = 100. Comparing the three reconstructions for the orange flesh sample, the TV regularization shows the best reconstruction quality. In the reconstruction using the FFT method for the pearl sample, once again we observe the artifact at a large depth region, which does not exist in the other two reconstruction schemes. For the pearl sample we also observe speckle noise. This is suppressed with TV regularization, because TV acts as a prior to enhance the edges and reduce random noise.
Fig. 7.
Reconstructions for an orange flesh and a pearl using (a–b) the FFT, (c–d) the NUDFT, and (e–f) the TV regularization.
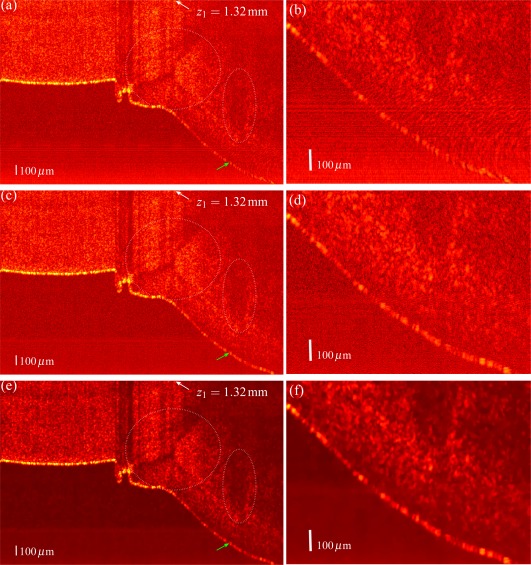
In the last experiment, we use a fingernail sample to test the three methods. Reconstruction results are presented in Fig. 8. Once again, we observe the TV method improves the reconstruction quality, especially in the large depth area pointed by the green arrow. With all of these studies, we can therefore conclude that TV regularization has less falloff, and shows better edge performance. It is a purely computational approach to improve the SD-OCT system performance. It has the advantage of a lower cost because there is no need for additional hardware.
Fig. 8.
Reconstructions for a fingernail sample using (a–b) the FFT, (c–d) the NUDFT, and (e–f) the TV regularization.
5. Conclusions
In this work, we use a linear system of equations to model the SD-OCT measurements, and reconstruct the image from nonuniformly sampled signal via solving an inverse imaging problem. With a TV constraint as the regularization, we show that this method provides a better noise suppression and delivers a better contrast compared to the conventional FFT-based and NUDFT-based methods. Furthermore, we can reduce the system’s sensitivity falloff using the TV regularization. In addition, by modifying the model parameters, the inverse imaging method can also be used for other OCT systems besides SD-OCT.
Acknowledgments
This work was supported in part by the University Research Committee of the University of Hong Kong under Project 10208648. The help of Mr. Ray Zhu in providing the biological samples is gratefully acknowledged.
References and links
- 1.Huang D., Swanson E. A., Lin C. P., Schuman J. S., Stinson W. G., Chang W., Hee M. R., Flotte T., Gregory K., Puliafito C. A., Fujimoto J. G., “Optical coherence tomography,” Science 254, 1178–1181 (1991). 10.1126/science.1957169 [DOI] [PMC free article] [PubMed] [Google Scholar]
- 2.Drexler W., Fujimoto J. G., Optical Coherence Tomography Technology and Applications (Springer-Verlag, Berlin, 2008). 10.1007/978-3-540-77550-8 [DOI] [Google Scholar]
- 3.Wojtkowski M., “High-speed optical coherence tomography: basics and applications,” Appl. Opt. 49, D3–D60 (2010). 10.1364/AO.49.000D30 [DOI] [PubMed] [Google Scholar]
- 4.Popescu D. P., Choo-Smith L.-P., Flueraru C., Mao Y., Chang S., Disano J., Sherif S., Sowa M. G., “Optical coherence tomography: fundamental principles, instrumental designs and biomedical applications,” Biophys. Rev. 3, 155–169 (2011). 10.1007/s12551-011-0054-7 [DOI] [PMC free article] [PubMed] [Google Scholar]
- 5.Zhu R., Xu J., Zhang C., Chan A. C., Li Q., Chui P., Lam E. Y., Wong K. K., “Dual-band time-multiplexing swept-source OCT based on optical parametric amplification,” to be published in IEEE J. Sel. Top. Quantum Electron. [Google Scholar]
- 6.Tsai T.-H., Potsaid B., Kraus M. F., Zhou C., Tao Y. K., Hornegger J., Fujimoto J. G., “Piezoelectric-transducer-based miniature catheter for ultrahigh-speed endoscopic optical coherence tomography,” Opt. Express 2, 2438–2448 (2011). 10.1364/BOE.2.002438 [DOI] [PMC free article] [PubMed] [Google Scholar]
- 7.Cheng K. H. Y., Standish B. A., Yang V. X. D., Cheung K. K. Y., Gu X., Lam E. Y., Wong K. K. Y., “Wavelength-swept spectral and pulse shaping utilizing hybrid Fourier domain modelocking by fiber optical parametric and erbium-doped fiber amplifiers,” Opt. Express 18, 1909–1915 (2010). 10.1364/OE.18.001909 [DOI] [PubMed] [Google Scholar]
- 8.Leitgeb R. A., Hitzenberger C. K., Fercher A. F., “Performance of Fourier domain vs. time domain optical coherence tomography,” Opt. Express 11, 889–893 (2003). 10.1364/OE.11.000889 [DOI] [PubMed] [Google Scholar]
- 9.Yun S.-H., Tearney G. J., Bouma B. E., Park B. H., de Boer J. F., “High-speed spectral-domain optical coherence tomography at 1.3μm wavelength,” Opt. Express 11, 3598–3604 (2003). 10.1364/OE.11.003598 [DOI] [PMC free article] [PubMed] [Google Scholar]
- 10.Brezinski M., Optical Coherence Tomography: Principles and Applications (Elsevier, 2006). [Google Scholar]
- 11.Watanabe Y., Maeno S., Aoshima K., Hasegawa H., Koseki H., “Real-time processing for full-range Fourier-domain optical-coherence tomography with zero-filling interpolation using multiple graphic processing units,” Appl. Opt. 49, 4756–4762 (2010). 10.1364/AO.49.004756 [DOI] [PubMed] [Google Scholar]
- 12.Zhang K., Kang J. U., “Graphic processing unit accelerated non-uniform fast Fourier transform for ultrahigh-speed, real-time Fourier-domain OCT,” Opt. Express 18, 23472–23487 (2010). 10.1364/OE.18.023472 [DOI] [PMC free article] [PubMed] [Google Scholar]
- 13.Wang K., Ding Z., Wu T., Wang C., Meng J., Chen M., Xu L., “Development of a non-uniform discrete Fourier transform based high speed spectral domain optical coherence tomography system,” Opt. Express 17, 12121–12131 (2009). 10.1364/OE.17.012121 [DOI] [PubMed] [Google Scholar]
- 14.Chan H. K., Tang S., “High-speed spectral domain optical coherence tomography using non-uniform fast Fourier transform,” Biomed. Opt. Express 1, 1309–1319 (2010). 10.1364/BOE.1.001309 [DOI] [PMC free article] [PubMed] [Google Scholar]
- 15.Rudin L. I., Osher S., Fatemi E., “An accurate algorithm for nonuniform fast Fourier transforms (NUFFTs),” IEEE Microwave Guided Wave Lett. 8, 18–20 (1998). 10.1109/75.650975 [DOI] [Google Scholar]
- 16.Greengard L., Lee J.-Y., “Accelerating the nonuniform fast Fourier transform,” SIAM Rev. 46, 443–454 (2004). 10.1137/S003614450343200X [DOI] [Google Scholar]
- 17.Jeon M., Kim J., Jung U., Lee C., Jung W., Boppart S. A., “Full-range k-domain linearization in spectral-domain optical coherence tomography,” Appl. Opt. 50, 1158–1162 (2011). 10.1364/AO.50.001158 [DOI] [PMC free article] [PubMed] [Google Scholar]
- 18.Lam E. Y., Zhang X., Vo H., Poon T.-C., Indebetouw G., “Three-dimensional microscopy and sectional image reconstruction using optical scanning holography,” Appl. Opt. 48, H113–H119 (2009). 10.1364/AO.48.00H113 [DOI] [PubMed] [Google Scholar]
- 19.Rudin L. I., Osher S., Fatemi E., “Nonlinear total variation based noise removal algorithms,” Phys. D: Nonlinear Phenomena 60, 259–268 (1992). 10.1016/0167-2789(92)90242-F [DOI] [Google Scholar]
- 20.Ke J., Zhu R., Lam E. Y., “Image reconstruction from nonuniform samples in spectral domain optical coherence tomography,” in Signal Recovery and Synthesis, OSA Technical Digest (CD) (Optical Society of America, 2011), paper SMD2. [Google Scholar]
- 21.Ke J., Zhu R., Lam E. Y., “Image reconstruction from nonuniformly-spaced samples in Fourier domain optical coherence tomography,” Proc. SPIE 8296, 829610 (2012). 10.1117/12.907331 [DOI] [PMC free article] [PubMed] [Google Scholar]
- 22.Xu Z., Lam E. Y., “Image reconstruction using spectroscopic and hyperspectral information for compressive terahertz imaging,” J. Opt. Soc. Am. A 27, 1638–1646 (2010). 10.1364/JOSAA.27.001638 [DOI] [PubMed] [Google Scholar]
- 23.Zhang X., Lam E. Y., “Edge-preserving sectional image reconstruction in optical scanning holography,” J. Opt. Soc. Am. A 27, 1630–1637 (2010). 10.1364/JOSAA.27.001630 [DOI] [PubMed] [Google Scholar]
- 24.Golub G. H., Van Loan C. F., Matrix Computations (The Johns Hopkins University Press, 1996). [Google Scholar]
- 25.Boyd S., Parikh N., Chu E., Peleato B., Eckstein J., “Distributed optimization and statistical learning via the alternating direction method of multipliers,” Found. Trends Mach. Learning 3, 1–122 (2010). 10.1561/2200000016 [DOI] [Google Scholar]
- 26.Huang Y., Ng M. K., Wen Y., “A fast total variation minimization method for image restoration,” Multiscale Modeling & Simulat. 7, 774–795 (2008). 10.1137/070703533283787022411503 [DOI] [Google Scholar]
- 27.Zhang X., Lam E. Y., Poon T.-C., “Reconstruction of sectional images in holography using inverse imaging,” Opt. Express 16, 17215–17226 (2008). 10.1364/OE.16.017215 [DOI] [PubMed] [Google Scholar]
- 28.Chambolle A., “An algorithm for total variation minimization and applications,” J. Math. Imaging Vision 20, 89–97 (2004). 10.1023/B:JMIV.0000011321.19549.88 [DOI] [Google Scholar]
- 29.Ke J., Poon T.-C., Lam E. Y., “Depth resolution enhancement in optical scanning holography with a dual-wavelength laser source,” Appl. Opt. 50, H285–H296 (2011). 10.1364/AO.50.00H285 [DOI] [PubMed] [Google Scholar]


