

Abstract
Several genetic defects of the nucleotide excision repair (NER) pathway, including deficiency of the Excision Repair Cross-Complementing rodent repair deficiency, complementation group 1 (ERCC1), result in pre-mature aging, impaired growth, microcephaly and delayed development of the cerebellum. These phenotypes are recapitulated in Ercc1-knockout mice, which survive for up to 4 weeks after birth. Therefore, we analyzed cerebellar and hippocampal transcriptomes of these animals at 3 weeks of age to identify the candidate mechanisms underlying central nervous system abnormalities caused by inherited defects in NER. In the cerebellum, the most prominent change was the upregulation of genes associated with gliosis. Although Purkinje cell degeneration has been reported in some mouse strains with NER impairment, the transcripts whose downregulation is associated with Purkinje cell loss were mostly unaffected by the knockout of Ercc1. In the hippocampus, there was extensive downregulation of genes related to cholesterol biosynthesis. Reduced expression of these genes was also present in the neocortex of adult mice with reduced expression of ERCC1. These changes were accompanied by reduced mRNA expression of the transcription factor Sterol Regulatory Element Binding Transcription Factor-2 (SREBF2) which is a master regulator of cholesterol biosynthesis. The downregulation of forebrain cholesterol biosynthesis genes is a newly identified consequence of ERCC1 deficiency. Reduced cholesterol biosynthesis may contribute to the neurodevelopmental disruption that is associated with ERCC1 defects and several other NER deficiencies including Cockayne syndrome. In addition, this reduction may negatively affect the function of mature synapses.
Keywords: Neurodegeneration, DNA repair, DNA damage, Lipid metabolism, RNA microarrays
Background
In humans, genetic defects of the DNA repair machinery often result in neurological phenotypes (Niedernhofer, 2008). It has been proposed that the origin of these phenotypes may include disturbed neurodevelopment and/or defective removal of oxidative DNA lesions whose gradual accumulation becomes toxic to mature neurons (Brooks, 2008). Due to their postmitotic character, high transcriptional activity, and only limited replacement by adult neurogenesis, neurons are thought to be particularly vulnerable to DNA damage. DNA single- and double-strand break repair and nucleotide excision repair (NER) are all critical for normal development of the nervous system and preventing neurodegeneration (Fishel et al., 2007).
The NER machinery recognizes and removes helix-distorting DNA lesions, including ultraviolet radiation-induced pyrimidine dimers, chemical adducts and oxidative lesions. Two subpathways of NER exist: one that functions throughout the entire genome, termed global-genome NER (GG-NER), and the other that concentrates on DNA helix distortions that block RNA polymerases, termed transcription-coupled NER (TC-NER) (Hoeijmakers, 2001). The two pathways converge with the removal of the damaged strand of DNA as an oligonucleotide by two nucleases: XPG and the heterodimer ERCC1-XPF (Niedernhofer et al., 2004; Volker et al., 2001).
Deficiency in NER can lead to neurological phenotypes, including neurodegeneration (Niedernhofer, 2008). For instance, the deletion of murine Xpg results in Purkinje cell (PC) death (Sun et al., 2001). Conversely, reduced expression of murine or human ERCC1 is associated with cerebellar hypoplasia, microcephaly, dystonia and gliosis, but with no obvious neuronal loss in the cerebellum (Jaspers et al., 2007; Niedernhofer et al., 2006). Similar to ERCC1-deficient humans, Ercc1-null mice have a limited life span, surviving only four weeks after birth (Niedernhofer et al., 2006). Mice with partial ERCC1 deficiency due to inactivation of one Ercc1 allele and replacement of the other with a hypomorphic mutant (Ercc1−/Δ genotype) survive into adulthood while developing progressive degeneration of spinal cord motor neurons and gliosis throughout the CNS (de Waard et al., 2010). In the present study cerebellar and hippocampal transcriptome analyses were performed to define gene expression patterns that may underlie neurological decline in ERCC1-deficient mice.
Material and Methods
Mice
All animal experiments strictly followed the protocols that were approved by the Institutional Animal Care and Use Committee of the University of Louisville and the NIH guidelines. The Ercc1+/− heterozygotes were maintained on C57/Bl6 and FVB mouse inbred backgrounds and generation of the homozygous animals was conducted by crossing these two Ercc1+/− lines (Niedernhofer et al., 2006). The resulting outbred background (C57/Bl6 X FVB) allowed survival of Ercc1−/− mice for up to 4 weeks after birth. Genotyping was performed as reported previously (Niedernhofer et al., 2006). For all studies on the Ercc1−/− mice littermate wild type (wt) controls were used. The adult Ercc1 hypomorphic mutant mice (Ercc1−/Δ) were described previously (Dolle et al., 2006). Age-matched wt controls were used for comparisons. Following euthanasia, the brain regions were dissected and flash frozen on dry ice. RNA was isolated using the RNeasy kit (microarray experiments and qRT-PCR assays in P21 Ercc1−/− mice) (Qiagen, Valencia, Ca) or Tri Reagent (qRT-PCR assays in Ercc1−/Δ adult mice) (Sigma).
Materials
The following primary and secondary antibodies were obtained from commercial sources: anti-Calbindin (mouse monooclonal, Santa Cruz Biotechnology, #sc-58699, Santa Cruz CA, USA,), anti-GFAP (mouse monoclonal, Cell Signaling Technology, #3670, Danvers, MA, USA), anti-Iba1 (rabbit polyclonal, Wako Chemicals USA, Inc., #019-19741, Richmond, VA, USA), Alexa 488-, Alexa 594-conjugated secondary antibodies (Invitrogen).
Microarray
For microarray analysis RNA was used from three Ercc1-null (one male and two females) and three wt littermate animals (two males and one female). Single-stranded cDNA was generated from the amplified cRNA using the Whole Transcript Double-Stranded cDNA Synthesis Kit (Affymetrix). Samples were biotin labeled and hybridized following the Affymetrix standard protocol for their GeneChip® Expression 3′ Amplification One-Cycle Target Labeling kit (Part# 900493, Affymetrix, Santa Clara, CA). Samples were then hybridized to Affymetrix MOE 430_2.0 arrays. The arrays were scanned in a GeneChip® Scanner 3000 7G (Affymetrix, Santa Clara) according to the manufacturer’s instruction. The microarray data have been deposited to the NCBI Gene Expression Omnibus (GEO) and can be accessed directly by its designation, GSE31199.
Microarray data analysis
The dChip DNA-Chip analyzer software (Li and Wong, 2001) was downloaded from www.dchip.org. Default settings were used with the following exceptions: model-based model method and mismatch probe background subtraction options were employed; fold change of controls threshold was set to ±1.2; to compare the absolute differences between the groups the log ratio threshold was set to 50; a two-tailed t-test p-value of 0.05 with false discovery rate (FDR)-correction was used. The DAVID annotation software (david.abcc.ncifcrf.gov/) (Huang da et al., 2009b) was used to identify functional clusters among affected transcripts.
Quantitative Real Time PCR (qRT-PCR)
For qRT-PCR analysis, RNA was used from four Ercc1-null (one male and three females) and four wt littermate animals (two males and two females). Complimentary DNA (cDNA) was synthesized from a 2 μg aliquot of DNA-free RNA using Cloned AMV First-strand Synthesis (Invitrogen, Carlsbad, CA, USA) using random hexamer primers and Avian Myeloblastosis Virus reverse transcriptase (RTase). As controls, mixtures containing all components except RTase were prepared and treated similarly. All cDNAs were diluted 1:10 with water prior to use. qRT-PCR was conducted using the SYBR Green/Rox PCR Mastermix (SA Biosciences, Frederick, MD, USA) and the Applied Biosystems 7900HT cycler (Applied Biosystems, Forest City, CA, USA). mRNA levels were analyzed using the ΔΔct method (2−ΔΔct). Expression values obtained from triplicate determinations of each cDNA sample were calculated relative to the triplicate values for Gapdh from the same cDNA sample. Oligonucleotide primer sequences for each gene were designed by using Integrated DNA Technologies (Coralville, IA, USA) software; their sequences are presented in supplementary table 3.
Cresyl violet staining, immunohistochemistry and image capture
Deeply anaesthetized mice were perfused intracardially with cold 0.1M phosphate buffered saline (PBS) followed by 4% (w/v) paraformaldehyde in 0.1M PBS. Brains were removed and post fixed over night at 4°C. The following day they were placed in 30% (w/v) sucrose for up to 72 h. They were then frozen at −80°C until used. Twenty-five μm cryostat sections were cut saggitally. Cresyl violet staining or immunostainings for Calbindin and IBA1 were conducted using standard protocols. Briefly, after 1 h blocking in 3% BSA, 10% normal goat serum in PBS/0.1% Triton-X100, sections were incubated with primary antibodies (1:100 dilutions in blocking buffer, applied at 4°C over night), followed by Alexa 488- or 594-conjugated secondary antibodies (applied for 1 h at room temperature).
Results
Transcriptome response to ERCC1-deficiency is brain region-specific
To identify mechanisms of the neurological decline associated with ERCC1 deficiency, we used whole genome microarray analysis to compare cerebellar-, or hippocampal transcriptomes of Ercc1-null and wild type (wt) mice at postnatal day 21. We identified 367 or 278 probes corresponding to gene transcripts that were significantly affected by Ercc1 deletion in the cerebellum or the hippocampus, respectively (Supplemental Tables 1a and 1b). In the hippocampus, 126 probes detected transcript upregulation and 152 probes detected transcript downregulation (Fig. 1). Transcriptome changes in the cerebellum encompassed 267 and 100 probes revealing transcript upregulation and downregulation, respectively (Fig. 1). Only thirty-five affected transcripts overlapped between the two brain structures (Fig. 1, Supplemental Table 2). Functional analysis of the altered transcripts using The Database for Annotation, Visualization and Integrated Discovery (DAVID) (Huang da et al., 2009a, b) revealed no overlap of functional gene clusters enriched in the cerebellum or the hippocampus of Ercc1-null mice (Tables 1 and 2). Therefore, the transcriptome response to ERCC1 deficiency is brain region-specific.
Figure 1.
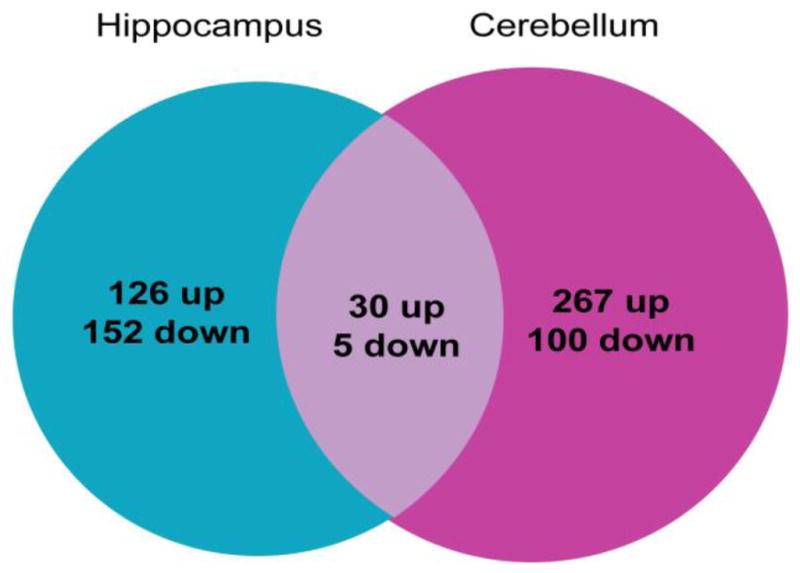
The number of whole mouse genome microarray probes detecting significantly up- or downregulated gene transcripts in the hippocampus and the cerebellum of Ercc1−/− mice at postnatal day 21 (P21). The transcriptome responses in these brain structures are mostly non-overlapping.
Table 1.
Functional annotation clusters among affected genes in the Ercc1-null cerebellum as identified by DAVID analysis.
| Name of the cluster | Number of upregulated genes | Number of downregulated genes | Median fold change of all affected probes1 | Enrichment score | p-value2 |
|---|---|---|---|---|---|
| Signal | 70 | 13 | 1.360 | 4.23 | 1.1 X 10⁻⁴ |
| Glycoprotein | 74 | 18 | 1.350 | 4.9 X 10⁻⁴ | |
| Signal peptide | 70 | 13 | 1.360 | 1.6 X 10⁻² | |
| Disulfide bond | 54 | 13 | 1.340 | 2.2 X 10⁻³ | |
| Secreted | 34 | 7 | 1.365 | 2.6 X 10⁻² | |
| Lysosome | 12 | 0 | 1.380 | 2.86 | 7.9 X 10⁻² |
| Lytic vacuole | 12 | 0 | 1.380 | 4.3 X 10⁻² | |
| Vacuole | 12 | 0 | 1.380 | 8.3 X 10⁻² | |
| Postsynaptic membrane | 4 | 5 | 0.040 | 2.01 | 1.1 X 10⁻¹ |
| Cell junction | 13 | 3 | 1.320 | 7.3 X 10⁻² |
of wt controls
family-wise false discovery rate-corrected Benjamini score for multiple p-values
Table 2.
Functional annotation clusters among affected genes in the Ercc1-null hippocampus as identified by DAVID analysis.
| Name of the cluster | Number of upregulated genes | Number of downregulated genes | Median fold change of all affected probes1 | Enrichment score | p-value2 |
|---|---|---|---|---|---|
| Sterol biosynthetic process | 0 | 8 | −1.435 | 4.73 | 9.8 X 10⁻⁵ |
| Cholesterol biosynthetic process | 0 | 7 | −1.430 | 2.1 X 10⁻⁴ | |
| Sterol biosynthesis | 0 | 7 | −1.440 | 1.0 X 10⁻⁴ | |
| Cholesterol biosynthesis | 0 | 6 | −1.450 | 2.9 X 10⁻⁴ | |
| Sterol metabolic process | 1 | 8 | −1.430 | 2.5 X 10⁻³ | |
| Steroid biosynthesis | 0 | 7 | −1.440 | 8.3 X 10⁻⁴ | |
| Cholesterol metabolic process | 1 | 7 | −1.450 | 9.4 X 10⁻³ | |
| Lipid synthesis | 0 | 9 | −1.430 | 2.1 X 10⁻³ | |
| Steroid biosynthetic process | 0 | 8 | −1.435 | 8.2 X 10⁻³ | |
| Steroid biosynthesis | 0 | 5 | −1.435 | 7.3 X 10⁻³ | |
| Steroid metabolic process | 2 | 8 | −1.435 | 4.5 X 10⁻² | |
| Oxidation reduction | 12 | 9 | 1.220 | 2.84 | 6.1 X 10⁻² |
| Oxidoreductase | 11 | 7 | 1.220 | 3.0 X 10⁻² | |
| Plasma membrane part | 15 | 22 | −1.240 | 2.65 | 2.0 X 10⁻³ |
| Cell adhesion | 5 | 8 | −1.240 | 8.2 X 10⁻² | |
| Oxidoreductase | 11 | 7 | 1.220 | 2.39 | 3.0 X 10⁻² |
| NADP | 4 | 3 | 0 | 1.5 X 10⁻¹ | |
| Lipoprotein | 5 | 14 | −1.270 | 2.27 | 1.8 X 10⁻² |
| Synaptogenesis | 1 | 3 | −1.320 | 1.76 | 1.4 X 10⁻¹ |
| Neurotransmitter secretion | 0 | 5 | −1.345 | 1.3 X 10⁻¹ |
of wt controls
family-wise false discovery rate-corrected Benjamini score for multiple p-values
Of note, the list of genes, which were affected by ERCC1 deficiency in both the hippocampus and the cerebellum, does not include Ercc1 itself. Its transcript was significantly downregulated only in the hippocampus (probe 1417328_at, −3.29, p<0.01). However, its expression in the cerebellum showed a downward trend (probe 1417328_at, −2.67, p<0.07). While similar relative levels of the Ercc1 transcript were detected in the hippocampus and the cerebellum of wt mice, the hippocampal samples showed more consistency (normalized mean signal intensity±SD in the wt hippocampus and the wt cerebellum was 196±24.3 and 169±54, respectively). Conversely, in Ercc1-null animals, similar relative downregulation of that transcript was detected (relative signal intensity in the hippocampus and the cerebellum was 60±9 and 63±7.3, respectively). A potential reason for the greater variability of Ercc1 mRNA levels in the wt cerebellum could be its lower absolute expression levels than those in the hippocampus. Indeed, in young adult mice, the hippocampus shows the highest expression of Ercc1 mRNA (Allen Brain Atlas).
Cerebellar gene expression patterns in ERCC1-deficient mice indicate the presence of reactive gliosis and maintenance of PCs
In the cerebellum, several enriched clusters were identified. The greatest enrichment scores were for three clusters including glycoproteins/secreted proteins, lysosomes/vacuoles and postsynaptic membranes/cell junctions (Table 1). Most of the affected genes in these clusters were upregulated suggesting their association with reactive gliosis and/or tissue remodeling. Literature-assisted functional analysis of upregulated genes at the individual probe level confirmed extensive representation of transcripts that are associated with reactive astrocytes and/or microglial cells (29 probes targeting 25 genes, Tables 3A, 3B and 3C). Only limited changes in those transcripts were present in the ERCC1-deficient hippocampus (5 probes targeting 4 genes, Fig. 2). In addition, immunostaining for the reactive astroglia marker, glial fibrillary acidic protein (GFAP) and the reactive microglia marker, ionized calcium binding adaptor molecule-1 (IBA1), demonstrated increased presence of reactive glial cells in the cerebellum, but not hippocampus, of Ercc1-null mice at P21 (Fig. 2B and data not shown).
Table 3A.
Gliosis as a major transcriptome response in the cerebellum, but not the hippocampus of Ercc1−/− mice: reactive astrocyte markers.
| Gene | Probes | Fold change1 Cerebellum | p-value | Fold change1 Hippocampus | p-value |
|---|---|---|---|---|---|
| Gfap | 1440142_s_at 1426508_at 1426509_s_at |
3.7 2.6 2.3 |
0.0006 0.0020 0.0049 |
2.2 1.6 Unchanged |
0.0003 0.0043 |
| Gjb6 | 1448397_at | 1.9 | 0.0055 | 1.3 | 0.015 |
| Serpine2 | 1416666_at | 1.4 | 0.0203 | Unchanged | |
| Cd24a | 1448182_a_at 1437502_x_at |
2.4 2.1 |
0.0205 0.0139 |
Unchanged Unchanged |
|
| Glul | 1426235_a_at 1426236_a_at |
1.6 1.4 |
0.0243 0.0109 |
Unchanged Unchanged |
|
of wt controls
Table 3B.
Gliosis as a major transcriptome response in the cerebellum, but not the hippocampus of Ercc1−/− mice: reactive microglia markers.
| Gene | Probes | Fold change1 Cerebellum | p-value | Fold change1 Hippocampus | p-value |
|---|---|---|---|---|---|
| Ctss | 1448591_at | 2.3 | 0.0033 | 1.2 | 0.0013 |
| C1qb | 1417063_at 1437726_x_at |
1.7 1.4 |
0.0032 0.0013 |
Unchanged Unchanged |
|
| Tyrobp | 1450792_at | 1.5 | 0.0044 | Unchanged | |
| Fcgr3 | 1448620_at | 2.0 | 0.0038 | Unchanged | |
| Laptm5 | 1436905_x_at | 2.0 | 0.0180 | Unchanged | |
of wt controls
Table 3C.
Gliosis as a major transcriptome response in the cerebellum, but not the hippocampus of Ercc1−/− mice: other upregulated genes that are likely associated with reactive gliosis.
| Gene | Probes | Fold change1 Cerebellum | p-value | Fold change1 Hippocampus | p-value |
|---|---|---|---|---|---|
| Mpeg1 | 1427076_at | 1.3 | 0.0336 | 1.3 | 0.0115 |
| Gsta4 | 1416368_at | 1.3 | 0.0030 | Unchanged | |
| Gpx3 | 1449106_at | 1.4 | 0.0238 | Unchanged | |
| Mt1 | 1422557_s_at | 1.6 | 0.0207 | Unchanged | |
| Mt2 | 1428942_at | 1.5 | 0.0084 | Unchanged | |
| Mgst1 | 1415897_a_at | 1.6 | 0.0430 | Unchanged | |
| Sema3C | 1429348_at | 1.4 | 0.0494 | Unchanged | |
| Gstm7 | 1419072_at | 1.4 | 0.0118 | Unchanged | |
| C1qa | 1417381_at | 2.0 | 0.0028 | Unchanged | |
| Ctgf | 1416953_at | 1.8 | 0.0084 | Unchanged | |
| Cst3 | 1426195_a_at | 1.6 | 0.0001 | Unchanged | |
| Bmpr1b | 1437312_at | 1.3 | 0.0087 | Unchanged | |
| Cd38 | 1433741_at | 1.3 | 0.0113 | Unchanged | |
| Itgav | 1452784_at | 1.3 | 0.0067 | Unchanged | |
of wt controls
Figure 2.

Gliosis is a prominent response in the cerebellum but not the hippocampus of Ercc1−/− mice. A, Twenty-nine probes for genes associated with reactive gliosis detected upregulated transcripts in the cerebellum of Ercc1−/− mice. Only five of them revealed upregulated transcripts in the hippocampus. Upregulated or unchanged probes are depicted by red and white circles, respectively. More details on gliosis genes are presented in Table 3. B, Gliosis in the ERCC1-null cerebella was confirmed by the presence of hypertrophic astroglia and microglia with intense immunofluorescence staining for the glial fibrillary acidic protein (GFAP, green), and the ionized calcium binding adaptor molecule-1 (IBA1, red), respectively. Cerebellar regions are labeled: white matter (WM), granule layer (GL), molecular layer (ML).
Since neurodegeneration is often a trigger for reactive gliosis and PC degeneration occurs in response to deficiency of the NER nuclease XPG, we compared our microarray results to a set of 66 probes detecting PC loss-associated downregulation of 44 transcripts in the cerebellum of Purkinje cell death (Pcd) mutant mice (Rong et al., 2004) (Supplemental Table 3). At least 53 of these probes detect 33 transcripts that are enriched in Purkinje cells of young adult wt mice (Allen Brain Atlas). However, in the Ercc1-null cerebellum, most of the Pcd-downregulated transcripts were unaffected (Fig. 3A, Table 4). Only one of them (Grid2, targeted by 2 probes) was downregulated, while four other genes were upregulated (Table 4). We confirmed the absence of PC degeneration by showing their normal morphological appearance in the ERCC1-deficient mice (Fig. 3B).
Figure 3.
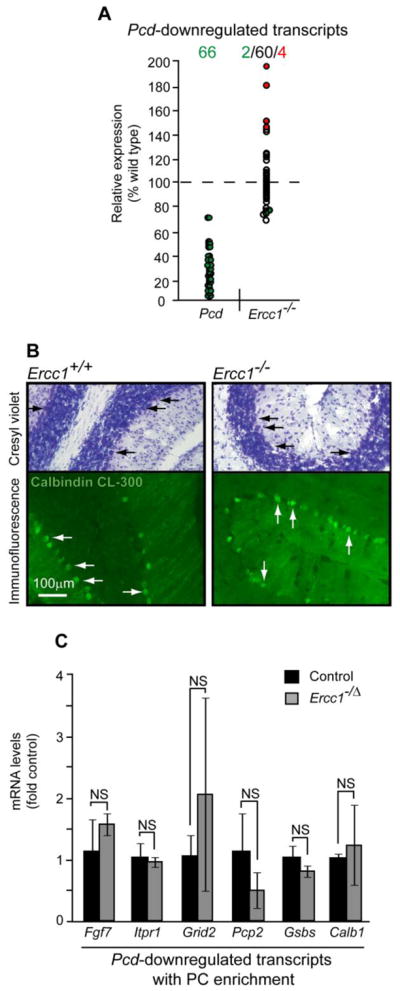
Maintenance of Purkinje cells (PCs) in the ERCC1-null cerebellum. A, Only two of sixty-six probes for genes whose downregulation is associated with the selective loss of PCs in a Pcd mutant mice were downregulated in the cerebellum of ERCC1-null mice at P21. The Pcd data are from Rong et al., 2004 (Rong et al., 2004); downregulated-, upregulated-, or unchanged probes are indicated by green, red or white circles, respectively. Table 4 presents more details on Pcd-downregulated genes that are affected in Ercc1 mutants; a complete list of the Pcd-downregulated genes is provided in Supplemental Table 3. B, PCs are present in the ERCC1-null cerebellum as determined by cresyl violet staining or immunofluorescence for the somatodendritic PC marker calbindin. Arrows indicate PC cell bodies. Calbindin-labeled PC dendrites appear similar in the ERCC1-null-, or, wt cerebellum. Three P21 animals were analyzed for each genotype; representative photomicrographs are shown. C, PC maintenance in the cerebellum of the adult Ercc1−/Δ mice. Quantitative RT-PCR of a subset of PC-enriched- and Pcd-downregulated transcripts reveals no significant changes in the cerebellum of the adult Ercc1−/Δ mice. Means±SEM from three Ercc1−/Δ (2 females, 1 male) and three control animals (1 female, 2 males) are depicted; NS, p>0.05.
Table 4.
Purkinje cell death (Pcd)-downregulated transcripts are mostly unaffected in the Ercc1−/− cerebellum
| Upregulated genes1 | Probes | Fold change2 |
|---|---|---|
| F2r | 1437308_s_at | 1.5 |
| Fgf7 | 1438405_at | 1.8 |
| Gdf10 | 1424007_at | 1.5 |
| Itih3 | 1449123_at | 2.0 |
| Downregulated genes1 | Probes | Fold change2 |
| Grid2 | 1421435_at 1421436_at |
−1.3 −1.4 |
| Unaffected genes1 | Probes | Fold change2 |
| 39 genes | 60 probes | unchanged |
pcd-downregulated transcripts as defined by Rong et al, (2004); full list of pcd-downregulated genes is in Supplemental Table 3.
of wt controls
However, since Ercc1-null mice have a maximum lifespan of 4 weeks, it is possible that this is inadequate time to develop PC degeneration. Therefore, we analyzed expression of several Pcd-downregulated transcripts in the cerebella of adult, 24–30 week old Ercc1−/Δ mice, which express approximately 10% of the normal complement of ERCC1 and show profound symptoms of neurodegeneration including ataxia (de Waard et al., 2010). None of the mRNAs associated with PC degeneration was significantly affected in the Ercc1−/Δ mice as compared to age-matched controls (Fig. 3C). In contrast, increased Gfap mRNA levels confirmed the presence of gliosis (6.3 fold of control, p<0.05). These results suggest that in the ERCC1-deficient mouse cerebellum, PCs are not compromised and that factors other than PC degeneration induce reactive gliosis.
Hippocampal gene expression patterns in ERCC1-deficient mice indicate impairment of cholesterol biosynthesis
DAVID analysis of the hippocampal transcriptome identified several functional clusters that were enriched in Ercc1-null mice. The greatest enrichment score was for overlapping clusters of genes involved in biosynthesis and metabolism of cholesterol (Table 2). Other clusters with lesser, yet significant, enrichment included oxidoreductases, plasma membrane components, lipoproteins, and synaptogenesis/neurotransmitter release genes (Table 2). Downregulation was the dominant direction for all those clusters except for the oxidoreductases.
Among the DAVID-identified components of the cholesterol biosynthesis/metabolism cluster, seven of eight affected genes (9 of 10 probes) were downregulated and one was upregulated (a single probe). Moreover, literature-assisted analysis revealed three additional downregulated genes, protein products of which are implicated in cholesterol biosynthesis and metabolism (Nsdhl, Stard4 and Insig1). The identified transcripts are listed in Table 5. Downregulation of four of the affected genes was also observed using qRT-PCR (Table 5, p<0.05). In addition, one other transcript (Sc4mol) showed a trend towards downregulation when analyzed by qRT-PCR (p<0.07, data not shown). The effect of ERCC1 deficiency on cholesterol biosynthesis and metabolism was hippocampus-specific, since no major changes to this pathway were identified in the cerebellum of Ercc1−/− mice by either microarray analysis or qRT-PCR (Fig. 4A and data not shown).
Table 5.
Downregulation of cholesterol biosynthesis and metabolism genes in the Ercc1−/− hippocampus.
| Gene name | Probes | Fold change1 | p-value | qRT PCR Validation (p<0.05)2 |
|---|---|---|---|---|
| Idi1 | 1423804_a_at | −2.0 | 0.0095 | Downregulated |
| Cyp51 | 1450646_at | −1.5 | 0.0240 | Unchanged |
| Nsdhl | 1416222_at | −1.5 | 0.0297 | Downregulated |
| Hmgcs1 | 1433443_a_at 1433445_x_at |
−1.5 −1.3 |
0.0332 0.0344 |
Unchanged |
| Dhcr24 | 1451895_a_at | −1.4 | 0.0151 | Downregulated |
| Fdft1 | 1438322_x_at 1448130_at |
−1.4 −1.4 |
0.0213 0.0260 |
Downregulated |
| Insig1 | 1454671_at | −1.4 | 0.0311 | Unchanged |
| Sc4mol | 1423078_a_at | −1.4 | 0.0260 | Unchanged |
| StarD4 | 1455011_at | −1.4 | 0.0498 | Unchanged |
| Abca1 | 1421840_at | 1.4 | 0.0255 | Unchanged |
| Acly | 1439459_x_at | −1.2 | 0.0037 | nd3 |
of wt controls
one-way ANOVA
not determined
Figure 4.

Downregulation of genes encoding components of the cholesterol biosynthesis and metabolism pathway in the ERCC1-null hippocampus. A, Comparison of the signals detected with the probes for the affected components of the pathway identified by DAVID- and the literature-assisted analyses in the hippocampus and the cerebellum of Ercc1−/− animals. Only 1 of 11 probes that identified downregulated transcripts in the hippocampus revealed a similar change in the cerebellum (Idi1). A single probe (Abca1) detected an upregulated transcript in both brain structures. Downregulated, unchanged or upregulated probes are indicated by green, white or red circles, respectively; more details are presented in Table 5. B, A schematic representation of the cholesterol biosynthesis and metabolism pathway. The downregulated and upregulated components are indicated in green and red, respectively; the changes confirmed by qRT-PCR are indicated by asterisks; not all intermediates are shown, each arrow represents one step in the pathway. C, Decreased mRNA levels of the master transcription factor for the cholesterol biosynthesis and metabolism pathway genes Srebf2 in the Ercc1−/− hippocampus. Data represent the mean±SEM of three wild-type and four Ercc1−/− mice, *, p<0.05.
Among the downregulated genes, eight encode enzymes that catalyze 12 different reactions of the cholesterol biosynthesis pathway (Fig. 4B, Table 5). The two other downregulated genes, Stard4 and Insig1 encode an intracellular cholesterol transporter and a cholesterol sensor, respectively (Nohturfft and Zhang, 2009; Soccio et al., 2005). The latter protein provides a negative regulatory feedback to the Sterol Regulatory Element Binding Transcription Factor-2 (SREBF2/SREBP2) which is the master transcriptional regulator for multiple cholesterol biosynthesis and metabolism genes (Nohturfft and Zhang, 2009). Both Stard4 and Insig1 are co-regulated by SREBF2 together with genes for cholesterol biosynthesis enzymes (Nohturfft and Zhang, 2009; Soccio et al., 2005). As all brain cholesterol is synthesized locally (Dietschy and Turley, 2001), such expression changes in cholesterol biosynthesis genes suggest lower cholesterol production in the ERCC1-deficient hippocampus.
Abca1 is the only upregulated gene of the cholesterol cluster. It encodes a transporter protein that mediates extracellular efflux of cholesterol (Fig. 4B) (Dietschy and Turley, 2001). Its upregulation was also present in Ercc1−/− mouse cerebella. Consistent with this, serum cholesterol levels are significantly elevated in ERCC1-deficient mice (Gregg et al., 2011a).
Altered expression and/or activity of SREBF2 is implicated in expression changes of multiple cholesterol biosynthesis-associated genes (Espenshade and Hughes, 2007; Nohturfft and Zhang, 2009; Suzuki et al., 2010; Valenza et al., 2005). Therefore, Srebf2 mRNA levels in the ERCC1-deficient hippocampus were measured using qRT-PCR. Despite the fact that no change in the levels of this transcript was detected by microarray analysis, qRT-PCR revealed its 36% reduction (Fig. 4C, p<0.05). Conversely, ERCC1-deficiency did not affect SREBF2 mRNA levels in the cerebellum (data not shown). Finally, qRT-PCR analysis demonstrated reduced expression of SREBF2 as well as two of its cholesterol biosynthesis target genes, Dhcr24 and Hmgcs1, in the cerebral cortex but not the cerebellum of the adult Ercc1−/Δ mice (Fig. 5A and data not shown). Hence, the decrease of SREBF2 expression likely contributes to downregulation of the cholesterol biosynthesis and metabolism pathway in ERCC1-deficient forebrains. Furthermore, this reduction is not a mere reflection of the developmental delay in brain growth that is associated with ERCC1 deficiency, but persists into adulthood, after brain development is completed.
Figure 5.

Reduced mRNA levels for the components of cholesterol biosynthesis pathway in the neocortex of adult mice with partial deficiency of ERCC1. A, Quantitative RT-PCR revealed lower mRNA levels for the critical cholesterol biosynthesis enzymes Dhcr24 and Hmgcs1 as well as their transcriptional regulator Srebf2. Data represent means ±SEM of thirteen Ercc1−/Δ (eight males and five females) and seven control animals (four males and three females); **, p<0.01; NS, p>0.05. B, We propose that in the ERCC1-deficient forebrain, reduced expression of Srebf2 results in downregulation of cholesterol biosynthesis. Such downregulation could negatively affect various cholesterol dependent processes including brain growth, synaptogenesis, myelination and the maintenance of mature synapses.
Discussion
The analysis of the cerebellar and hippocampal transcriptomes from ERCC1-deficient mice at P21 revealed that loss of the NER factor ERCC1 significantly alters gene expression patterns in a brain structure-specific manner. Transcriptome signature of reactive gliosis without any evidence of PC degeneration was observed in the cerebellum. In the hippocampus, suppression of the cholesterol biosynthesis pathway was the most robust effect caused by ERCC1 deficiency. This change was also observed in the cerebral cortex of adult mice hypomorphic for ERCC1 expression. Therefore, suppression of cholesterol biosynthesis genes in ERCC1-deficient mice is not developmentally restricted.
Absence of PC degeneration and presence of cerebellar gliosis is consistent with morphological observations from a different Ercc1-null mouse line (Lawrence et al., 2008). Our study extends those initial observations by including adult mice with a hypomorphic Ercc1 mutation and by scrutinizing a transcriptional signature of PC loss (Rong et al., 2004). Evaluating the expression of mostly PC-enriched transcripts, whose downregulation is associated with PC degeneration in Pcd mutant mice, may detect a submicroscopic injury to PCs. However, it also has limitations as the analyzed cerebellar RNA is isolated from all cellular components of that brain region. Therefore, PC degeneration-associated downregulation of PC-enriched transcripts may have been obscured by their upregulation in other cerebellar cells such as granule neurons or glia. However, as in our analysis only one of 33 PC-enriched transcripts (2 of 53 probes, Supplemental Table 3) was downregulated, the likelihood of missing major degenerative changes in PCs due to transcriptional changes in other cells appears to be low. Hence, our results indicate that at least in ERCC1-deficient cerebellum of P21-old mice, PC degeneration is not likely the trigger for gliosis. Such a conclusion is further supported by our morphological observations that the greatest frequency of reactive glia appears in cerebellar white matter but not the PC or molecular layer of the cerebellar cortex (Fig. 2). Interestingly, an extensive study of the CNS morphology in adult mice with the hypomorphic Ercc1 mutation revealed motoneuron and glial cell death in the spinal cord grey- and white matter, respectively (de Waard et al., 2010). Therefore, oligodendrocytic-, but to a lesser extent, neuronal degeneration may contribute to gliosis in the ERCC1-deficient cerebellum. Unlike in the cerebellum, no extensive gliosis was found in the hippocampus of Ercc1-null animals suggesting that at least at P21, the hippocampus was relatively unaffected by degenerative changes that would have been capable of inducing glial reactivation.
Unexpectedly, we observed that several genes whose products are involved in cholesterol biosynthesis and metabolism were downregulated in the Ercc1-null hippocampus. The presence of these Ercc1 genotype-related differences in experimental groups of mixed gender is consistent with other reports suggesting no major sexual dimorphism of brain cholesterol biosynthesis (Flynn, 1984; Quan et al., 2003). However, as gender may affect expression of cholesterol biosynthesis genes in the liver one can speculate that increasing animal number and using sex as an additional factor in the analysis could reveal even greater effects of ERCC1 deficiency on cholesterol biosynthesis in the brain (De Marinis et al., 2008).
Local cholesterol biosynthesis is the critical source of all brain cholesterol with little or no cholesterol import from the periphery (Dietschy and Turley, 2001). Conversely, the availability of cholesterol limits cell membrane production (Nohturfft and Zhang, 2009). Indeed, in the ERCC1-deficient hippocampus, downregulation of the cholesterol biosynthesis pathway is accompanied by reduced expression of genes encoding plasma membrane proteins and lipoproteins (Table 2). Therefore, one can expect that ERCC1 deficiency will likely impair membrane biogenesis-dependent processes in the brain such as myelination, synaptogenesis, synapse maintenance, and/or brain cell growth (du Souich et al., 1993; He et al., 2011; Hennekam, 2005; Hering et al., 2003; Mauch et al., 2001; Saher and Simons, 2010).
Cholesterol biosynthesis in the rodent brain peaks during the first three weeks of postnatal development, with most of the produced cholesterol being incorporated into myelin sheets (Quan et al., 2003; Saher and Simons, 2010). The possibility that ERCC1 deficiency-associated changes of cholesterol biosynthesis genes are linked to the impairment of myelination is supported by the moderate, yet significant downregulation of such transcripts as Mbp (−1.24) or Grin2C (−1.23), which in the developing mouse hippocampus are associated with differentiating oligodendrocytes (Allen Brain Atlas). In addition, as cholesterol biosynthesis is critical for synaptogenesis and synapse maintenance (Hering et al., 2003; Mauch et al., 2001), concomitant reductions in that pathway and several synaptogenesis/synaptic function-related genes that were observed in the ERCC1-deficient hippocampus suggest a possible relationship between these phenomena (Table 2). The fact that impairment of cholesterol biosynthesis is more extensive than downregulations of myelination-, synaptic- or plasma membrane/lipoprotein markers indicates that it is not a secondary response to neurodevelopmental disturbances that are present in ERCC1-deficient mice. That conclusion is also supported by the persistent downregulation of at least some components of the cholesterol biosynthesis pathway that was observed in the cerebral cortex of adult Ercc1−/Δ mice. Finally, lack of a pronounced gliosis response makes it unlikely that reduced cholesterol biosynthesis in the hippocampus follows neurodegeneration. Instead, reduced cholesterol synthesis could initiate membrane biogenesis impairment resulting in defective myelination, synaptogenesis and brain growth. Therefore, downregulation of the cholesterol biosynthesis pathway may contribute to the neurological disease that is associated with the loss of ERCC1.
The downregulation of cholesterol biosynthesis genes in the central nervous system is not unique to ERCC1-deficient mice. Similar changes were observed in spinal motoneurons from mice suffering of a motoneuron disease in response to reduced CNS expression of VEGF (Brockington et al., 2010). Likewise, downregulation of those genes and also lower levels of cholesterol precursors were found in the striatum of transgenic mice that express the Huntington disease (HD)-associated versions of human huntingtin (Valenza et al., 2007; Valenza et al., 2005). Similar changes were observed in post mortem human samples of HD brains (Valenza et al., 2005). Expression of at least some components of the cholesterol biosynthesis pathway is reduced in Alzheimer’s disease-affected brain structures (Greeve et al., 2000). Although such findings could suggests a link between reduced production of cholesterol and neurodegeneration, suppression of the cholesterol biosynthesis pathway was also observed in the hypothalamus and the cerebral cortex of diabetic mice without any major neurodegenerative pathology in the CNS (Suzuki et al., 2010). However, in that case lower cholesterol production in the brain was linked to altered lipid composition of the synapses and changes in animal behavior (Suzuki et al., 2010). Interestingly, age-dependent impairment of hippocampal function including reduced LTP and learning has been recently reported in Ercc1−/Δ mice as well as in mice with conditional deletion of Ercc1 in forebrain neurons (Borgesius et al., 2011). We speculate that suppression of cholesterol biosynthesis may contribute to the cognitive dysfunction that is associated with ERCC1 deficiency.
Our results suggest that the ERCC1 deficiency-associated downregulation of the cholesterol biosynthesis pathway is at least in part due to lowered expression of its master transcription factor SREBF2 (Espenshade and Hughes, 2007; Nohturfft and Zhang, 2009). Reduced activity of that factor has been implicated in suppression of cholesterol production in HD mice (Valenza et al., 2005). Interestingly, at least in the murine forebrain, SREBF2 expression is maintained by insulin from the periphery (Suzuki et al., 2010). Lack of insulin and the subsequent reduction of SREBF2 expression/activity have been proposed as major culprits to the negative effects of diabetes on brain cholesterol biosynthesis (Suzuki et al., 2010). Therefore, it is tempting to speculate that downregulation of forebrain SREBF2 in ERCC1-deficient mice may be a result of hypoinsulinemia and/or defects in growth hormone signaling, both of which characterize these animals (Niedernhofer et al., 2006). Alternatively, SREBF2 could be negatively regulated by the unrepaired DNA damage that is expected to accumulate in the brains of ERCC1-deficient animals (Niedernhofer et al., 2006). Finally, a recent demonstration that ERCC1 may play a role in transcription control indicates yet another possibility that ERCC1 directly contributes to transcriptional regulation of the Srebf2 gene and/or its downstream targets (Le May et al., 2010).
HMG-CoA reductase (HMGCR) is the rate-limiting enzyme of cholesterol biosynthesis and its expression is regulated by SREBF2 (Espenshade and Hughes, 2007; Goldstein and Brown, 1990). However, the Hmgcr transcript seemed unaffected in the Ercc1-null hippocampus as analyzed by microarrays. While the reasons for this apparent discrepancy between unaltered Hmgcr mRNA levels and reduced expression of Srebf2 and other cholesterol biosynthesis genes are unclear, similarly uneven effects on expression of cholesterol biosynthesis genes/enzymes have been previously reported in the nervous system (Brockington et al., 2010; Fitzky et al., 2001). In addition, HMGCR is extensively regulated at posttranslational level including its inhibition by cholesterol precursors and metabolites. Hence, disruptions of further steps of cholesterol synthesis and/or metabolism may inhibit HMGCR activity without affecting Hmgcr mRNA levels (Espenshade and Hughes, 2007; Fitzky et al., 2001; Goldstein and Brown, 1990).
Transcriptome analysis of the livers from ERCC1 deficient mice revealed several compensatory changes in response to the increased genotoxic challenge in these animals (Niedernhofer et al., 2006). They included suppression of somatotrophic axis, reduced oxidative metabolism, and enhanced DNA repair. The somatotrophic suppression was proposed to be the primary driver for the key phenotypic features associated with ERCC1 defects such as general growth inhibition and accelerated aging (Gregg et al., 2011b; Niedernhofer et al., 2006). As we have not seen much overlap between the brain and liver transcriptome responses, we speculate that the cholesterol biosynthesis pathway may be the key effector for the somatotrophic axis to stimulate growth of the brain. Hence, lower somatotrophic drive in response to ERCC1 deficiency could suppress cholesterol biosynthesis in the brain reducing growth of that organ. In fact, mutations in several cholesterol biosynthesis genes such as Dhcr24, Nsdhl, or Sc4mol, which are also downregulated in Ercc1-null mice, produce developmental disorders whose manifestations include microcephaly and mental retardation (du Souich et al., 1993; He et al., 2011; Hennekam, 2005). However, further studies are needed to determine (i) what are the effects of ERCC1 deficiency on the levels of cholesterol as well as its precursors and metabolites in the brain, and (ii) whether downregulation of cholesterol biosynthesis genes contributes to the neurological phenotype in ERCC1-deficient mice and humans.
Conclusions
Our data revealed non-overlapping transcriptional responses in the cerebellum and the hippocampus of ERCC1-deficient mice. In the cerebellum, reactive gliosis and the absence of PC degeneration suggest action of a yet unidentified gliosis-inducing stimulus. In the hippocampus, downregulation of the cholesterol biosynthesis pathway indicates a novel mechanism that may underlie neurodevelopmental disturbances and/or neurological symptoms that are associated with ERCC1 defects.
Supplementary Material
Highlights.
Gliosis is the dominant change of the cerebellar transcriptome upon ERCC1 deficiency.
No transcriptome evidence of Purkinje cell degeneration in the ERCC1-deficient brain.
Forebrain transcripts of cholesterol biosynthesis genes decline upon ERCC1 deficiency.
Defects in DNA repair may reduce cholesterol biosynthesis in the brain.
Acknowledgments
This work was supported by NIH (NS047341, RR015576, and RR031159 to MH, and ES016114 to LJN), NSF (IOS1021860 to MH), The Commonwealth of Kentucky Challenge for Excellence, and Norton Healthcare, and the Ellison Medical Foundation (AG-NS-0303-05 to LJN). The authors wish to thank Ms. Jing-Juan Zheng for excellent technical assistance and Dr. Ben Harrison for help with microarray data analysis.
List of abbreviations
- ERCC1
Excision Repair Cross-Complementing rodent repair deficiency, complementation group 1
- NER
nucleotide excision repair
- SREBF2
Sterol Regulatory Element Binding Transcription Factor-2
- XPG
Xeroderma pigmentosum group G-complementing protein
- XPF
Xeroderma pigmentosum group F-complementing protein
- Pcd
Purkinje cell death
- GFAP
glial fibrillary acidic protein
- IBA1
ionized calcium binding adaptor molecule-1
- P21
postnatal day 21
- HMGCR
3-hydroxy-3-methylglutaryl-CoA reductase/HMG-CoA reductase
- FDR
false discovery rate
- PBS
phosphate buffered saline
- GG-NER
global-genome NER
- TC-NER
transcription-coupled NER
Footnotes
Authors’ contributions
SCS and MH designed the study. SCS performed the experiments. LJN and ARR provided Ercc1-null animals and tissues from the Ercc1 hypomorphic mutant mice. SCS and MH analyzed the data and drafted the manuscript. All authors read and approved the final version of the manuscript.
Publisher's Disclaimer: This is a PDF file of an unedited manuscript that has been accepted for publication. As a service to our customers we are providing this early version of the manuscript. The manuscript will undergo copyediting, typesetting, and review of the resulting proof before it is published in its final citable form. Please note that during the production process errors may be discovered which could affect the content, and all legal disclaimers that apply to the journal pertain.
Contributor Information
Scott C. Smith, Email: scsmit11@louisville.edu.
Andria R. Robinson, Email: robinsonar@upmc.edu.
Laura J. Niedernhofer, Email: niedlx@pitt.edu.
Michal Hetman, Email: michal.hetman@louisville.edu.
References
- Borgesius NZ, de Waard MC, van der Pluijm I, Omrani A, Zondag GC, van der Horst GT, Melton DW, Hoeijmakers JH, Jaarsma D, Elgersma Y. Accelerated age-related cognitive decline and neurodegeneration, caused by deficient DNA repair. J Neurosci. 2011 Aug 31;31(35):12543–12553. doi: 10.1523/JNEUROSCI.1589-11.2011. [DOI] [PMC free article] [PubMed] [Google Scholar]
- Brockington A, Heath PR, Holden H, Kasher P, Bender FL, Claes F, Lambrechts D, Sendtner M, Carmeliet P, Shaw PJ. Downregulation of genes with a function in axon outgrowth and synapse formation in motor neurones of the VEGFdelta/delta mouse model of amyotrophic lateral sclerosis. BMC Genomics. 2010;11:203. doi: 10.1186/1471-2164-11-203. [DOI] [PMC free article] [PubMed] [Google Scholar]
- Brooks PJ. The 8,5′-cyclopurine-2′-deoxynucleosides: candidate neurodegenerative DNA lesions in xeroderma pigmentosum, and unique probes of transcription and nucleotide excision repair. DNA Repair (Amst) 2008 Jul 1;7(7):1168–1179. doi: 10.1016/j.dnarep.2008.03.016. [DOI] [PMC free article] [PubMed] [Google Scholar]
- De Marinis E, Martini C, Trentalance A, Pallottini V. Sex differences in hepatic regulation of cholesterol homeostasis. J Endocrinol. 2008 Sep;198(3):635–643. doi: 10.1677/JOE-08-0242. [DOI] [PubMed] [Google Scholar]
- de Waard MC, van der Pluijm I, Zuiderveen Borgesius N, Comley LH, Haasdijk ED, Rijksen Y, Ridwan Y, Zondag G, Hoeijmakers JH, Elgersma Y, Gillingwater TH, Jaarsma D. Age-related motor neuron degeneration in DNA repair-deficient Ercc1 mice. Acta Neuropathol. 2010 Oct;120(4):461–475. doi: 10.1007/s00401-010-0715-9. [DOI] [PMC free article] [PubMed] [Google Scholar]
- Dietschy JM, Turley SD. Cholesterol metabolism in the brain. Curr Opin Lipidol. 2001 Apr;12(2):105–112. doi: 10.1097/00041433-200104000-00003. [DOI] [PubMed] [Google Scholar]
- Dolle ME, Busuttil RA, Garcia AM, Wijnhoven S, van Drunen E, Niedernhofer LJ, van der Horst G, Hoeijmakers JH, van Steeg H, Vijg J. Increased genomic instability is not a prerequisite for shortened lifespan in DNA repair deficient mice. Mutation research. 2006 Apr 11;596(1–2):22–35. doi: 10.1016/j.mrfmmm.2005.11.008. [DOI] [PubMed] [Google Scholar]
- du Souich C, Raymond FL, Grzeschik KH, Konig A, Boerkoel CF. NSDHL-Related Disorders. In: Pagon RA, Bird TD, Dolan CR, Stephens K, editors. GeneReviews. Seattle (WA): 1993. [Google Scholar]
- Espenshade PJ, Hughes AL. Regulation of sterol synthesis in eukaryotes. Annu Rev Genet. 2007;41:401–427. doi: 10.1146/annurev.genet.41.110306.130315. [DOI] [PubMed] [Google Scholar]
- Fishel ML, Vasko MR, Kelley MR. DNA repair in neurons: so if they don’t divide what’s to repair? Mutat Res. 2007 Jan 3;614(1–2):24–36. doi: 10.1016/j.mrfmmm.2006.06.007. [DOI] [PubMed] [Google Scholar]
- Fitzky BU, Moebius FF, Asaoka H, Waage-Baudet H, Xu L, Xu G, Maeda N, Kluckman K, Hiller S, Yu H, Batta AK, Shefer S, Chen T, Salen G, Sulik K, Simoni RD, Ness GC, Glossmann H, Patel SB, Tint GS. 7-Dehydrocholesterol-dependent proteolysis of HMG-CoA reductase suppresses sterol biosynthesis in a mouse model of Smith-Lemli-Opitz/RSH syndrome. J Clin Invest. 2001 Sep;108(6):905–915. doi: 10.1172/JCI12103. [DOI] [PMC free article] [PubMed] [Google Scholar]
- Flynn TJ. Developmental changes of myelin-related lipids in brain of miniature swine. Neurochem Res. 1984 Jul;9(7):935–945. doi: 10.1007/BF00964525. [DOI] [PubMed] [Google Scholar]
- Goldstein JL, Brown MS. Regulation of the mevalonate pathway. Nature. 1990 Feb 1;343(6257):425–430. doi: 10.1038/343425a0. [DOI] [PubMed] [Google Scholar]
- Greeve I, Hermans-Borgmeyer I, Brellinger C, Kasper D, Gomez-Isla T, Behl C, Levkau B, Nitsch RM. The human DIMINUTO/DWARF1 homolog seladin-1 confers resistance to Alzheimer’s disease-associated neurodegeneration and oxidative stress. J Neurosci. 2000 Oct 1;20(19):7345–7352. doi: 10.1523/JNEUROSCI.20-19-07345.2000. [DOI] [PMC free article] [PubMed] [Google Scholar]
- Gregg SQ, Gutierrez V, Robinson AR, Woodell T, Nakao A, Ross MA, Michalopoulos GK, Rigatti L, Rothermel CE, Kamileri I, Garinis G, Stolz DB, Niedernhofer LJ. A mouse model of accelerated liver aging due to a defect in DNA repair. Hepatology. 2011a Sep 27; doi: 10.1002/hep.24713. [DOI] [PMC free article] [PubMed] [Google Scholar]
- Gregg SQ, Robinson AR, Niedernhofer LJ. Physiological consequences of defects in ERCC1-XPF DNA repair endonuclease. DNA Repair (Amst) 2011b Jul 15;10(7):781–791. doi: 10.1016/j.dnarep.2011.04.026. [DOI] [PMC free article] [PubMed] [Google Scholar]
- He M, Kratz LE, Michel JJ, Vallejo AN, Ferris L, Kelley RI, Hoover JJ, Jukic D, Gibson KM, Wolfe LA, Ramachandran D, Zwick ME, Vockley J. Mutations in the human SC4MOL gene encoding a methyl sterol oxidase cause psoriasiform dermatitis, microcephaly, and developmental delay. J Clin Invest. 2011 Mar 1;121(3):976–984. doi: 10.1172/JCI42650. [DOI] [PMC free article] [PubMed] [Google Scholar]
- Hennekam RC. Congenital brain anomalies in distal cholesterol biosynthesis defects. J Inherit Metab Dis. 2005;28(3):385–392. doi: 10.1007/s10545-005-7055-2. [DOI] [PubMed] [Google Scholar]
- Hering H, Lin CC, Sheng M. Lipid rafts in the maintenance of synapses, dendritic spines, and surface AMPA receptor stability. J Neurosci. 2003 Apr 15;23(8):3262–3271. doi: 10.1523/JNEUROSCI.23-08-03262.2003. [DOI] [PMC free article] [PubMed] [Google Scholar]
- Hoeijmakers JH. Genome maintenance mechanisms for preventing cancer. Nature. 2001 May 17;411(6835):366–374. doi: 10.1038/35077232. [DOI] [PubMed] [Google Scholar]
- Huang da W, Sherman BT, Lempicki RA. Bioinformatics enrichment tools: paths toward the comprehensive functional analysis of large gene lists. Nucleic Acids Res. 2009a Jan;37(1):1–13. doi: 10.1093/nar/gkn923. [DOI] [PMC free article] [PubMed] [Google Scholar]
- Huang da W, Sherman BT, Lempicki RA. Systematic and integrative analysis of large gene lists using DAVID bioinformatics resources. Nat Protoc. 2009b;4(1):44–57. doi: 10.1038/nprot.2008.211. [DOI] [PubMed] [Google Scholar]
- Jaspers NG, Raams A, Silengo MC, Wijgers N, Niedernhofer LJ, Robinson AR, Giglia-Mari G, Hoogstraten D, Kleijer WJ, Hoeijmakers JH, Vermeulen W. First reported patient with human ERCC1 deficiency has cerebro-oculo-facio-skeletal syndrome with a mild defect in nucleotide excision repair and severe developmental failure. Am J Hum Genet. 2007 Mar;80(3):457–466. doi: 10.1086/512486. [DOI] [PMC free article] [PubMed] [Google Scholar]
- Lawrence NJ, Sacco JJ, Brownstein DG, Gillingwater TH, Melton DW. A neurological phenotype in mice with DNA repair gene Ercc1 deficiency. DNA Repair (Amst) 2008 Feb 1;7(2):281–291. doi: 10.1016/j.dnarep.2007.10.005. [DOI] [PubMed] [Google Scholar]
- Le May N, Mota-Fernandes D, Velez-Cruz R, Iltis I, Biard D, Egly JM. NER factors are recruited to active promoters and facilitate chromatin modification for transcription in the absence of exogenous genotoxic attack. Mol Cell. 2010 Apr 9;38(1):54–66. doi: 10.1016/j.molcel.2010.03.004. [DOI] [PubMed] [Google Scholar]
- Li C, Wong WH. Model-based analysis of oligonucleotide arrays: expression index computation and outlier detection. Proc Natl Acad Sci U S A. 2001 Jan 2;98(1):31–36. doi: 10.1073/pnas.011404098. [DOI] [PMC free article] [PubMed] [Google Scholar]
- Mauch DH, Nagler K, Schumacher S, Goritz C, Muller EC, Otto A, Pfrieger FW. CNS synaptogenesis promoted by glia-derived cholesterol. Science. 2001 Nov 9;294(5545):1354–1357. doi: 10.1126/science.294.5545.1354. [DOI] [PubMed] [Google Scholar]
- Niedernhofer LJ. Nucleotide excision repair deficient mouse models and neurological disease. DNA Repair (Amst) 2008 Jul 1;7(7):1180–1189. doi: 10.1016/j.dnarep.2007.12.006. [DOI] [PMC free article] [PubMed] [Google Scholar]
- Niedernhofer LJ, Garinis GA, Raams A, Lalai AS, Robinson AR, Appeldoorn E, Odijk H, Oostendorp R, Ahmad A, van Leeuwen W, Theil AF, Vermeulen W, van der Horst GT, Meinecke P, Kleijer WJ, Vijg J, Jaspers NG, Hoeijmakers JH. A new progeroid syndrome reveals that genotoxic stress suppresses the somatotroph axis. Nature. 2006 Dec 21;444(7122):1038–1043. doi: 10.1038/nature05456. [DOI] [PubMed] [Google Scholar]
- Niedernhofer LJ, Odijk H, Budzowska M, van Drunen E, Maas A, Theil AF, de Wit J, Jaspers NG, Beverloo HB, Hoeijmakers JH, Kanaar R. The structure-specific endonuclease Ercc1-Xpf is required to resolve DNA interstrand cross-link-induced double-strand breaks. Mol Cell Biol. 2004 Jul;24(13):5776–5787. doi: 10.1128/MCB.24.13.5776-5787.2004. [DOI] [PMC free article] [PubMed] [Google Scholar]
- Nohturfft A, Zhang SC. Coordination of lipid metabolism in membrane biogenesis. Annu Rev Cell Dev Biol. 2009;25:539–566. doi: 10.1146/annurev.cellbio.24.110707.175344. [DOI] [PubMed] [Google Scholar]
- Quan G, Xie C, Dietschy JM, Turley SD. Ontogenesis and regulation of cholesterol metabolism in the central nervous system of the mouse. Brain Res Dev Brain Res. 2003 Dec 19;146(1–2):87–98. doi: 10.1016/j.devbrainres.2003.09.015. [DOI] [PubMed] [Google Scholar]
- Rong Y, Wang T, Morgan JI. Identification of candidate Purkinje cell-specific markers by gene expression profiling in wild-type and pcd(3J) mice. Brain Res Mol Brain Res. 2004 Dec 20;132(2):128–145. doi: 10.1016/j.molbrainres.2004.10.015. [DOI] [PubMed] [Google Scholar]
- Saher G, Simons M. Cholesterol and myelin biogenesis. Subcell Biochem. 2010;51:489–508. doi: 10.1007/978-90-481-8622-8_18. [DOI] [PubMed] [Google Scholar]
- Soccio RE, Adams RM, Maxwell KN, Breslow JL. Differential gene regulation of StarD4 and StarD5 cholesterol transfer proteins. Activation of StarD4 by sterol regulatory element-binding protein-2 and StarD5 by endoplasmic reticulum stress. J Biol Chem. 2005 May 13;280(19):19410–19418. doi: 10.1074/jbc.M501778200. [DOI] [PubMed] [Google Scholar]
- Sun XZ, Harada YN, Takahashi S, Shiomi N, Shiomi T. Purkinje cell degeneration in mice lacking the xeroderma pigmentosum group G gene. J Neurosci Res. 2001 May 15;64(4):348–354. doi: 10.1002/jnr.1085. [DOI] [PubMed] [Google Scholar]
- Suzuki R, Lee K, Jing E, Biddinger SB, McDonald JG, Montine TJ, Craft S, Kahn CR. Diabetes and insulin in regulation of brain cholesterol metabolism. Cell Metab. 2010 Dec 1;12(6):567–579. doi: 10.1016/j.cmet.2010.11.006. [DOI] [PMC free article] [PubMed] [Google Scholar]
- Valenza M, Leoni V, Tarditi A, Mariotti C, Bjorkhem I, Di Donato S, Cattaneo E. Progressive dysfunction of the cholesterol biosynthesis pathway in the R6/2 mouse model of Huntington’s disease. Neurobiol Dis. 2007 Oct;28(1):133–142. doi: 10.1016/j.nbd.2007.07.004. [DOI] [PubMed] [Google Scholar]
- Valenza M, Rigamonti D, Goffredo D, Zuccato C, Fenu S, Jamot L, Strand A, Tarditi A, Woodman B, Racchi M, Mariotti C, Di Donato S, Corsini A, Bates G, Pruss R, Olson JM, Sipione S, Tartari M, Cattaneo E. Dysfunction of the cholesterol biosynthetic pathway in Huntington’s disease. J Neurosci. 2005 Oct 26;25(43):9932–9939. doi: 10.1523/JNEUROSCI.3355-05.2005. [DOI] [PMC free article] [PubMed] [Google Scholar]
- Volker M, Mone MJ, Karmakar P, van Hoffen A, Schul W, Vermeulen W, Hoeijmakers JH, van Driel R, van Zeeland AA, Mullenders LH. Sequential assembly of the nucleotide excision repair factors in vivo. Mol Cell. 2001 Jul;8(1):213–224. doi: 10.1016/s1097-2765(01)00281-7. [DOI] [PubMed] [Google Scholar]
Associated Data
This section collects any data citations, data availability statements, or supplementary materials included in this article.