Abstract
This paper studies the trends in life expectancy in Malawi since independence and offers possible explanations regarding inter-temporal variations. Descriptive analysis reveals that the life expectancy in Malawi has trailed below the Sub Saharan African average. From the 1960s through to the early 1980s life expectancy improved driven mainly by rising incomes and the absence of HIV/AIDS. In the mid 1980s life expectancy declined tremendously and never improved due to the spread of HIV/AIDS, the economic slump that followed the World Bank's Structural Adjustment programmes (SAP) and widespread corruption and poor governance in the era of democracy. At the turn of the new millennium, Malawians were no healthier than their ancestors at the dawn of independence though this improved after 2004. If Malawi is to meet its health Millennium Development Goals by 2015, good governance, improved agricultural performance and an increase in health expenditure should be at the heart of its development policies.
Introduction
Life expectancy in Malawi has declined substantially since the late 1980s and yet no major studies have been undertaken to investigate this. Life expectancy is an aggregated index of the number of years a new born baby would be expected to live if the prevailing factors and mortality patterns at the time of birth are to stay the same. It is an aggregate measure of population health and can be perturbed by other national level aggregated variables.
Fayissa & Gutema argued that a healthy population is important in achieving improved human welfare, and is a desirable end in itself.1 Understanding the context specific aggregate determinants of population health and factors that affect them is crucial for the reduction of future decline in life expectancy and is instrumental in the design of policies that enhance national development through a healthy labour force.
A healthy labour force is a precondition for economic growth and for a country to achieve long term sustained growth, macroeconomic factors that hinder attainment of high life expectancies must be considered. The success of east Asian countries (Malaysia, Singapore, Korea) has been partly attributed to a healthy labour force. An incomes provides access to health care, better sanitation, and improved nutrition.2
Literature on international improvements in life expectancy show that the second half of the twentieth century has been characterised by improving life expectancy in many countries. Between 1960 and 1995, developing countries have added 22 years to their life expectancy while developed countries have added about 8 years.3 If Malawi experienced this trend, the life expectancy by 1990 would have been around 60 years. However this has not been the case.
Studies show that improvements in longevity in the 19th century were driven mainly by improvements in nutrition largely as a result of higher incomes and not by merely by advances in medicine or public health.4 Population health is multifaceted driven by both incomes and advances in medicine therefore any study on life expectancies should consider these factors.
The relationship between life expectancy and incomes should be interpreted with caution. Findings from studies have suggested that whether incomes will always influence health depends on the levels of income and the nature of its distribution. Studies have shown disparities in life expectancy among nations with equal incomes per capita. For instance, at a Gross National Product (GNP) per capita of $600, life expectancy is 69 years in Honduras, whereas it is 51 years in Senegal.5 Moreover, some countries with higher incomes per capita, such as oil producing countries do register lower life expectancies. In line with this, evidence shows shifts in the health production function mainly due to income distribution rather than rises in incomes per capita.6,7
Research has focused mainly on the importance of microeconomic variables in determining life expectancy with few rigorous studies relating the aggregated variables at the macroeconomic level to life expectancy. Nevertheless, studies of macroeconomic determinants of health are equally important as knowledge of which macroeconomic variables need attention in our pursuit for longer life spans would be instrumental for national healthy policy and development.
The National Statistics Office (NSO) reported Malawi's life expectany as 36 years for male and 39 for females.8. Adam Smith asked in his celebrated book, In enquiry into the Nature and Causes of the Wealth of Nations, why some countries were richer than others. It becomes natural in the wake of such massive differences in life expectancy to ask questions such as ‘what causes variations in life expectancies over time?’ This study purports to descriptively study the trend of life expectancy between 1960 and 2003 and examine any association between life expectancy and health and economic policy.
Methods
To examine life expectancy trends, data from International Financial Statistics and World Bank's world development indicators were collected. Data on Gross Domestic Product (GDP) and life expectancy from 1960–2003 was partitioned into half decadal averages. Data on total health expenditure per capita was collected to show the co-movement between GDP per capita, life expectancy and expenditure on health over time.
For purposes of clarity, growth rates of the GDP per capita and life expectancy are calculated every half decade and the results are presented in graphs. This has an advantage of explicitly showing the pattern of decline in variables and further renders an opportunity for comparison of the series. Pearson correlation coefficients are used to support the study's findings.
Results
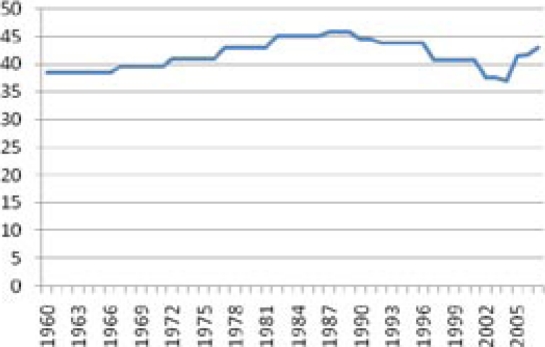
Figure 1 shows that between 1960 and 1989 life expectancy in Malawi improved steadily from around 38 years to 45 years. Life expectancy started declining sharply from 1990 and by 2003 it had fallen below the 1960 value of around 38 years to 37 years. Within a decade (1990–2003) an average Malawian lost almost 8 years from his/her expected life. The downward trend however seems to improve from 2004 and by 2007, the national expected life expectancy stood at around 41 years.
Fig 1.
Life expectancy over time in Malawi
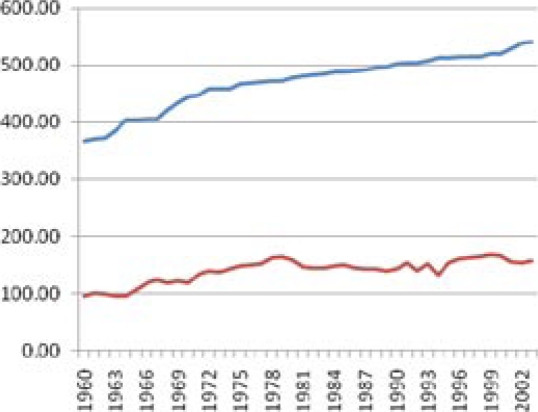
Figure 2 shows that Malawi's economy other Sub Saharan Africa. The GDP for Malawi is everywhere below the average of that of sister nations.The graph shows the steadily rising GDP between 1960 and 1979 and then a slump between 1980 and 1989.
Figure 2.
GDP over time for Sub Saharan Africa and Malawi blue line - Subsaharan African GDP, brown line = Malawi GDP
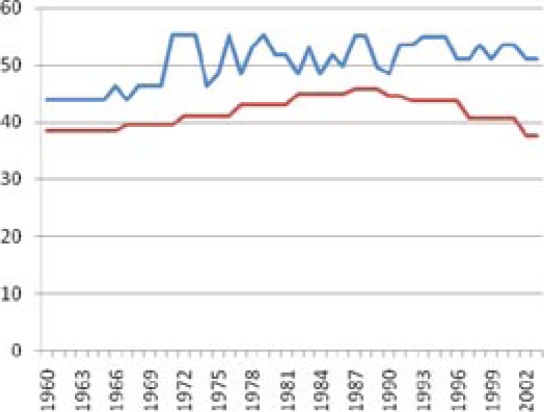
Figure 3 shows trends in life expectancy for Malawi and Sub-Saharan Africa from 1960 to 2003. Malawians have a shorter life expectancy than their sub saharan counterparts African.
Figure 3.
Life expectancy for Africa and Malawi (1960–2003) blue line - Subsaharan African life expectany, brown line = Malawi life expectancy
Table 1 shows half-decadal averages of life expectancy and GDP per capita. Life expectancy deteriorated in the first part of 2000s but started improving after 2004.
Table 1.
Half decadal averages in life expectancy and GDP
| Decade | Life expectancy | GDP$ (ppp)/capita |
| 60–64 | 38.43 | 98.05 |
| 65–69 | 39.31 | 120.43 |
| 70–74 | 40.69 | 140.30 |
| 75–79 | 42.58 | 156.91 |
| 80–84 | 44.62 | 146.72 |
| 85–89 | 45.426 | 142.42 |
| 90–94 | 43.954 | 145.99 |
| 95–99 | 41.318 | 163.91 |
| 00–04 | 38.60 | 155.06 |
| 05–07 | 40.77 | 163.43 |
Table 2 shows bivariate correlations between life expectancy, incomes per capita and per capita expenditure on health. It shows that life expectancy is positively and significantly correlated with incomes per capita. While health expenditure per capita is positively correlated with life expectancy, the coefficient is not statistically significant at the recognized levels of .01, 0.05 or 0.1.
Table 2.
Correlations
| Life Expectancy |
Total health expediture/ capita |
GDP | ||
| Life Expectancy | Peasron Correlation |
1 | .321 | .498** |
| Sig. (2 tailed) | .367 | .001 | ||
| N | 44 | 10 | 44 | |
| Total health expenditure/ capita |
Pearson Correlation |
.321 | 1 | .551 |
| Sig. (2 tailed) | .367 | .098 | ||
| N | 10 | 10 | 10 | |
| GDP/capita | Pearson Correlation |
.498** | .551 | 1 |
| Sig. (2 tailed) | .001 | .098 | ||
| N | 44 | 10 | 44 |
The national HIV/AIDS prevalence among the adults (15–49 years) increased at an alarming rate between the 1980s and the late 1990s. After 1997 the prevalence was been almost constant. (NAC, 2003)
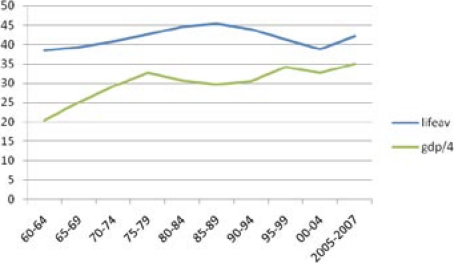
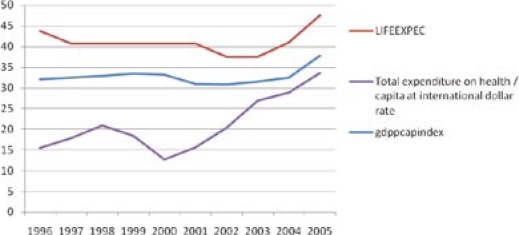
Figure 4 shows the relationship between GDP and life expectancy. To make variations in both series conspicuous and ease comparability, GDP per capita has been scaled down by 4. In figure 5, it can be seen from the figure that there is co-movement between life expectancy and GDP per capita supporting the findings from the Pearson correlation coefficients that there is a relationship between the two variables. The positive (though insignificant) correlation coefficients from Table 2 are also confirmed by the trend of health expenditure per capita and life expectancy between 1996 and 2007.
Figure 4.
GDP per capita and life expectancy (GDP scaled down by 1/4)
Figure 5.
Life expectancy, GDP/capita and health expenditure per capita
Discussion
This study has shown that at the dawn of independence in 1964, the life expectancy was low but under the leadership of the former late President Dr. Banda life expectancy improved from 37 years in 1960 to 45 years by 1989. After 1989 the health index declined until 2004 when it started to improve. There is an association between life expectancy and health and economic policies. Specifically, income per capita did influence the variations in life expectancy. This supports the findings of Wilkinson, who argues that though there may be a two-way causality between GDP and health, incomes influence health, such that at lower incomes the relationship is stronger than otherwise.9
The rise in life expectancy during Dr H Banda can be attributed to a controlled economy with a highly subsidized agricultural sector until 1980s. Dr Banda's regime emphasized agriculture, he is famous for saying ‘chuma chili mthaka’ (land is wealth).10 Improved diets following successful agricultural production reduced rural death rates and increased life expectany. It can be seen from figure 4, that improvement in life expectancies was associated with increasing incomes per capita. It can be concluded that although Banda's rule was totalitarian, his agricultural, health and macroeconomic stabilization policies did increase life expectancies.
Soon after reaching its peak of 45 years in 1989, life expectancy starts to decline reaching 37 years by 2003. Between 1980 and 2003, three important events related to population health took place. Firstly, in the early 1980s, Dr Banda's government began implementing economic reforms, namely the Structural Adjustment Programmes (SAP) imposed by the Word Bank. Under the SAP, government liberalized its markets and ceased subsidizing agriculture. It also reduced funding the health sector as most of the budget was to finance debt repayment.11 Secondly, the mid 1980 saw the first case of the HIV/AIDS virus being reported in Malawi.12 Thirdly, at the turn of the 1990s, Malawi moved from one party leadership to multiparty democracy.
Figure 1 shows that in the 1980s, life expectancy started increasing but at a slower rate and started decreasing in the 1990s. A possible explanation is that the SAP compromised people's health by decreasing agricultural output and income. Furthermore, HIV/AIDS started claiming many lives. In the absence of any health initiatives, declining incomes and HIV/AIDS helped bolster the decline in life expectancy. HIV/AIDS as of 2004 currently affects 14.1% of the population translating to around 1.7 million victims.12
Multiparty democracy and the United Democratic Front government under Bakili Muluzi in the 90s is characterized by corruption, financial mismanagement and moral erosion resulting in widespread and deepening poverty.13 The economic gains made after SAPs were lost during the democratic era under Bakili Muluzi despite an increase in donor funds the downward trend in life expectancy was never reversed.
One would expect that under multiparty democracy, the economy should improve. Under Muluzi's democracy, the government introduced several health initiatives. In the mid 1990s, Tuberculosis (TB) was a leading cause of death in Malawi, the government launched the National TB control Program (NTP) and since has implemented the Directly Observed Therapy Short course (DOTS).12 In 2002, the Malawi TB-HIV technical team implemented a three year plan for joint TB-HIV/AIDS services based on World Health Organization and UNAIDS recommendations. There have also been several projects aimed at controling malaria by Population Services International. The National Aids Commission with funding from Global Fund has financed several health programmes.
The efforts by the private sector and non governmental organiztions had some positive impacts but on the other hand programs like the Expanded Program on Immunization (EPI) that was piloted in 197614 which led to a decline in childhood mortality had no effect on life expectancy with population health even deteriorating. Moreover about 52,000 new cases of TB are still reported every year by the World Health Organization, 14.1% of the adult population (age 15–49 years) has the HIV virus, and malaria continues to infect a large part of the population. Infant mortality rate stands at 104 per 1,000 live births, and the under-five mortality rate stands at 188 per 1,000 live births. The maternal mortality rate is high at 984 per 100, 000 in 2004.8
A plausible explanation for this continued decline in health sub indicators despite many initiatives under Muluzi can be attributed to the nature of his leadership. Under his rule agriculture was no longer emphasized this led to the collapse of the Agricultural Development and Marketing Corporation and deteriorating agricultural prices. Crime increased and by 1999 economic growth began to slow down. The Anti Corruption Bureau (ACB) was formed but was perceived as a body established to appease opposition politicians. Under such conditions health service delivery became compromised and the effects of the reported health initiatives became masked by the effects of corruption and hunger.
Expenditure on health has been shown to be positively correlated with life expectancy though the relationship in this study's dataset was not statistically significant. The absence of a strong relationship might be due to the shorter length of the health expenditure series or the efficacy of different health financing systems on actual population health. The effect of the government's Sector Wide Approach (SWAp) needs to be studied further. Additional, emergency human resource programs that are being implemented in the country could further positively impact on overall population health, this too calls for further exploration.
Presently, the current President Bingu wa Mutharika's government has embraced the pro-poor policies that characterised a good part of Dr Banda's government. Fertilizer subsidy progams has increased food production. Government's hardline on corruption coupled with macroeconomic prudence, have yielded improved economic growth and a glimmer of hope for life expectancy.
Conclusion
Despite absence of econometric analysis, this study concludes that the improvement in life expectancy between the 1960s 80s and the subsequent decline in the 1990s can be attributed to changes in the agricultural policy, political governance, health policy, and the scourge of HIV/AIDS. Therefore in order to improve population health, the government should implement policies that generate economic growth and should increase expenditure on health as these both would have a positive impact on life expectancy. If the country is to meet its health Millennium Development Goals by 2015, the government should uphold macroeconomic prudence through macroeconomic stabilization policies and endeavour to stop corruption.
Future research should explore the relationship between microeconomic data, age specific life expectancy, literacy levels. staffing levels in the health sector, and the Emergency Human Resource Programme. Time series analysis techniques may determine the causes of the decline in life expectancy. One may examine how exchange rates have directly influenced mortality or how aid and the mechanism of funding have affected the life expectancy. This study's short series of health expenditure per capita does not show a statistically significant influence on life expectancy, studies on the Sector Wide Approaches to funding versus their alternatives could be worthwhile.
References
- 1.Fayissa B, Gutema P. Estimating a health production function for Sub-Saharan Africa. Applied Economics. 2005;37:155–164. [Google Scholar]
- 2.Sapolsky RM. Why zebras don't get ulcers: A guide to stress, stress-related diseases and coping. New York: W H Freeman and Company; 1994. [Google Scholar]
- 3.WHO-CMH (World Health Organization Commission for Macroeconomics and Health), author Macroeconomics and Health: Investing in Health for Economic Development. Geneva: WHO; 2001. [Google Scholar]
- 4.Fogel RW. Economic growth population theory and physiology: The bearing of long term processes on the making of economic policy. American Economic review. 1994;84(3):369–395. [Google Scholar]
- 5.Subramanian SV, Belli P, Kawachi I. The macroeconomic determinants of health. Annual Review of Public Health. 2002;23:287–302. doi: 10.1146/annurev.publhealth.23.100901.140540. [DOI] [PubMed] [Google Scholar]
- 6.Preston SH. Causes and consequences of mortality decline in less developed countries in the twentieth century. In: Easterlin, editor. Population and Economic change in developing countries. Chicago: University of Chicago Press; 1980. [Google Scholar]
- 7.Easterlin RA. How beneficent is the market? A look at the modern history of mortality. European Review of Economic History. 1999;3(3):257–294. doi: 10.1017/s1361491699000131. [DOI] [PubMed] [Google Scholar]
- 8.Smith A. An inquiry into the nature and causes of the wealth of nations. Oxford: Clarendon Press; 1776. [Google Scholar]
- 9.National Statistics Office, author. Malawi demographic health survey. Zomba, Malawi: National Statistics Office; 2004. [Google Scholar]
- 10.Wilkinson RG. Income distribution and life expectancy. British Medical Journal. 1992;304:165–168. doi: 10.1136/bmj.304.6820.165. [DOI] [PMC free article] [PubMed] [Google Scholar]
- 11.Thomas M. The modern rise of population. New York: New York Academic Press; 1976. [Google Scholar]
- 12.WHO, (World-Health-Organization), author Making a difference. Geneva: WHO; 1976. [Google Scholar]
- 13.USAID, author. Malawi: tuberculosis profile. 2006
- 14.Trocare, author. Malawi's overwhelmed healthcare system. Trocare; 2007. [15/12/2007]. http://trocaire.ie/news/story?id=765. [Google Scholar]
- 15.GAVI GLOBAL ALLIANCE FOR VACCINES AND IMMUNISATION, author. Financing of immunisation services in Malawi:16th GAVI Board meeting. Paris: GAVI; 2005. [Google Scholar]
- 16.NATIONAL AIDS COMMISSION(NAC), author Estimating National HIV Prevalence in Malawi from Sentinel Surveillance Data: Technical Report. Lilongwe: National Aids Commission; 2003. [Google Scholar]
- 17.Thomas S. Economic Developments in Malawi since Independence. Journal of Southern African Studies. 1975;2(1):30–51. [Google Scholar]


